The pentaquark potential, mass and density-density correlator
Abstract
We evaluate the static potential in the quenched theory at and on a lattice of size . The mass and density-density correlator for the is investigated in the quenched theory at on lattices of size , and .
1 Introduction
A large amount of effort is being devoted to experimental searches for the identification of the , an exotic baryon state with an unusually narrow width. The possible existence of such a state has raised interesting questions about its structure. A number of phenomenological models have been put forward to explain its stability such as special flux tube formation [1] and diquark formation [2]. The focus of lattice studies has been the calculation of the mass and the identification of its parity [3, 4]. In this work we look at the density-density correlator which yields information on the quark distribution inside a hadron. In addition we evaluate the static pentaquark potential by constructing the pentaquark Wilson loop. We compare the static pentaquark potential to the potential extracted in the strong coupling approximation as well as to the sum of the baryonic and mesonic potentials.
2 Static potential
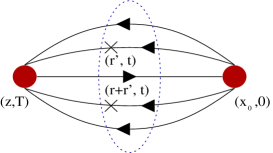
The SU(3) Wilson loop for the pentaquark is shown in Fig. 1: it is constructed by creating a gauge invariant quark state at time which is annihilated at a later time [5]. We consider two geometries as shown in Fig. 2. Geometry I is based on the KN structure whereas geometry II on the diquark structure probed as a function of the distance . The potential is extracted by fitting the ratio in the plateau region. We use multi-hit on the temporal links and 30 levels of APE smearing on the spatial links with smearing weight .


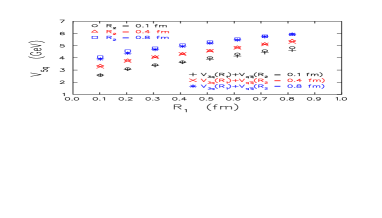
All the computations are carried out on a lattice of size at and using 200 configurations available at the NERSC archive. Comparison of data at these two -values shows that the potential has good scaling properties [5]. The results for the pentaquark potential using geometry I are shown in Fig. 3. On the same figure we also show lattice data for the sum of the corresponding baryonic potential, , and the mesonic . As can be seen the pentaquark potential is the same as the potential of the KN system. In Fig. 4 we show the pentaquark potential using geometry II for two very different values of the distance : 1) For fm, which is the smallest possible separation at , the potential for is well described by
| (1) |
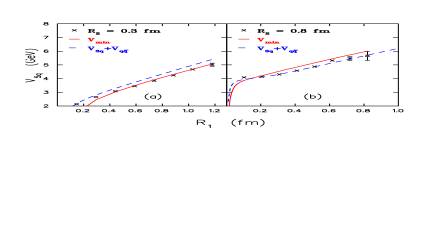
where is the minimal length joining the quarks. and are extracted from fitting the potential to the form and the factor in front of the Coulomb term is one between and and 1/2 between (anti-)quarks as obtained from one-gluon exchange. This genuine pentaquark state has static energy which is lower than the sum of the baryonic and mesonic potentials. 2) For fm, which is the largest possible separation at and for which , the results are well described by the sum of the baryonic and mesonic potentials and only for larger distances they tend to approach . For this comparison the baryonic potential is parametrized using the Ansatz: .
3 Mass and density - density correlator
The purpose is to study the distribution of quarks inside the given that we can identify it on our lattices. The quark distribution can be studied via the density-density correlator shown in Fig. 5 and given by [6]
| (2) |
where for quark of flavour . In the non-relativistic limit it reduces to the wave function squared. Therefore the correlator probes the wave function in a gauge-invariant way unlike Bethe - Salpeter amplitudes.
We use Wilson fermions and lattices of size , and at . We impose Dirichlet (anti-periodic) boundary conditions in the temporal direction for the lattices of temporal size (64). We fix for the strange quark propagator. This choice gives and close to the experimental ratios. The light quark propagators are computed at 0.153, 0.154, 0.155, 0.1554, 0.1558 and 0.1562 with the two largest done only on the lattice. For the interpolating field we use the diquark-diquark combination:
| (3) |
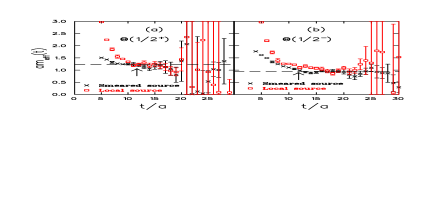
Our effective masses for a Wuppertal smeared and local source are shown in Fig. 6 for . For the the plateaus coincide for whereas for only when . Beyond this time separation only one plateau can be identified. In order to establish whether in this time range we have a bound state we compare the volume dependence of the weights in the two-point function [4] using local source and sink. We fit in the range (11-15) for the and in the range (16-22) for the where smeared and local sources give the same plateaus. Denoting by the weight of the state on a lattice of spatial size we find at for the , and and for the , and where the errors are only statistical i.e. evaluated within a one parameter fit of the correlators giving as input the mass extracted from first fitting keeping the fitting ranges the same. Similar values are obtained at . If the state is a scattering state the ratios should scale like the spatial volume i.e , and . The values for the ratios that we find are closer to one supporting single particle states. Extracting the mass from lattice data with a smeared source at and 0.1562 on the lattice and extrapolating to the chiral limit we find for the mass ratios and where is the nucleon mass.
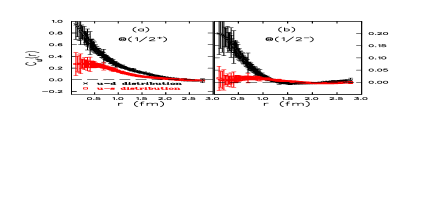
The density operators are inserted at , which is within the plateau range for both parity states when a smeared source is used. We show the results for obtained with 100 configurations on the lattice. Comparison of and for and shows that the u-s quark distribution is broader than the u-d distribution in particular for the .
4 Conclusions
The pentaquark potential for geometries that favour diquark formation is well described by as given in Eq. (1). Otherwise the potential is closer to the sum of the baryonic and mesonic potentials. The ratio of weights of the correlators on spatial volumes , and are closer to one indicating a single particle state. Extrapolating to the chiral limit we find that the mass of the is 2.56(11) GeV and the mass of is 1.46(3) GeV where we used the nucleon mass to convert to physical units. However one has to keep in mind that the lower KN scattering states can not be clearly identified in the current analysis. The density-density correlators show that in both parity states of the the u-s quark distribution is broader than the u-d distribution. This difference is particularly striking in the case of the .
References
- [1] A. Casher and S. Nussinov, Phys. Lett. B578, 124 (2004).
- [2] R. Jaffe and F. Wilczek, Phys. Rev. Lett. 91, 232003 (2003).
- [3] F. Csikor et al., JHEP 0311 (2003) 070; S. Sasaki, hep-lat/0310014; T.-W. Chiu and T.-H. Hsieh, hep-ph/0403020; N. Ishii, et al., hep-lat/0408030.
- [4] N. Mathur et al., hep-ph/0406196.
- [5] C. Alexandrou and G. Koutsou, hep-lat/0407005.
- [6] C. Alexandrou, Ph. de Forcrand and A. Tsapalis, Phys. Rev. D 65, 054503 (2002); Nucl. Phys. (Proc.Suppl.) 106, 403 (2002); Nucl. Phys. (Proc.Suppl.) 119, 667 (2003).