Comparing matrix models and QCD lattice data with chemical potential
Abstract
We present a quantitative analysis of the microscopic Dirac spectrum which is complex in the presence of a non-vanishing quark chemical potential. Data from quenched SU(3) lattice simulations for different volumes and small values of the chemical potential are compared to analytical predictions from matrix models. We confirm the existence of two distinct limits for weakly and strongly nonhermitian Dirac operators. Good agreement is found in both limits, confirming the different scaling of chemical potential and eigenvalues with the volume.
1 Introduction
Lattice QCD at nonzero density remains a difficult topic. Several methods to solve the problems related to the complex phase of the Dirac operator determinant have recently been suggested: multiparameter reweighting, Taylor expansion, and analytic continuation from imaginary [1]. So far, all three methods work only in the vicinity of the phase transition close to the temperature-axis. Here, we instead explore the -axis at zero temperature and small . In this region matrix models analytically predict the complex microscopic Dirac spectrum [2]. We test these predictions for pure SU(3) gauge theory [3], where is easily implemented. Although the quenched approximation is problematic [4], our test is an important check, as the matrix model remains valid and predictive for flavors. For example, the 1-flavor matrix model has been used to test a new factorization algorithm for the complex action problem [5]. In fact, at the situation is analogous: while most tests of matrix model predictions have been performed only for pure gauge theories, dynamical fermions are also well described [6]. For a review of matrix models in QCD we refer to Ref. [7].
2 Matrix model predictions
In Ref. [2] a matrix model has been formulated in terms of complex eigenvalues and solved in the limit . It has the same global symmetries as QCD at due to an equivalence [8] to the matrix model of Ref. [4] at small in the phase with broken chiral symmetry. We give here only the quenched results for the microscopic density and refer to Ref. [2] for more details and higher-order correlation functions.
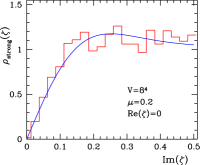
In Ref. [2] two different large- limits were found, those of weak and of strong nonhermiticity. In QCD at , the lowest Dirac eigenvalues scale with to build up a finite condensate according to the Banks-Casher relation. In the weak-nonhermiticity limit, first introduced in [9], this scaling remains unchanged. The support of the density remains quasi one-dimensional as we send , keeping fixed. In the strong-nonhermiticity limit, the eigenvalues fill a two-dimensional surface, and thus the scaling is modified to . We find for the quenched microscopic density at weak nonhermiticity in the sector of topological charge [2]
Here, we have rescaled the complex eigenvalues according to . At strong nonhermiticity, is kept fixed as , and one obtains [2]
| (2) |
rescaling the eigenvalues according to . The microscopic density Eq. (2) is rotationally invariant in contrast to the macroscopic support.
3 Lattice Data at
Our lattice calculations were done using the staggered Dirac operator with chemical potential for a pure SU(3) gauge theory, corresponding to . There are two reasons for this choice. First, we need high statistics ( configurations111The data in Figs. 1,2 contain only 4,000 configurations, therefore the statistical errors are larger.) to test the matrix model predictions of Eqs. (2,2). Ginsparg-Wilson type operators would be too expensive here. Second, Wilson fermions break chiral symmetry explicitly and have complex eigenvalues already at .
In the simulations, we have chosen in the strong-coupling regime for the following reason. At zero temperature and the matrix model [10] is equivalent to a low-energy effective theory of QCD (the effective chiral Lagrangian) in the so-called -regime, where the zero-momentum modes of the pseudo-Goldstone bosons dominate (see e.g. [7]). When the nonzero-momentum modes start contributing, this equivalence breaks down. The corresponding scale, the so-called Thouless energy, is a function of both and . As is increased, fewer eigenvalues are described by the matrix model, an effect that can be compensated by increasing . For our small volumes , however, we are limited to relatively small values of (assuming a similar behavior of the Thouless energy for small ).
At strong coupling and thus away from the continuum limit, staggered fermions have the disadvantage of shifting the (topological) Dirac zero modes and mixing them with the nonzero modes. We have accounted for this by setting in Eqs. (2) and (2) above.
The three different lattice volumes are chosen in order to test the different scaling behavior of eigenvalues and chemical potential for weakly and strongly nonhermitian lattice Dirac operators. For more simulation details we refer to [3].
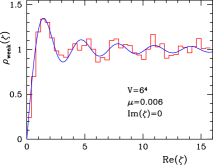
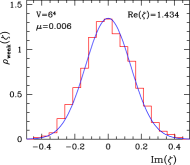
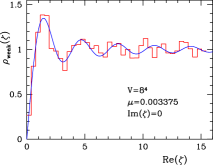
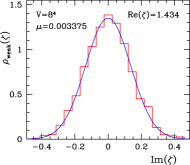
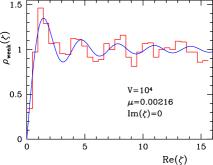
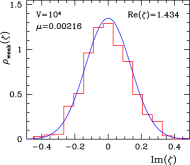
Let us first discuss the data at weak nonhermiticity. In Eq. (2) the average level spacing between consecutive eigenvalues is . In order to compare with lattice data, we first determine the mean level spacing from the data averaged over many configurations and then rescale the lattice eigenvalues by . At the same time the spacing provides us with the weak nonhermiticity parameter to be used in Eq. (2). After normalizing the histograms to unity we thus obtain the parameter-free comparison shown in Fig. 1. The three different values of are such that the product is constant. All data are well described by the same value222 The values of obtained from the and data agree within errors. of determined from the volume . Apart from the scaling we have thus also confirmed the scaling of the complex Dirac eigenvalues with the volume.
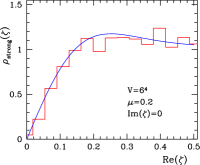

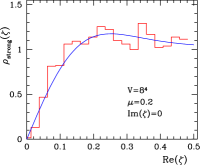
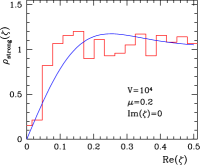
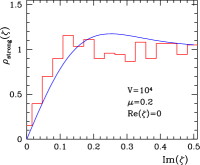
At strong nonhermiticity we have chosen for all lattice volumes. In this case, the eigenvalues are rescaled with the square root of the volume, , where the level spacing is now obtained by averaging over the smallest geometric distance between complex eigenvalues. The normalized data confirm the prediction of Eq. (2) together with the different scaling.
In conclusion, we have confirmed the analytical matrix model predictions in two different scaling regimes from quenched QCD lattice data. For the small values of at weak nonhermiticity, unquenched simulations should be feasible as well, keeping fixed. On the other hand, the lattice simulations [1] close to the phase transition are at strong nonhermiticity, since is kept constant. So far, our analytical predictions are restricted to the broken phase and, unfortunately, are not suitable to describe the transition region. It would be very interesting to compute predictions for the unbroken phase as well.
References
- [1] Z. Fodor and S.D. Katz, Phys. Lett. B 534 (2002) 87; C.R. Allton et al., Phys. Rev. D 66 (2002) 074507; P. de Forcrand and O. Philipsen, Nucl. Phys. B 642 (2002) 290; M. D’Elia and M.-P. Lombardo, Phys. Rev. D67 (2003) 014505
- [2] G. Akemann, Phys. Rev. Lett. 89 (2002) 072002, J. Phys. A 36 (2003) 3363
- [3] G. Akemann and T. Wettig, hep-th/0308003
- [4] M.A. Stephanov, Phys. Rev. Lett. 76 (1996) 4472
- [5] J. Ambjørn, K.N. Anagnostopoulos, J. Nishimura, and J.J.M. Verbaarschot, JHEP 0210 (2002) 062
- [6] M.E. Berbenni-Bitsch, S. Meyer, and T. Wettig, Phys. Rev. D 58 (1998) 071502; G. Akemann and E. Kanzieper, Phys. Rev. Lett. 85 (2000) 1174
- [7] J.J.M. Verbaarschot and T. Wettig, Ann. Rev. Nucl. Part. Sci. 50 (2000) 343
- [8] G. Akemann, hep-th/0307116
- [9] Y.V. Fyodorov, B.A. Khoruzhenko, and H.-J. Sommers, Phys. Lett. A 226 (1997) 46, Phys. Rev. Lett. 79 (1997) 557
- [10] E.V. Shuryak and J.J.M. Verbaarschot, Nucl. Phys. A 560 (1993) 306; J.J.M. Verbaarschot, Phys. Rev. Lett. 72 (1994) 2531