Hadronic Spectral Functions above the QCD Phase Transition ††thanks: Presented by M. Asakawa
Abstract
We extract the spectral functions in the scalar, pseudo-scalar, vector, and axial-vector channels above the deconfinement phase transition temperature () using the maximum entropy method (MEM). We use anisotropic lattices, , 40, 54, 72, 80, and 96 (corresponding to ), with the renormalized anisotropy to have enough temporal data points to carry out the MEM analysis. Our result suggests that the spectral functions continue to possess non-trivial structures even above and in addition that there is a qualitative change in the state of the deconfined matter between and .
1 INTRODUCTION
The spectral functions (SPFs) of hadronic operators play an important role in QCD. The modification of hadrons, which has been suggested, for example, by the dilepton production enhancement in high energy nuclear collisions observed at CERN SPS, can be formulated in terms of SPFs. Although there have been numerous theoretical attempts to understand the modification of SPFs at finite temperature and/or density [1], the exact nature of the hadronic modes in matter is not understood well.
Recently, the maximum entropy method (MEM) has been used to extract SPFs from lattice QCD data for the first time by the present authors [2, 3]. The Euclidean 2-point functions in the temporal direction and the associated SPFs are related by the Laplace transform. On the lattice, only a finite number of data points with statistical noise are available in the temporal direction. Therefore, direct Laplace inversion from lattice data to SPF is an ill-posed problem. MEM is a method to evade such difficulty on the basis of the Bayes’ theorem in the theory of statistical inference [3].
2 HOW MANY DATA POINTS ARE NECESSARY FOR MEM ?
As we have discussed in detail in [3], the result of MEM depends strongly on the number of temporal data points. The more data points are used, the closer the MEM result is to the true SPF. Moreover, there is the minimum number of data points to perform the reliable MEM analysis.
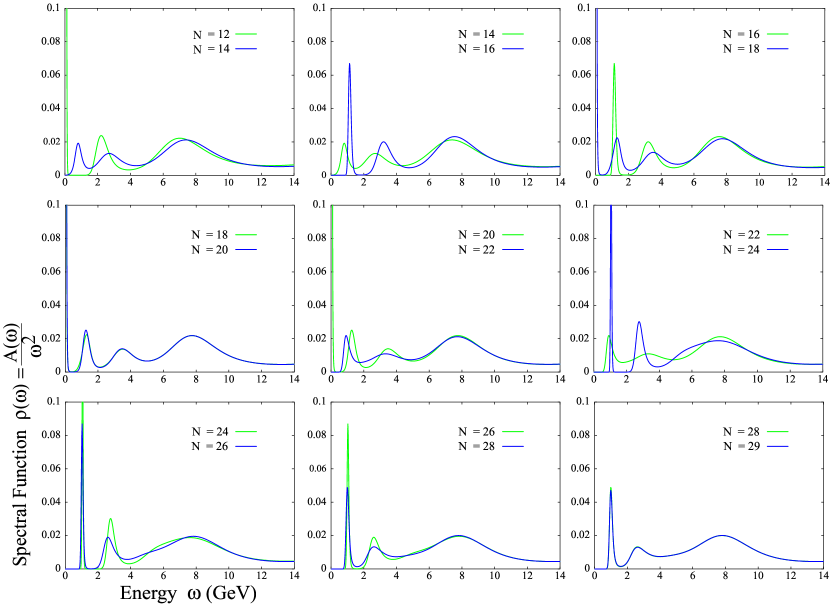
In order to find this minimum at on the lattice, we have carried out the following analysis [4]. First we calculated hadronic correlators with the quenched approximation on an isotropic lattice at [4, 5]. The number of gauge configurations is 160. Then, MEM analysis has been done for the vector channel by using data points (at and ) out of the total 30 data points. The result is shown in Fig. 1. The figure clearly shows that, SPF changes considerably as and that at least about 30 data points are necessary for the convergence of the result. This minimum would depend on , and on whether one employs anisotropic lattices, improved actions, and so on. Nevertheless, we use this number as a practical guide in the following.
3 ANISOTROPIC LATTICE AT
At finite temperature (), because of the relation ( and being the temporal lattice size and spacing, respectively), less and less data points are available as increases if is fixed. Requiring that holds even at the highest , e.g. , we are inevitably led to use an anisotropic lattice.
We have used the bare anisotropy and with the naive plaquette action. For the quark part, the standard Wilson action with the quenched approximation is used. The corresponding renormalized anisotropy is [6] and the lattice spacing is fm. Simulations are done on lattices with 40, 54, 72, 80, and 96. This corresponds to , , , , , and , respectively. More than 100 configurations are generated for each . The details of the lattice parameters used in the calculation will be given in [4].
We have studied 2-point correlation functions in the scalar (S), pseudo-scalar (PS), vector (V), and axial-vector (AV) channels. The default models, motivated by perturbative QCD, in each channel are , 1.15, 0.40, and 0.35, respectively.
The lattice data points used in our MEM analysis are and for , 72, 80, and 96. For and 40, are used. When the source and sink are closer than in the temporal direction, artifact could arise due to unphysical modes at . Therefore, we leave out the data points near the edges, i.e., and .
The number of lattice data points used in the MEM analysis is fixed almost the same at each except at to keep the resolution in the MEM analysis unchanged. The rest of the MEM procedures such as the averaging over are basically the same as described in [3] and will be presented in detail in [4].
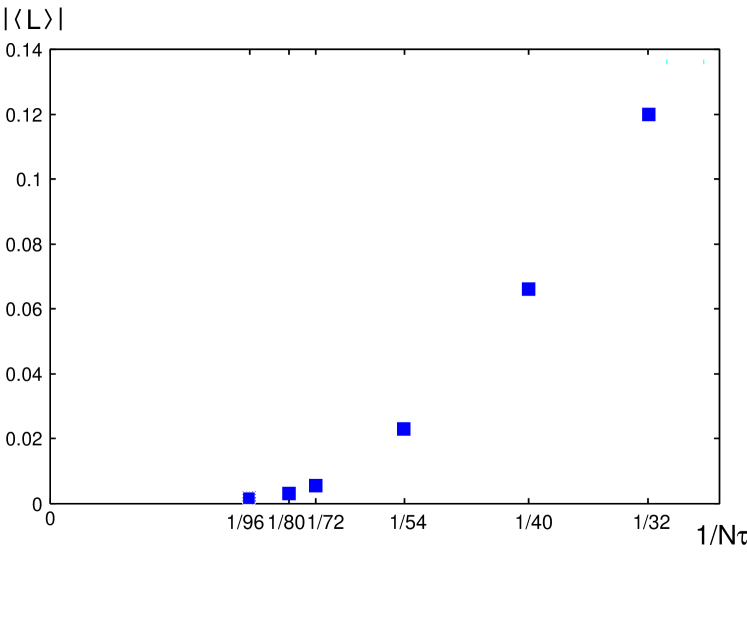
Fig. 2 shows the Polyakov loop expectation value at each . It starts to deviate from zero around , which corresponds to MeV, and is comparable to the real value 271 2 MeV. We have checked that the Polyakov loop susceptibility also shows a peak in this region. In the following, we use the number MeV.
4 RESULTS OF MEM
In Fig. 3, we show the results of the MEM analysis for SPF in the S, PS, V, and AV channels on lattice (). In this calculation, we have used the hopping parameter corresponding to at .
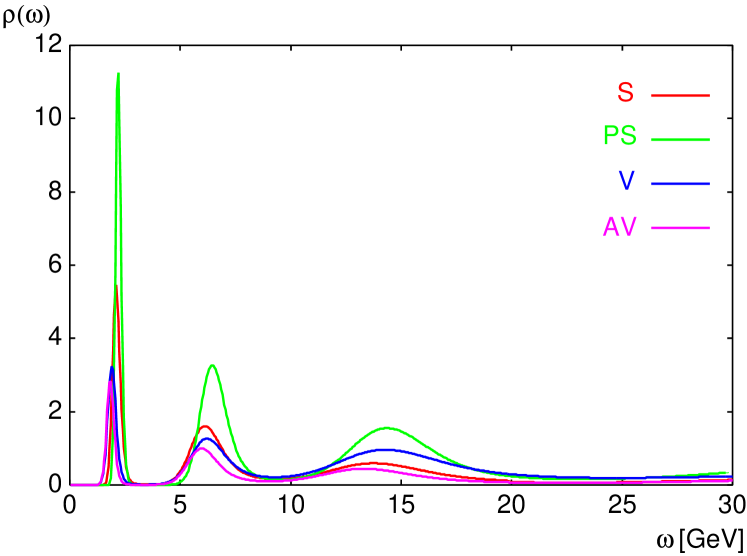
If the quark-gluon plasma is such an object as described as a free gas of massive quarks, anti-quarks and gluons, would show a flat behavior with a smooth rise from zero above the threshold as a function of . To the contrary, Fig. 3 shows that SPFs possess nontrivial structures even above in all four channels. There are a sharp peak at about GeV and two bumps above the peak. Also SPFs in all channels almost degenerate, which shows a strong signature of the restoration of chiral symmetry. The peak and bump structures, and the suppression of SPFs below GeV are statistically significant according to our error analysis. We have used twice as large as that employed in [7]. As shown in Sec.2, this is necessary for reliable MEM analysis.
In Fig. 4, we show the results at , i.e., . There is an apparent peak around . A possible explanation of the peak is the effect of Landau damping [8]. However, this peak is, at the moment, not statistically significant yet. The peaks around GeV are significantly broader than those around 2 GeV at .
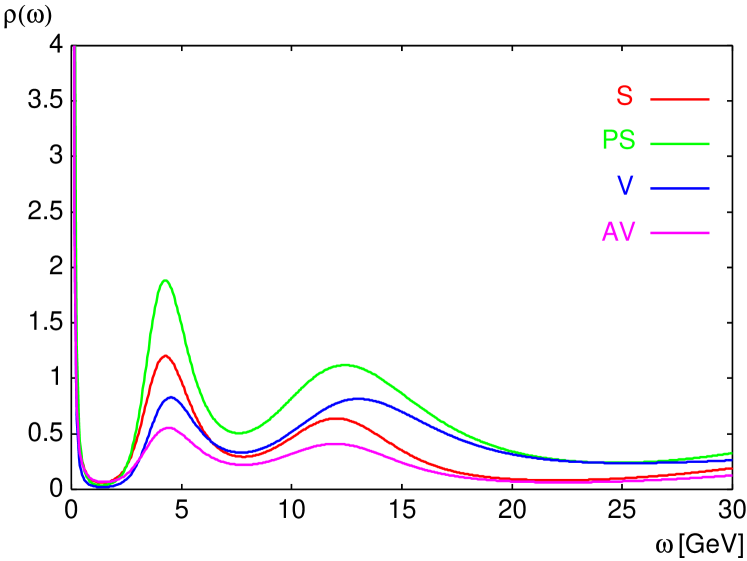
We have carried out an error analysis for the average of the SPFs in small regions around the peaks and found that the broadening is indeed statistically significant. SPFs in the case of have similar structures as those at except the shift of the peak positions. This suggests a possibility of a qualitative change in the state of the deconfined phase between and .
Acknowledgement This work was supported in part by the Grants-in-Aid by Ministry of Education (No. 12640263, No. 12640296, and No. 14540255). Lattice calculations have been carried out with the CP-PACS computer under the “Large-scale Numerical Simulation Program” of Center for Computational Physics, University of Tsukuba.
References
- [1] For example, S. H. Lee and T. Hatsuda, Phys. Rev. C46 (1992) R34; M. Asakawa et al., Phys. Rev. C46 (1992) R1159; R. Rapp and J. Wambach, Adv. Nucl. Phys. 25 (2000) 1.
- [2] Y. Nakahara, M. Asakawa, and T. Hatsuda, Phys. Rev. D 60 (1999) 091503.
- [3] M. Asakawa, T. Hatsuda, and Y. Nakahara, Prog. Part. Nucl. Phys. 46 (2001) 459.
- [4] M. Asakawa, T. Hatsuda, and Y. Nakahara, in preparation.
- [5] S. Aoki et al., Phys. Rev. Lett. 84 (2000) 238.
- [6] J. Engels, F. Karsch, and T. Scheideler, Nucl. Phys. B564 (2000) 303.
- [7] F. Karsch et al., Phys. Lett. B530 (2002) 147.
- [8] T. Hatsuda, Y. Koike, and S. H. Lee, Nucl. Phys. B394 (1993) 221.