Spectral density analysis of time correlation functions in lattice QCD using the maximum entropy method
Abstract
We study various aspects of extracting spectral information from time correlation functions of lattice QCD by means of Bayesian inference with an entropic prior, the maximum entropy method (MEM). Correlator functions of a heavy-light meson-meson system serve as a repository for lattice data with diverse statistical quality. Attention is given to spectral mass density functions, inferred from the data, and their dependence on the parameters of the MEM. We propose to employ simulated annealing, or cooling, to solve the Bayesian inference problem, and discuss practical issues of the approach.
pacs:
12.38.Gc, 02.50.Tt, 02.60.EdI Introduction
Numerical simulations of quantum chromodynamics (QCD) on a Euclidean space-time lattice provides access to mass spectra of hadronic systems through the analysis of time correlation functions. In theory the latter are linear combinations of exponential functions
| (1) |
where the are the excitation energies of the system and the strength coefficients
| (2) |
are matrix elements of some vacuum-subtracted operator between the vacuum and a ground or excited state . In practice the exponential model (1) is fitted to noisy numerical simulation ‘data’. The statistical quality of simulation data rarely is good enough for the two-exponential fit (1) to succeed. It is common practice to look at the large- behavior of the correlation function in a -interval where it is dominated by only one exponential, with the lowest energy, and then make a one-parameter fit to a plateau of the effective-mass function . Possible discretizations are
| (3a) | |||||
| (3b) | |||||
| (3d) | |||||
The expressions after the are the values of for a pure plateau of mass . The procedure implies the selection of consecutive time slices for which , within errors, and an appropriate fit. The selection of this, so-called, plateau is a matter of judgment. A condition for reliable results is that the correlation function (1) is dominated by just one exponential term, usually the ground state. The latter can be enhanced by the use of smeared operators Alexandrou et al. (1994) and fuzzy link variables Albanese et al. (1987). This analysis procedure discourages consideration of excited states. In fact it will only produce reliably results if those are suppressed. Workarounds involve diagonalization of a correlation matrix of several operators or variational techniques Morningstar and Peardon (1999). Those however, still rely on plateau selection without utilizing the information contained in the entire available time-slice range of a correlation function.
As lattice simulations of QCD now aim at excited hadron states, ’s for example Lee and Leinweber (1999); Göckeler et al. (2001); Sasaki et al. (2002), this situation is unsatisfactory. Alternative methods employing Bayesian inference Jarrell and Gubernatis (1996) are a viable option. The maximum entropy method (MEM), which involves a particular choice of the Bayesian prior probability, falls in this class. Bayesian statistics Box and Tiao (1973) is a classic subject with a vast range of applications. However, application within the context of lattice QCD is relatively new Nakahara et al. (1999, 2000); Asakawa et al. (2000, 2001); Lepage et al. (2002).
In this work we report on our experience using the MEM for extracting spectral mass density functions from lattice-generated time correlators
| (4) |
where a discrete set of time slices is understood. Discretization of the -integral with reasonably fine resolution leads to an ambiguous problem where the number of parameters values is (typically much) larger than the number of lattice data . In the MEM an entropy term involving the spectral density is used as a Bayesian prior to infer from the data.
We here apply MEM analysis to sets of lattice correlation functions of a meson-meson system. Those particular simulations are aimed at learning about mechanisms of hadronic interaction. This will be discussed separately Cook and Fiebig . The lattice data generated within that project involve local and nonlocal operators. They exhibit a wide range of statistical quality from ‘very good’ to ‘marginally acceptable’.
Our focus here is to utilize those data as a testing ground for Bayesian MEM analysis. In contrast to other works we employ simulated annealing to the solution of the Bayesian inference problem. The main aim of this work is to explore the feasibility of this approach for extracting masses from a lattice simulation using realistic lattice data, including excitations. For the most part this translates into studying the sensitivity of the method to to its native parameters.
II Bayesian Inference for Curve Fitting
From a Bayesian point of view the spectral density function in (4) is a random variable subject to a certain probability distribution functional . Solution of the curve fitting problem consists in finding the function which maximizes the conditional probability , the posterior probability, given a ‘measured’ data set . Computation of is then based on Bayes’ theorem Jarrell and Gubernatis (1996)
| (5) |
also known as ‘detailed balance’ in a different context. The functional , the evidence, gives the probability of measuring a data set . The conditional probability , the likelihood function, determines the probability of measuring given a spectral function . Finally , the Bayesian prior, defines a constraint on the spectral density function . Its choice is a matter of judgment. Ideally, the prior should reflect the physics known about the system, for example an upper limit on the hadronic mass scale. The posterior probability is the product of the likelihood function and the prior , where the evidence merely plays the role of a normalization constant Jarrell and Gubernatis (1996). Indeed, the normalization condition applied to (5) gives . Thus, for a fixed , we have
| (6) |
The curve fitting problem requires the product of the likelihood function and the prior function.
II.1 Spectral density
Our lattice data come from correlation functions built from heavy-light meson-meson operators
| (7) |
where and involve local and non-local meson-meson fields, respectively, at relative distance , and are some coefficients Fiebig (2002a, b). On a finite lattice the corresponding correlator , where , has a purely discrete spectrum
| (8) |
Here denotes a complete set of states with energies , some of which may be negative due to periodic lattice boundary conditions and operator structure. Our normalization conventions for forward and backward going propagators are determined by defining
| (9) |
where , and denotes the step function. We then expect the lattice data to fit the following model
| (10) |
where is a spectral density function, defined for positive (forward) and negative (backward) frequencies. The requirement that the model be exact, , leads to
| (11) | |||||
Thus a discrete sum over -peaks is the theoretical form of the spectral function. Our objective is to compute from lattice data using Bayesian inference.
II.2 Likelihood function
Toward this end we proceed to construct the likelihood function. The lattice data come in the form of an average over gauge configurations
| (12) |
where is the value of an operator, in this case , in one gauge field configuration . Correlation function data on different time slices are stochastically dependent. Their errors are described by the covariance matrix
| (13) | |||||
The -distance of the spectral model (10) from the lattice data then is
| (14) | |||||
For numerical work a discretization scheme of the -integral in (10) is required. Our choice is
| (15) |
where , is an appropriate (small) interval, , and .
The likelihood function describes the probability distribution of the data given a certain parameter set . If we imagine that the data are obtained by a large number of measurements, at fixed , then the probability distribution for is Gaussian by virtue of the central limit theorem,
| (16) |
This is the standard argument for employing the above form of the likelihood function in the context of Bayesian inference Jarrell and Gubernatis (1996); Brandt (1976).
II.3 Entropic prior
In case some information is available about the physics of the system it can be used to constrain the parameter space of the model. This is the role of the Bayesian prior. In the standard approach plateau methods are a severe form of imposing restrictions. A two-exponential fit (1), if feasible, is less constraining. In a Bayesian context it is possible to gradually increase the number of exponentials until convergence is reached. This is a strategy advocated in Lepage et al. (2002), see also Morningstar (2001). There, the model for the correlation function is , initially with small number of terms, which is then constrained by the Bayesian prior . The quantities are input. Their choice is inspired by prior knowledge about the physics of the system.
On the other hand, there is usually no a priory information about the location and the strengths of the peaks in the mass spectrum. The view that only minimal information is available about the spectral density function can also be implemented in the Bayesian prior. The information content, in the sense of Shannon and Weaver (1949); Jaynes (1957a, b), is measured by the entropy , on some scale . Rather, a commonly used variant is the Shannon-Jaynes entropy Jarrell and Gubernatis (1996)
| (17) |
Note that , according to (11). The configuration is called the default model. We have , , while . The default model is a unique absolute maximum of . Choosing the prior probability as
| (18) |
entails that is maximal in the absence of information about . An argument for (18) can be found in Jarrell and Gubernatis (1996). The entropy strength and the default model are parameters.
II.4 Computing the spectral density
With (16) and (18) the posterior probability (6) becomes
| (19) |
We wish to maximize with respect to , at fixed . It can be shown that both and are convex functions of . Thus
| (20) |
has a unique absolute minimum. The functional is nonlinear and maximally nonlocal since all degrees of freedom are coupled via the covariance matrix (13) in (14). To find the minimum of one option is to use singular value decomposition (SVD), see Asakawa et al. (2001).
In keeping with the Bayesian probabilistic interpretation of an attractive alternative is to employ stochastic methods to solve the optimization problem . In this work we employ simulated annealing Kirkpatrick (1984), equivalently known as cooling. The algorithm is based on the partition function
| (21) |
It involves the generation of equilibrium configurations while gradually increasing from an initially small value, following some annealing schedule. The latter is subject to experimentation. We have used the power law
| (22) |
with annealing steps between an initial and a final .
A standard Metropolis algorithm was used to generate configurations with the distribution in (21). In consecutive sweeps local updates were done by multiplying the spectral parameters with positive random numbers, . Some experimenting showed that -distributed random deviates of order two, , work quite efficiently at an acceptance rate centered at about 50%.
III Results
All simulations were done on an lattice. The gauge field and fermion actions are both anisotropic, with bare aspect ratio of , and tadpole improved. The gauge field action is that of Morningstar and Peardon (1999) with , leading to a spatial lattice constant of . For the light fermions we use a clover improved Wilson action. The hopping parameter results in a mass ratio . Following Morningstar and Peardon (1999) only spatial directions are improved with spatial tadpole renormalization factors , while in the time direction. Clover terms involving time directions are omitted.
Some guidance for a reasonable -discretization (15), of (10), may be derived from the physical value of the lattice constant , and the time extent of the lattice. Admissible lattice energies thus lie approximately between and , or and in units of . In practice these are somewhat extreme bounds. Typical hadronic excitation energies are much less than . The lower bound, on the other hand, may well be ignored as a criterion for choosing the discretization interval , because the theoretical form of is a superposition of -peaks. Thus the resolution should be small, in fact much smaller than . A reasonable lower bound is the likely statistical error on spectral masses. For most of the results presented here , and , leading to , were used with (15).
With the annealing schedule (22), we have used cooling steps, at 128 sweeps per temperature, starting at and ending at , with a geometric average of . These choices are an outcome of experimentation. With in (22) about half of the cooling steps operate in the regions and , respectively. The average value is such that fluctuates about one at around cooling steps. With the final annealing temperature kept constant, , an additional 1024 steps were done keeping 16 configurations in order to measure cooling fluctuations.
Results are robust within reasonable changes of the annealing schedule parameters, they were used throughout this work.
III.1 Entropy weight dependence
The extent to which the spectral density depends on the value of the entropy weight parameter , in (20), is a primary concern. We are interested in testing the dependence for a case where both ground and excited states are prominently present in a time correlation function. For this reason we have constructed a mock correlator . Its building blocks were the eigenvalues of the correlation matrix using the above mentioned local and non-local meson fields. Pieces of those were arbitrarily matched and enhanced in order to exhibit a multi-exponential correlation function. While bears no physical significance, its rich structure provides a useful laboratory for testing the dependence of the spectral density function.
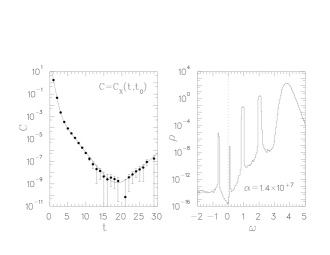
In Fig. 1 we show a sequence of six pairs of Bayesian fits to the mock correlator and the corresponding spectral densities for a wide range of entropy weights . The stability of the global structure of while changes from to is most notable111In Fiebig (2002b) and Fiebig (2002a) a different normalization of the covariance matrix (13) was used. This can be accounted for by a rescaling of the entropy weight , where refers to the above references and .. As becomes larger entire peaks vanish starting with the smallest one. The reason is that the annealing action (20) gradually loses memory of the data, contained in , in favor of the entropy. The fit at exhibits the onset of a smoothing of the micro structure, starting with the largest peak. This is the signature of emerging entropy dominance over the data. In practice this situation should be avoided. In our case entropy strengths in the region over eight orders of magnitude give stable consistent results. It has been proposed that spectral functions be integrated over to avoid the parameter dependence Jarrell and Gubernatis (1996). Inspection of our results clearly indicates that averaging over would be without consequence to the gross structure of , only the micro structure would be affected. Even the region could be included, since the magnitude of quickly becomes insignificant.


In order to decide on a tuning criterion for it is useful to monitor quantities like
| (23) | |||||
| (24) |
where refers to the annealing average measured at the final cooling temperature, . We will refer to the above quantities as entropy loads. Those are shown in Fig. 2. It turns out that depends linearly on in the regions and , for and , respectively. (In fact .) Beyond the linear region too much entropy is loaded into the annealing action , leading to a smoothing of peaks, as seen in Fig. 1. Empirically, the criterion emerging from this observation is to tune the entropy weight such that within the linear region. The precise value of is not important, also and work equally well. As is evident from Fig. 1 results are extremely robust against varying .


III.2 Single-meson spectrum
The correlation function of a single pseudoscalar heavy-light meson operator delivers high quality data in this simulation. We use these to compare with plateau methods and make some observations relevant to the present stochastic approach to the MEM.
In Fig. 3 plots of the mass function discretizations (3a–3d), built from , and the corresponding plateau fits are displayed. Plateau fits were made directly to . The resulting masses, other than , are from solving (3b–3d). Table 1 shows that those are consistent within statistical (jackknife) errors.

| 0.468(8) | 0.468(7) | 0.468(3) | 0.47(2) | 0.471(15) | 0.017(6) |
Figure 4 gives a sense of the annealing dynamics. Beside (23) and (24) also shown are
| (25) | |||||
| (26) |
In Fiebig (2002b) and Fiebig (2002a) the use of was advocated as a tuning criterion. In view of Fig. 4 appears to be a better choice given its monotonic nature. A target entropy load of is a safe tuning criterion, provided the cooling algorithm runs in the (upper) linear region, see Fig. 2.

The Bayesian analysis of the time correlation function is shown in Fig. 5. The solid line in Fig. 5(a) derives from the computed spectral density , via (15). With the exception of all available time slices were used. Parameters are , for the entropy strength, a constant default model , and a random annealing start about . The graph of in Fig. 5(b) exhibits a global structure consisting of distinct peaks, some broad, and a micro structure of fluctuations on the scale of . The micro structure depends on details of the annealing process, particularly the start configuration. Clearly, it makes no sense to infer the micro structure from the data. The reason is that only data points do not contain enough information to determine spectral parameters (with any sizable probability).


On the other hand the global structure is a stable feature. In the region three peaks can be distinguished in Fig. 5(b). By way of inspection we loosely define
| (27) |
Then, for each peak , we may calculate the volume , the mass , and the width , according to
| (28) | |||||
| (29) | |||||
| (30) |
These integrated, low moment, quantities are evidently insensitive to the micro structure. They constitute the information that reasonably can be expected to flow from the Bayesian analysis.
The spectral density of Fig. 5(b) is replotted in Fig. 6 on linear scales. The tall narrow peak in Fig. 6(c) corresponds to the plateau masses of Fig. 3, as listed in Tab. 1. There, the entries and are the Bayesian results. Their statistical errors are derived from a jackknife analysis selecting four subsets of gauge configurations. (Note that the uncertainties in Fig. 6 are standard deviations from eight annealing starts.) Cold starts from the default model were used to suppress the dependence on the annealing start configuration. The peak width is comparable to the gauge configuration statistical error. This is the exception. With correlation function data of lesser quality (like with the two-meson operators below) the size of the peak width is typically larger than the statistical error. It appears that the peak width is related to the size of the corresponding effective mass function plateau, like in Fig. 3, or the size of the -linear stretch in a plot like in Fig. 5(a). As a very coarse description comes to mind. Using and we have . The peaks and seen in Fig. 6(d) would thus appear to originate from , or 1.3 and 0.8 time slices, respectively. (By inspection of Fig. 3 as many as 5 time slices appear involved, however.) The physical relevance of, at least, peak is therefore questionable. On the other hand it is remarkable that the maximum entropy method is sensitive to the slightest details in the correlation function data.


III.3 Default model dependence
The Shannon-Jaynes entropy (17) implies the possible dependence of the computed spectral density on the default model . We explore the dependence using as an example the time correlation function with , in the notation of (7), at relative distance .
Figure 7 shows the time correlation function data together with the Bayesian fit, and the corresponding spectral density . The latter is the average over eight random annealing start configurations. This has the effect of smoothing out the micro structure of . We have used a constant default model , all .


The stability of this result is tested by varying the default model through 15 orders of magnitude, , as shown in Fig. 8. To keep effects of the annealing start configuration small cold starts from , using the same random seed, were employed for all values of . In each case the entropy strength parameter was tuned such that the entropy load remained constant. Aside from the familiar micro structure fluctuations, the global (physical) features are stable within the range of, a remarkable, fifteen orders of magnitude. Numerical experiments with non-constant do not change this assessment. In Tab. 2 are listed the three integral quantities (28)–(30) averaged over the six default models together with the corresponding standard deviations. Their smallness (0.3–3%) attests to the default model independence of the Bayesian fits. Given the huge variation of the default model the stability of is remarkable.


| 3923.(18.) | 0.972(3) | 0.100(3) | 0.94(1) |
III.4 Annealing start dependence
The annealing algorithm starts with some initial spectral configuration . Depending on the purpose we have used cold starts from the default model, , or random starts from the default model, , where the are drawn from a gamma distribution of order two, . The global features of the final spectral density are of course independent of the start configuration, but the micro structure of is not. The reason is that in practice the annealing process is neither infinitely slow nor is the final cooling temperature exactly zero. Therefore the annealing result for settles close to the global minimum, say , of . Considering annealing (thermal) fluctuations only, we expect the deviation to be large in directions (of space) where the minimum is shallow. Thermal fluctuations are easily controlled, however. Those were kept negligible in the present study. More importantly, there may be local minima close to which are only slightly larger than . This situation invites computing a set of spectral densities from different, say random, initial configurations. The averages and standard deviations of the then gives some insight into the structure of the peak and the nature of the minimum of and its neighborhood.
To present an example we have selected an excited state time correlation function of the meson-meson system at relative distance . is the smaller of the eigenvalues of the correlation matrix , on each time slice. The reason for selecting this operator is to see how the MEM responds to a data set that is marginally acceptable, at best. Figure 9 shows the correlator and the corresponding spectral density obtained from an average over eight Bayesian fits based on different random annealing start configurations. The same spectral density is displayed in the first frame of Fig. 10 on a linear scale. The dotted lines represent the limits within one standard deviation. The remaining three frames of Fig. 10 show spectral functions from selected single start configurations. They illustrate the micro structure fluctuations.


We argue that the micro structure, on a fine discretization scale , is extraneous information. On the basis that the number of measured data points, as supplied by the time correlation function , is much smaller than the number of inferred parameters , exact knowledge of would actually constitute an information gain not supported by the data. Rather, only averages of suitable observables based on the inferred spectral density, like (28)–(30) for example, are relevant information that can be extracted from the Bayesian analysis. Whether or not the average of a certain observable is relevant information supported by the data may possibly be decided by the criterion that the standard deviation with respect to different annealing starts be small. From Tab. 3 we see that the standard deviations for the small-moment averages (28,29,30) are comparable to typical gauge configuration statistical errors, for example those in Tab. 1. This should be an acceptable test, certainly high resolution operators would fail it.
| 2156.(11.) | 2.012(7) | 0.214(11) | 1.92(3) |
III.5 Relation to plateau methods
Aside from the obvious differences in algorithm and philosophy it is important to understand that the traditional plateau method and the celebrated Bayesian approach also are distinctly different in the way they utilize the lattice correlator data. First, the former uses data on only a (subjectively) truncated contiguous set of time slices while completely ignoring the rest, whereas the latter utilizes the data on all available time slices without bias. Second, in the plateau method the stochastic dependence of the data between the plateau time slices is often ignored222 Uncorrelated fits to a mass function may be justified if the number of gauge configurations is large compared to the number of plateau times slices , see Michael (1994); Michael and McKerrell (1995). There the condition applied to the situation of Fig. 3 gives . whereas in the Bayesian approach the dependence is fully accounted for through the covariance matrix (13). Hence, the traditional plateau method and the Bayesian inference approach cannot be compared on an equal footing. In particular, their systematic errors are in principle different.
A comparison of those methods is thus reduced to observing their responses to the same data sets. If the numerical quality of data is very good both methods (in fact any two methods) will of course give the same answers. An example is the single-meson case discussed above, see Tab. 1. In case of imperfect numerical data, however, the two methods should be expected to give different results. We illustrate this point by showing in Fig. 11 the effective mass functions (3a) of the correlators and displayed in Figs. 7 and 9, respectively. While the data are somewhat level within 9 time slices, the data are extreme in the sense that only 2 data points are available to the plateau method. Bayesian inference, as illustrated by Fig. 9 and also Fig. 10, has no problem responding with a distinct peak. The reason, of course, is that the entire set of correlator data including their correlations is available to the Bayesian approach.


In Tabs. 2 and 3 we compare the plateau masses obtained from (3a) to the Bayesian results . The numbers differ by about 3–5%. Note that the statistical (jackknife) errors on the plateau masses are much smaller. Because of the data truncation the method has no way of ‘knowing’ about the poor quality of the correlator data, particularly in the case of the exited state correlator. The Bayesian method, on the other hand, is fully ‘aware’ of this fact and conveys this information by responding with a sizable peak width , which easily encompasses the plateau masses.
This raises the question whether Bayesian peak widths or plateau mass statistical errors are a better measure for the uncertainty of masses extracted from lattice simulations. The answer is beyond the scope of this work.
IV Summary and conclusion
We have reported on our experience using Bayesian inference with an entropic prior, the maximum entropy method, to extract spectral information from lattice generated time correlation functions. The latter were taken from a simulation aimed at studying hadronic interaction, but used here only as a repository of simulation data of diverse quality.
In contrast to other works the method of choice for extracting spectral densities was simulated annealing.
Between the maximum entropy method and simulated annealing there were three major concerns about the parameter and algorithm dependence of the results: Dependence on (i) the entropy weight, (ii) the default model, and (iii) the annealing start configuration. Besides suggesting strategies for parameter tuning, independence of the Bayesian inferred spectral density on (i) the entropy weight, and (ii) the default model could be demonstrated within a range of eight and fifteen orders of magnitude of the parameters, respectively. Concerning the annealing start configuration dependence (iii) we argued that only spectral density averages of certain operators are acceptable. From an information theory point of view Shannon and Weaver (1949), those should be operators insensitive to the micro structure of the inferred spectral density. In particular, keeping in mind that the theoretical structure of the lattice spectral function is a superposition of distinct peaks, those operators include the spectral peak volume , or normalization, the peak energy , or mass, and the peak width , or standard deviation.
Bayesian inference has too long been ignored by the lattice community as an analysis tool. It has an advantage over conventional plateau methods for extracting hadron masses from lattice simulations because the entire information contained in the correlator function, or matrix, is utilized. This aspect is particularly important where excited state masses are desired, since the noise contamination of their signal can be significant. The maximum entropy method is very robust with respect to changing its parameters. Simulated annealing is practical for obtaining spectral density functions. The method should be given serious consideration as an alternative for conventional ways.
Acknowledgements.
This material is based upon work supported by the National Science Foundation under Grant No. 0073362. Resources made available through the Lattice Hadron Physics Collaboration (LHPC) were used in this project.References
- Alexandrou et al. (1994) C. Alexandrou, S. Güsken, F. Jegerlehner, K. Schilling, and R. Sommer, Nucl. Phys. B414, 815 (1994), eprint [http://arXiv.org/abs]hep-lat/9211042.
- Albanese et al. (1987) C. Albanese et al., Phys. Lett. B192, 163 (1987).
- Morningstar and Peardon (1999) C. J. Morningstar and M. J. Peardon, Phys. Rev. D60, 034509 (1999), eprint [http://arXiv.org/abs]hep-lat/9901004.
- Lee and Leinweber (1999) F. X. Lee and D. B. Leinweber, Nucl. Phys. Proc. Suppl. 73, 258 (1999), eprint [http://arXiv.org/abs]hep-lat/9809095.
- Göckeler et al. (2001) M. Göckeler et al. (QCDSF) (2001), eprint [http://arXiv.org/abs]hep-lat/0106022.
- Sasaki et al. (2002) S. Sasaki, T. Blum, and S. Ohta, Phys. Rev. D65, 074503 (2002), eprint [http://arXiv.org/abs]hep-lat/0102010.
- Jarrell and Gubernatis (1996) M. Jarrell and J. E. Gubernatis, Phys. Rep. 269, 133 (1996).
- Box and Tiao (1973) G. Box and G. Tiao, Bayesian inference in statistical analysis (Addison-Wesley, Reading, 1973).
- Nakahara et al. (1999) Y. Nakahara, M. Asakawa, and T. Hatsuda, Phys. Rev. D60, 091503 (1999), eprint [http://arXiv.org/abs]hep-lat/9905034.
- Nakahara et al. (2000) Y. Nakahara, M. Asakawa, and T. Hatsuda, Nucl. Phys. Proc. Suppl. 83, 191 (2000), eprint [http://arXiv.org/abs]hep-lat/9909137.
- Asakawa et al. (2000) M. Asakawa, Y. Nakahara, and T. Hatsuda, Nucl. Phys. Proc. Suppl. 86, 191 (2000).
- Asakawa et al. (2001) M. Asakawa, T. Hatsuda, and Y. Nakahara, Prog. Part. Nucl. Phys. 46, 459 (2001), eprint [http://arXiv.org/abs]hep-lat/0011040.
- Lepage et al. (2002) G. P. Lepage, B. Clark, C. T. H. Davies, K. Hornbostel, P. B. Mackenzie, C. Morningstar, and H. Trottier, Nucl. Phys. Proc. Suppl. 106, 12 (2002), eprint [http://arXiv.org/abs]hep-lat/0110175.
- (14) M. S. Cook and H. R. Fiebig, A lattice study of interaction mechanisms in a heavy-light meson-meson system, eprint [http://arXiv.org/abs]hep-lat/0210054.
- Fiebig (2002a) H. R. Fiebig (LHPC), Nucl. Phys. Proc. Suppl. 106, 344 (2002a), eprint [http://arXiv.org/abs]hep-lat/0110163.
- Fiebig (2002b) H. R. Fiebig (LHPC), Nucl. Phys. Proc. Suppl. 109, 207 (2002b), eprint [http://arXiv.org/abs]hep-lat/0112010.
- Brandt (1976) S. Brandt, Statistical and computational methods in data analysis (North-Holland, New York, 1976).
- Morningstar (2001) C. Morningstar (2001), eprint [http://arXiv.org/abs]hep-lat/0112023.
- Shannon and Weaver (1949) C. Shannon and W. Weaver, The Mathematical Theory of Communication (Univ. of Illinois Press, Urbana, 1949).
- Jaynes (1957a) E. Jaynes, Phys. Rev. 108, 171 (1957a).
- Jaynes (1957b) E. Jaynes, Phys. Rev. 106, 620 (1957b).
- Kirkpatrick (1984) S. Kirkpatrick, J. Stat. Phys. 34, 975 (1984).
- Michael (1994) C. Michael, Phys. Rev. D49, 2616 (1994), eprint [http://arXiv.org/abs]hep-lat/9310026.
- Michael and McKerrell (1995) C. Michael and A. McKerrell, Phys. Rev. D51, 3745 (1995), eprint [http://arXiv.org/abs]hep-lat/9412087.