On the low fermionic eigenmode dominance
in QCD on the lattice
Abstract
We demonstrate the utility of a spectral approximation to fermion
loop operators using low-lying eigenmodes of the hermitian
Dirac-Wilson matrix, . The investigation is based on
a total of 400 full QCD vacuum configurations, with two degenerate
flavors of dynamical Wilson fermions at , at two
different sea quark masses. The spectral approach is highly
competitive for accessing both topological charge and disconnected
diagrams, on large lattices and small quark masses. We propose
suitable partial summation techniques that provide sufficient
saturation for estimating , which is related to the
topological charge. In the effective mass plot of the meson
we achieved a consistent early plateau formation, by ground state
projecting the connected piece of its propagator.
PACS: 11.15.Ha, 12.38.Gc
I introduction
The Euclidean approach of lattice gauge theory (LGT) has been established as a viable framework to deal with quantum chromodynamics beyond the limitations of perturbation theory [1]. Whereas practical algorithms have been developed to calculate many physical observables, there is a class of physical quantities that is highly sensitive to fluctuations in the vacuum gauge field that has not been amenable to known ab initio numerical methods. Notorious examples of such computationally intractable problems include mixing phenomena between fermionic and glueball states [2], disconnected quark loop diagrams occurring in flavor singlet matrix elements [3, 4], and the infamous propagator [5, 6, 7].
In all these instances one would like to take advantage of self-averaging effects by exploiting the translational invariance of the QCD ground state. This amounts to probing with objects shifted across all lattice space-time points and hence to the computation of light quark propagators on the entire vacuum field, i.e. the full inverse of the Dirac operator, , which exhibits a high condition number in the regime of light quark masses. Unfortunately this is a prohibitively expensive numerical task, with being of rank on typical lattice sizes. Therefore the standard approach is to resort to stochastic estimator techniques [8, 9, 10, 11, 12, 13, 14].
The approach to these previously intractable problems explored in this work is motivated by the expectation that low-lying modes of the Dirac operator should embody the important features of fermionic physics in the chiral regime [15] ***Early pioneering work in this direction has been done by Barbour et al. [16, 17].. Physically, topological excitations in the QCD vacuum, corresponding to instantons in the semiclassical limit, generate low-lying fermion modes that play an essential rôle in light quark physics, ranging from generating the ’t Hooft interaction to producing the chiral condensate. Hence, for sufficiently light quark masses, expansion in a basis that contains these low-lying eigenmodes should cover the essential physics associated with observables involving the topological charge, flavor singlet disconnected diagrams, and processes described by the ’t Hooft interaction.
It therefore appears worthwhile to launch another attempt to explore the potential of spectral methods/approximations [18]. The question is, how many low-lying eigenmodes suffice to bear out the important features of long range physics in practical instances.
There are two options to proceed, based on the spectral representations of the non-normal Wilson-Dirac matrix and the hermitian matrix . The advantage of lies in its shiftable (with respect to ) structure , but it requires to work with biorthogonal sets of eigenmodes and complex eigenvalues. The hermiticity of , on the other hand, allows for a simple ordering of the orthogonal eigenmodes and a natural definition of low-lying eigenmodes.
We decided to work with and its eigenmodes [19, 20, 21]
| (1) |
We can express the quark propagator in terms of the ‘eigenmodes‘ from the spectral representation:
| (3) | |||||
where etc. label lattice sites, Dirac and color indices, respectively.
For our practical benchmarking we use 200 (195) SESAM lattices of size with () [22]. Thus the rank of is , which bars us from complete diagonalization of and the use of the identity as such, Eq. (3). Nevertheless, the low-lying eigenvalues, i.e. the ones with smallest moduli, represent a large weight and are expected to saturate the sum in the regime of small quark masses.
In the present paper we wish to investigate to what extent the spectral sum allows, under the conditions of the SESAM simulations, for a truncation of the propagator at a reasonable (in the sense of practicality) number of lowest-lying eigenmodes. As a testbed for our truncated eigenmode approach (TEA), we will use in addition to the pion and -correlators.


II computing low-lying eigenmodes


The hermitian operator is defined through
where is the standard Wilson-Dirac matrix
| (4) | |||
| (5) | |||
| (6) |
Here the are the Dirac matrices, is the gauge field (vacuum configuration), is the Kronecker delta function and denotes a unit vector in a space or time direction.
The eigenmodes are determined by use of the parallelized Arnoldi package†††We employ the Arnoldi method as provided by the parallel Arnoldi Package PARPACK [23] from Rice University. The Arnoldi method is designed for non-hermitian matrices, but it reduces, when applied to a hermitian matrix, to the Lanczos method. [23]. We speed up the computations by application of the polynomial acceleration technique [24].
The Arnoldi method works efficiently when calculating eigenvalues on the surface of the spectrum, here around and . For this reason we first need to execute a preparatory step where we map, by means of a suitable polynomial , the low-lying modes from the inside of the spectrum to the surface. We will contrive the polynomial such that the spectrum is already prepared for the subsequent Chebyshev acceleration step [25].
a First step: Mapping
We apply a very simple polynomial transformation . To be specific we proceed as follows:
-
-
Target a spectral window of within which all eigenmodes are to be determined and decompose the spectrum of accordingly into desired eigenmodes,
(7) and the remainder:
(8) -
-
Construct a polynomial that casts the spectral window outside the region :
(9) (10)
We found that the simple choice
| (11) |
will accomplish the task, since the smallest eigenmodes of , i.e. the
ones closest to , correspond to the
low-lying eigenmodes of . The polynomial carries two parameters:
(i) The scale factor is the spectral radius of . It can be computed
in a first Arnoldi run on just a few vacuum configurations, since it
fluctuates little with the gauge field .
(ii) The offset parameter
represents a simple shift operation and controls the actual size of the
window of desired eigenmodes.
b Second step: polynomial acceleration
The Arnoldi method is sensitive to the level density of eigenvalues,
. For acceleration it is therefore crucial to
precondition the problem by decreasing the level density in the
spectral region of interest. This can readily be achieved with
Chebyshev polynomials of degree due to their rapid increase
outside the interval [-1,1] (within which they are close to zero).
The practical procedure is then to find an appropriate Chebyshev polynomial and compute the eigenmodes of largest moduli of , with taken from Eq. (11).
We found the optimal convergence w.r.t. CPU time with a Chebyshev polynomial of order and chosen such that approximately only the searched for 300 lowest-lying eigenvalues were contained in the interval . With this parameter setting we needed just one Arnoldi factorization [26]. Since we chose the size of the factorization to be 600, the calculation of the eigenmodes takes matrix-vector multiplications (where the factor 2 is due to the fact that enters the Chebyshev polynomial).
We emphasize that without the Chebyshev acceleration step, we observed only very poor convergence.
Once we have the eigenfunctions, , of the operator , it is straightforward to retrieve the eigenvalues of the original operator . By appealing to the relation
| (12) |
we determine through the Rayleigh quotient
| (13) |


Let us comment that – for our present purposes – we found the above procedure to be much superior to the shift and invert strategy [26] which is frequently used to find the low-lying eigenvalues
In Fig. (2) we illustrate the spectrum of averaged over the SESAM configurations, at lightest and heaviest sea quark mass respectively, for which we plot the dependence of on . The ordering is chosen according to
| (14) |
The upper (lower) line corresponds to the heaviest (lightest) sea quark mass of the SESAM sample. Their ratio, is plotted in Fig. (2) as a function of . It shows a rather steep rise for , which illustrates the growing importance of the lowest-lying modes in the spectral representation of , Eq. (3), when decreasing the sea quark mass. This feature should become even more pronounced for the imminent QCD simulations in the yet deeper chiral regime, .
III Determination of
In the continuum limit, the complete trace
| (15) |
is related via the index theorem [27] to the net topological charge of the gauge field. Albeit the breaking of chiral symmetry by the standard Wilson lattice action blurs this connection somewhat at finite lattice spacings, , one would still expect remnants of the index theorem to hold [28]. In previous works, has been estimated by use of stochastic estimator techniques (SET) which basically compute quark propagators on stochastic sources, and indeed, a close correlation between gauge field topology and has been observed [29, 30]. Hence, it is a quantity of significant interest. This will be all the more the case in future applications of the overlap fermion lattice formulation [31].
is given by the sum of the inverse eigenvalues:
| (16) | |||||
| (17) |
Physically, it is the low-lying modes that encapsulate the interesting information within the full sum of Eq. (17) while the large modes provide just nuisance by adding background noise to the infrared signal. Heu me miserum, in order to turn this qualitative proposition into a quantitative statement we would need to know the transition point between infrared and ultraviolet physics. For an approximate use of the spectral relation, Eq. (17), we need a cunning technique to deplete the unwieldy background.
With this in mind let us take a heuristic approach and study the pattern of eigenvalue distributions as obtained from the SESAM ensemble of vacuum configurations. To reach our goal, it is useful to order the spectrum and perform certain partial summations in Eq. (17):
Let denote the positive and the negative eigenvalues,
| (18) |
and let them be ordered such that:
| (19) | |||||
| (20) |
In order to study convergence properties let us define the following partial series:
| (21) | |||||
| (22) | |||||
| (23) |
where, in obvious notation, the parameter labels the excess number of entries with positive (negative) over the ones with negative (positive) eigenvalues. In Fig. (3) and Fig. (4) the values of are plotted for the index range , as obtained from one particular SESAM configuration at our lightest available quark mass, . The partial sums appear to exhibit a certain convergence pattern which is displayed in Fig. (4), where we connected the points to given -values.
Alternatively, one might organize the summation in the order of increasing moduli of the eigenvalues (Eq. (14)), independent of their signs, and define the truncated sums
| (24) |
The family of curves, provides a suitable framework to disclose the asymptotic behavior of this inverse eigenvalue summation, . This is illustrated, again for the particular gauge configuration, in Fig. (5), where we display the data points for in the range . For reference we also show the (slowly narrowing) band of the partial sums, . Note that from onward, in this particular configuration jumps‡‡‡ To put it differently: the asymptotic distribution of eigenvalues is characterized by alternating signs when proceeding according to the order given by Eq. (14). mostly between the two levels and . Moreover appears to be distinguished as lying between the asymptotically falling set of curves with and the rising ones, .
We found this scenario to apply mutatis mutandis to all configurations in the sense that
-
for each gauge field , contracts around a particular partial sum that levels to a plateau value beyond , with depending on the choice of the gauge field .
Let us next quantify our observations and denote the height of this supposed plateau with , setting
| (25) |
Note that varies with the underlying gauge configuration . The question then arises how accurately we can extract the actual plateau height. In order to appreciate the numerical flatness of the plateau curve we pushed the eigenvalue computation to a number of 600 modes on a single SESAM configuration. In Fig. (6) we display the resulting plateau on a magnified scale. Assuming that the apparent remaining weak oscillation for is a pars pro toto feature for the entire SESAM sample and that with 300 eigenvalues one has already passed the first extremum on the entire sample of gauge fields , we estimate that from the lowest-lying 300 eigenvalues can be determined with a bona fide accuracy of .


Next let us argue that the plateau value, , provides us with an approximant for the complete trace, Eq. (15):
| (26) |
What is the deviation from the complete trace in our situation? In our range of quark masses, we can exclude zero-level crossings of eigenmodes. Therefore the matrix possesses an equal number of positive and negative eigenvalues. Hence, when adding up all eigenvalues (with ), will lie on the curve with superscript 0
| (27) |
Thus is related to the plateau height in the following way:
| (28) |
The second term on the r.h.s. measures the distance between and at . It can be neglected with respect to the error on itself, since is approximately equal to the error of .
Another justification for the validity of our approximation, Eq. (26), comes from our observation that different field configurations yield equal results when plotted with appropriate offsets , namely . This is illustrated in Fig. (7) and Fig. (8) where we superimpose 10 such series for : it strikes the eye that, for , the partial sums to the 10 gauge fields all collapse onto a single, universal family of curves:
| (29) |
Hence there exists a set of -independent functions such that the following identity with respect to applies:
| (30) |
This pattern strongly supports the picture that on our configurations the interesting physics with respect to the topological charge is indeed contained in the subset of the 150 smallest eigenvalues, while the remaining ones carry no information on .
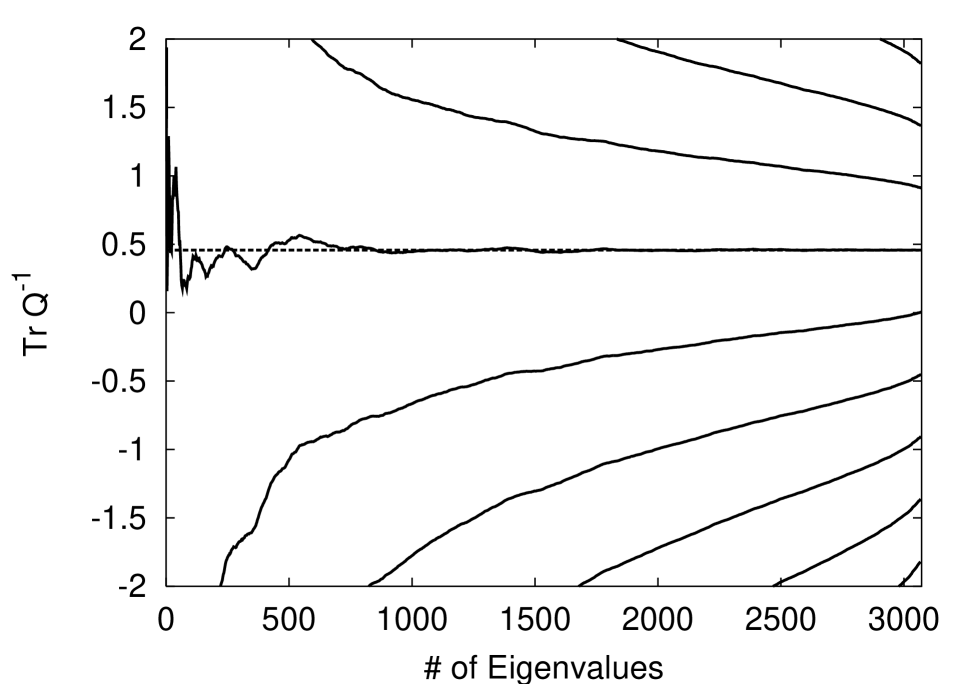
We corroborate this result by considering a lattice where we determined all 3072 eigenvalues of in quenched QCD at . In Fig. (10) we plotted the corresponding partial sums . Notice that (here happens to be 0) remains absolutely flat after reaching its plateau value at around .
A comparison of the values as produced by TEA with the ones obtained in Ref. [30] from SET on the entire sample is shown in Fig. (10). The data points seem to scatter rather nicely around the bisecting line. While the accuracy of the TEA results on individual configurations is about , the uncertainty of the SET estimates turns out to be .
In Fig. (11) we present TEA’s (normalized) values along the Monte Carlo history of our SESAM sample at and compare them to the result of the gluonic determination after cooling [30]. We reconfirm our previous finding [29] that there is a close correlation between the gluonic and fermionic definitions of the net topological charge.
IV Hadronic two-point functions
In this section we wish to investigate the potential of spectral methods in the computation of two-point hadronic correlators [32]. The question here is to what extent we can verify low-lying eigenmode dominance for infrared physics, specifically the ground states in particular hadronic channels.
In order to set the stage we shall first consider the octet pseudoscalar channel as we can easily compare to standard pion correlator computations. We shall then elaborate on the spectral approach to the singlet pseudoscalar propagator which differs from the octet one by the two-loop correlator. The latter involves the computation of incomplete trace expressions and thus represents a quantity of increased complexity.
A Basics for mass determinations
Masses are extracted from the large time behavior of correlation functions that carry the quantum numbers of the particles in question. The correlation functions of the and the have the following form
| (32) | |||||
| (33) |
with and flavors. The coordinate is subdivided into a spatial and a temporal part . By introducing energy eigenfunctions one can show that these correlation functions decay exponentially in time, with the particle mass being the decay constant . On a toroidal lattice however with temporal extent this exponential decay appears as a cosh, . Local masses can be retrieved for every value of by solving the implicit equations
| (34) |
with respect to . Plateaus in the time dependence of the local masses exhibit the masses of the particles.
B Smearing
The extension of the local mass plateaus can be increased by enhancing the overlap with the ground state correlation function. We follow Ref. [33] and apply the smearing matrix , with
| (35) | |||
| (36) | |||
| (37) |
choosing and .
Source and sink smearing are readily accomplished by the replacements
| (38) |
in the spectral propagator representation
| (40) | |||||

Throughout this section we will assume the eigenmodes to be enumerated according to Eq. (14).

C Pion correlator
The spectral representation of reads
| (41) | |||||
| (42) |
where we suppressed the brackets that represents the average over the gauge fields.
For no early saturation over the entire -range can be expected, as one can see by integrating Eq. (42)
| (43) |
Since all the contributions on the r.h.s. of Eq. (43) are positive the series is monotonically increasing. Therefore – contrary to the case of the topological charge – neither cancellation effects nor early saturation can be expected in this global quantity. But what about the regime of infrared physics described by the correlator, i.e. its asymptotic behavior in ?
Let us consider the truncated spectral correlator
| (44) |
In order to demonstrate the low-lying eigenmode dominance at large time separations we present in Fig. (13) a family of curves, , for the various time slices , plotted against the spectral cutoff, , at the lightest SESAM quark mass. It is gratifying to find that for shows a flat behavior in the regime . On the other hand for small time separations higher eigenmodes continue to add – in accordance with the idea of excited state contaminations.
It is interesting to carry out a direct comparison of TEA with the standard propagator as computed by linear solvers on a local source, in order to see saturation occur in the region of interest, see Fig. (13). We find good agreement in the asymptotic regime, . We also show the fit (fit range:) to the data from the inverter to the usual parameterization:
| (45) |
A much more sensitive test of TEA is to look at local effective masses. In Fig. (15) we compare, at the cutoff value , the TEA results with the ones from standard propagator analysis, for the lightest SESAM quark mass. The effects of smearing and varying quark masses are displayed in Fig. (15), again for . As anticipated, we do observe a clear tendency for improvement in the spectral approach with decreasing quark mass. Yet there remains a marked oscillatory behavior over the entire SESAM range of quark masses. Moreover we notice that smearing slightly improves the signal.
A synopsis on the cutoff dependence of is presented in Fig. (16), as obtained on a particular configuration at the lightest quark mass. To avoid cluttering of the data we have spread out the different curves by means of the variable . This survey plot is meant to convey an idea how the oscillation will dampen out with increasing cutoff .
Thus we have demonstrated that in the sea quark mass regime of the SESAM configurations, there is insufficient dominance of the low-lying eigenmodes to utilize TEA for a sensible calculation of the mass.
D -correlator
Let us consider next the flavor singlet pseudoscalar channel with the ground state particle . As described in Eq. (32) differs from by the two-loop correlator :
| (46) |
the spectral representation of which reads
| (48) | |||||
where we suppressed again the brackets indicating the average over the gauge fields.
Again we sum over in order to learn about TEA’s potential in the two-loop situation
| (49) |
This is just the square of the ’topological charge’, see Eq. (17). Therefore we might expect TEA to work as well as in section III.


We define the truncated two-loop correlator through
| (50) | |||
| (51) |
and plot in Fig. (17) the dependence of on the cutoff . Contrary to the pion propagator (see Fig. (13)), Fig. (17) indeed reveals good saturation of the spectral representation by the low-lying eigenmodes over the entire -range.
As a check for consistency we compare the local two-loop correlators from TEA and standard SET at our lightest quark mass in Fig. (18). They are seen to agree very well within their errors. Note that the TEA data show a much smoother behavior in . Additional smearing for SET diminishes those fluctuations. We notice that TEA and SET data bear errors of equal size. We view this as an independent confirmation of previous claims that the errors on the mass from state of the art SET analyses are dominated by gauge field noise [6, 7].
Next we come to the more stringent test: local effective -masses. According to Eq. (46), the -propagator is the difference of one- and two-loop corrrelators, and . The ground state contribution to the former, , can be determined very accurately by the standard methods (by iterative solvers) known from the octet spectrum [22]. Hence, it appears very natural to replace the one-loop correlator by its ground state component, , see Eq. (45). In the following, we perform a ‘one-loop groundstate analysis’ (OLGA) by the extraction of local masses, , from the combination
| (52) |
The results are presented in Fig. (19), both for the lightest and heaviest sea quark masses of SESAM, with and without smearing. We find striking plateau formation from the very first time slice onwards.
As a consistency check and first test of the synthetic data approach, Eq. (52), we compare the local effective masses from TEA and SET in Fig. (20). The data points are seen to agree very well with each other, the TEA points being slightly less fluctuating. The horizontal lines in Fig. (19) and Fig. (20) refer to the fitted plateau values for the masses.
As yet another test on systematic errors we plot in Fig. (21) – again for local and smeared wave functions and the lightest and heaviest quark masses – the dependence of the local masses from TEA on the spectral cutoff . It appears that the systematic errors from this cutoff are well under control, once we truncate the spectral representation with and higher. Furthermore the data appear to support the idea that TEA improves when decreasing the quark mass.
Finally we address the question, to what extent the mass is influenced by the topological content of the configurations. By applying the cuts in , we subdivide the gauge field ensemble for the two -values into two subsets each, with determined as described in section III. The cuts are chosen such that each subset consists of about 100 configurations. The results from OLGA can be seen in Fig. (22). They clearly confirm the previous finding [6, 30], that topologically nontrivial gauge configurations are the origin for the large mass [34, 35].
V Discussion and summary
We have presented and validated a method to compute fermion loops from the low-lying eigenmodes of the hermitian form, , of the standard Dirac-Wilson matrix, , in accordance with the expectation that these modes contain the essential physics associated with topological fluctuations. Our truncated spectral approach (TEA) to is viable in the sense that it renders satisfying results in the quark mass regime of state-of-the art full QCD simulations like SESAM on the basis of modes only. TEA has been verified both with respect to the topological charge and the two-loop correlator entering the propagator.
The early onset of saturation for could be attained by proper ordering and subsequent partial summations, configurationwise adapted to achieve cancellations from positive and negative eigenvalues. In this way the bulk of the higher mode contributions were shown to vanish. For the case of the an early plateau formation of the local masses could be obtained by ground state projecting the connected piece of its propagator.


We confirm previous results in the intermediate quark mass regime that the actual bottleneck in increasing accuracy of loop estimates is given by the gauge field noise, i.e. by the present limitation in ensemble sizes of QCD vacuum configurations.
We found that the amount of work, i.e. the number of matrix vector multiplies, , needed per configuration in TEA compared to SET [6] for the lightest SESAM quark mass is roughly in the same ballpark§§§Actually the ratio when using 300 stochastic source vectors and 300 eigenmodes.. This looks promising for the upcoming era of Teracomputing, where we shall deal with larger lattices and smaller quark masses. The reason is, that the Arnoldi method does not lose efficiency when entering deeper into the critical chiral regime, in contrast to Krylov solvers used within stochastic estimator algorithms which will suffer in convergence rate.
Let us finally comment on the viability of the spectral approach applied to instead of . To this end we compare in Fig. (23) the pion correlation function as determined from 600 low-lying eigenmodes of , see Fig. (24), with the one obtained from the standard method (solving linear systems). Obviously, for the case of which corresponds to a pion mass of the order of 730 MeV, the chosen low-lying modes of contain less information about this function than the eigenmodes of . In order to trace down this discrepancy between and we also carried out a full diagonalization on a quenched lattice at for the two cases. In Fig. (25), we plotted the resulting versus the cutoff. While again shows a quite stable behavior similar to Fig. (13), the spectral approximation for yields a very ragged cutoff dependence that requires all 3072 eigenmodes for a satisfactory representation of the correlator. We conclude that the eigenmodes of , being non orthogonal, suffer interferences among each other. Thus, for the test case and for the sea quark masses used in the SESAM configurations, we have not been able to identify a limited number of dominating eigenmodes.
A detailed analysis of the mass, based on OLGA and additional SET data, will be presented in a forthcoming paper [36].
Acknowledgements The bulk of computations for this project was carried out at NIC/Jülich and NERSC/Livermore. We thank the staff of both centers for their support. Complementary analysis was carried out on the 128 node cluster ALiCE with the support of the DFG project Li701/3-1. H. N. thanks G. Bali, I. Hip, B. Orth, W. Schroers, T. Struckmann and P. Ueberholz for discussions and support. The HMC productions were run on the APE100 systems at INFN Roma and NIC Zeuthen. We are grateful to our colleagues G. Martinelli and F. Rapuano for the fruitful TL-collaboration. Work supported in part by the U.S. Department of Energy (DOE) under cooperative research agreement #DE-FC02-94ER 40818.
REFERENCES
- [1] F. Jegerlehner et al., ECFA preprint ECFA/99/200 (1999).
- [2] UKQCD, C. McNeile and C. Michael, Phys. Rev. D63 (2001) 114503, hep-lat/0010019.
- [3] M. Okawa, Nucl. Phys. Proc. Suppl. 47 (1996) 160, hep-lat/9510047.
- [4] SESAM, S. Güsken et al., Phys. Rev. D59 (1999) 114502.
- [5] CP-PACS, A.A. Khan et al., Nucl. Phys. Proc. Suppl. 83 (2000) 162, hep-lat/9909045.
- [6] SESAM, T. Struckmann et al., Phys. Rev. D63 (2001) 074503, hep-lat/0010005.
- [7] UKQCD, C. McNeile and C. Michael, Phys. Lett. B491 (2000) 123, hep-lat/0006020.
- [8] K. Bitar et al., Nucl. Phys. B313 (1989) 348.
- [9] S.J. Dong, J.F. Lagae and K.F. Liu, Phys. Rev. Lett. 75 (1995) 2096, hep-ph/9502334.
- [10] SESAM, N. Eicker et al., Phys. Lett. B389 (1996) 720.
- [11] UKQCD, C. Michael and J. Peisa, Nucl. Phys. Proc. Suppl. 60A (1998) 55, hep-lat/9705013.
- [12] W. Wilcox, In Frommer et al. [37], hep-lat/9911013, Proceedings of the International Workshop, University of Wuppertal, August 22-24, 1999.
- [13] SESAM, J. Viehoff et al., Lattice ’97, edited by C.T.H. Davies et al., , Nucl. Phys. B (Proc. Suppl.) Vol. 63, pp. 269–271, North-Holland, Amsterdam, The Netherlands, 1998, Proceedings of the XVth International Symposium on Lattice Field Theory, Edinburgh, Scotland, July 22-26, 1997.
- [14] UKQCD, C. Michael and P. Pennanen, Phys. Rev. D60 (1999) 054012, hep-lat/9901007.
- [15] T.L. Ivanenko and J.W. Negele, Nucl. Phys. Proc. Suppl. 63 (1998) 504, hep-lat/9709130.
- [16] I.M. Barbour et al., The Recursion Method and its Applications, Solid State Sciences Vol. 58 (Springer, Berlin, Heidelberg, New York, 1985), 149.
- [17] R. Setoodeh, C.T.H. Davies and I.M. Barbour, Phys. Lett. B213 (1988) 195.
- [18] L. Venkataraman and G. Kilcup, (1997), hep-lat/9711006.
- [19] K. Jansen et al., Nucl. Phys. Proc. Suppl. 53 (1997) 262, hep-lat/9608048.
- [20] R. Narayanan, FSU-SCRI-98C-88.
- [21] A. Duncan, E. Eichten and H. Thacker, Nucl. Phys. Proc. Suppl. 83 (2000) 449, hep-lat/9909123.
- [22] SESAM, N. Eicker et al., Phys. Rev. D59 (1999) 014509.
-
[23]
K. Maschhoff,
Parallel Arnoldi method,
http://www.caam.rice.edu/kristyn/parpackhome.html. - [24] C. Gattringer and I. Hip, Nucl. Phys. Proc. Suppl. 73 (1999) 871, hep-lat/9809020.
-
[25]
R.J. Radke,
A MATLAB implementation of the implicitly restarted ARNOLDI
method for solving large-scale eigenvalue problems, 1996,
http://www.caam.rice.edu/software/ARPACK. - [26] G.H. Golub and C.F.V. Loan, Matrix computations, 3rd ed. (Johns Hopkins Univ. Press, Baltimore, 1996).
- [27] M.F. Atiyah and I.M. Singer, Annals Math. 93 (1971) 119.
- [28] J. Smit and J.C. Vink, Nucl. Phys. B286 (1987) 485.
- [29] B. Allès et al., Phys. Rev. D58 (1998) 071503.
- [30] SESAM, G.S. Bali et al., (2001), hep-lat/0102002, submitted to Phys. Rev. D.
- [31] H. Neuberger, In Frommer et al. [37], hep-lat/9910040, Proceedings of the International Workshop, University of Wuppertal, August 22-24, 1999.
- [32] T. DeGrand and A. Hasenfratz, (2000), hep-lat/0012021.
- [33] S. Güsken, Nucl. Phys. Proc. Suppl. 17 (1990) 361.
- [34] E. Witten, Nucl. Phys. B156 (1979) 269.
- [35] G. Veneziano, Nucl. Phys. B159 (1979) 213.
- [36] H. Neff et al., To be published.
- [37] A. Frommer et al., editors, Numerical Challenges in Lattice Quantum Chromodynamics, Lecture Notes in Computational Science and Engineering, Springer Verlag, Heidelberg, 2000, Proceedings of the International Workshop, University of Wuppertal, August 22-24, 1999.