Comparing Clusters and Supercomputers for Lattice QCD
Abstract
Since the development of the Beowulf project to build a parallel computer from commodity PC components, there have been many such clusters built. The MILC QCD code has been run on a variety of clusters and supercomputers. Key design features are identified, and the cost effectiveness of clusters and supercomputers are compared.
1 INTRODUCTION
The Beowulf project began in 1994 at the NASA Goddard Space Flight Center. More about the history of the project and the current status can be found at the web site http://www.beowulf.org. There are about 100 clusters listed on the Beowulf home page (which is clearly not a complete list). Within the MILC collaboration, we have access to at least five clusters at our universities. We also have done production work on six other clusters at national supercomputer centers.
There are several advantageous characteristics often cited for clusters. Chief among these is the use of commodity hardware to produce a very cost-effective computer. Processors such as the Intel Pentia and Celeron and the AMD Athlon or K6, FastEthernet network cards and switches have been used to build quite cost-effective machines. However, other choices such as the Compaq Alpha processor and higher speed networks such as Myrinet, Giganet and Quadrics QsNet have also been used to build very powerful clusters. Another characteristic of clusters is the use of commodity software such as Linux, GNU, MPICH and PBS to keep software costs close to zero. A third advantage of the cluster approach is their programmability and flexibility. Message Passing Interface or MPI, has become a standard in commercial parallel computers. The MILC code had been compiled under MPI well before being run on a Beowulf cluster. The port to Beowulf required minimal effort. All of our PC cluster benchmarks have been done without any assembly code. Practical calculations can be done on current clusters with a granularity that is well suited to FFT routines. Clusters have a community of users and developers. New system administration tools frequently become available, as do advances in parallel file systems, schedulers and other useful software. Thus, one can take advantage of the vigor of the community and avoid spending a large amount of time developing software unrelated to the physics. Finally, because of the short design time of clusters, one can take quick advantage of the many developments in PC hardware. It is not necessary to lock oneself into a technology either well in advance of it’s actually being available, or a well developed technology that will be outdated by the time a large system can be constructed and commissioned. One can often avoid the problem of having a single source for key items. If you can no longer get a particular motherboard, there will be another vendor with a similar (or superior) offering.
There are also potential disadvantages of clusters. With a standard supercomputer, one can get a maintenance contract, and there is somebody to yell at when things go wrong. (However, as a long-time user of supercomputers, I know that having a vendor doesn’t assure that the problem will be fixed.) Recently, a number of vendors have been selling clusters. So the problem of not having anyone to yell at may be avoided. Of course, there is still no assurance that yelling (or even asking politely) will result in the problem being solved. Another disadvantage of the cluster approach is that of having to rely on the design effort of others. If vendors are not producing hardware with the specifications that you need, you may not be able to build a well optimized system. On the other hand, most physicists are neither skilled at nor interested in VLSI design or PCB layout and would rather spend their time thinking about physics, so why not take advantage of the labor of computer engineers?
The Indiana University Physics Department received $50,000 in 1998 to build a 32-node Linux cluster. The machine we built is called CANDYCANE, which stands for CPUs And Network Do Your Calculation And Nothing Else. CANDYCANE is an appropriate name because it was designed for the “sweet spot,” that is, components were picked to give the best price-performance ratio attainable. It is used by several research groups in the department, but usually only one or two jobs are running at the same time. In September 1998, a four-node prototype cluster was built and tested. Three different ethernet cards were tested to see if the higher priced cards could be justified by superior performance. Detecting no difference in performance, we selected the least expensive card for the production cluster. In October, the purchasing department put out a request for bids on the desired components. In November, just before Thanksgiving, the last of the components arrived. (Several vendors were used to get the best price on each component.) On the Wednesday and Friday of Thanksgiving break, 34 nodes were built, the software was installed and everything was placed on shelves and connected. One node serves as a console, and one as a spare. The cost per node was $693 for a Pentium II 350, with a 4.3 GB hard drive and 64 MB of ECC RAM. Each node has a floppy drive and a FastEthernet card. However, the compute nodes have no keyboard, video card or CDROM. There are a few video cards and an extra keyboard that can be used if a node does not reboot on its own. The 40-port HP Procurve switch cost about $2,000, so the total cost was about $25,000. Currently, (October, 2000) it would be possible to build this system for $300 per node, or for approximately $11,500. An even more attractive alternative would be a diskless Athlon 600 MHz system for which the per node cost is about $250. This node would have much better performance than the PII 350; however, the FastEthernet would be a bottleneck on the MILC code with Kogut-Susskind quarks. Even so, a 32 node system with a minimum performance of 1280 and 1660 Mflops, for and sites per node, respectively, could be built for under $10,000. This works out to a cost/MF of between $6.00 and $7.80.
In Sec. 2, we describe the key issues for good performance and in Sec. 3, we present benchmarks for the MILC code on various supercomputers and clusters. Section 4 gives rough cost-performance ratios for a number of platforms. Additional information about emerging technologies for clusters and user experiences can be found in the on-line presentations from a session that I organized at the March, 2000 APS meeting [1].
2 KEYS TO PERFORMANCE
A very simple approach to achieving good performance for domain decomposition codes like Lattice QCD codes is to optimize single node performance and to try to avoid degrading performance too much when one has to communicate boundary values to neighboring nodes.
The single node performance is likely to depend upon such issues as the quality of the CPU, the performance and size of cache(s), the bandwidth to main memory and the quality of the compiler. For message passing performance, key issues are the latency, peak bandwidth, processor overhead and the message passing software.


Focusing first on single node performance, we note that it is easy to waste a lot of money on a poor system design. To illustrate this, we consider the various speed AMD Athlon processors available and their prices on a particular day. Although we focus on Athlon here, the same considerations apply to Intel or other processors. Figure 1 shows that processor price is a rapidly increasing function of speed. In Fig 2, we divide the price by the speed of the chip and see that the relative expense rises rapidly for the faster chips. At the time this graph was produced, there was an apparent sweet spot at 600 MHz. The faster chips have a higher price-performance ratio. Depending upon the costs of the other components of the system, the entire system may have a higher or lower price-performance ratio.
For our QCD codes, access to memory is quite important. With the benchmarks below we demonstrate that performance does not increase in proportion to the speed of the chip. This is because memory speed is fixed by the 100 MHz Front Side Bus for both 500 MHz and 600 MHz Athlons.
| L | 500 MHz | 600 MHz |
|---|---|---|
| 4 | 231 | 276 |
| 6 | 129 | 135 |
| 8 | 97 | 102 |
| 10 | 92 | 97 |
| 12 | 90 | 95 |
| 14 | 89 | 93 |
| L | Gigabyte GA6VXE+ | Intel CC820 | SM PIIISED | SM P6SBA | RR † | LL ‡ |
| Pentium III 533B | PIII 533B | PIII 533B | PII 350 | PII 450 | PIII 733 | |
| 4 | 186 | 182 | 174 | 114 | 142 | 319 |
| 6 | 106 | 98 | 94 | 83 | 99 | 140 |
| 8 | 81 | 75 | 73 | 72 | 82 | 130 |
| 10 | 76 | 72 | 70 | 70 | 79 | 127 |
| 12 | 76 | 70 | 69 | 70 | 78 | 127 |
| 14 | 73 | 70 | 69 | 70 | 78 | 126 |
| † Roadrunner: Portland Group compiler | ||||||
| ‡ Los Lobos: Portland Group compiler | ||||||
The 600 MHz chip has a peak speed 20% faster than the 500 MHz chip. With lattice points, we do see a 20% speed up, but for the larger problem sizes that do not fit into cache, there is only a 5% speedup. We expect that for even faster processors performance increases will be marginal.
Since memory access is so crucial, I have purchased a Pentium III 533B chip that uses PC133 memory. In theory, it should provide about 33% better performance than a similar chip with PC100 memory. I have tried three different motherboards using different support chips and the results are disappointing. The Gigabyte GA6VXE+ motherboard uses a VIA chip set, the Supermicro (SM) PIIISED uses the Intel 810e chip set and I also tried an Intel CC820 motherboard using the Intel 820 chip set. The results are not significantly better than a PII 350 chip using a BX motherboard and the GNU C compiler and are worse than a PII 450 using the Portland Group C compiler. (See Table 2.)
However, there are support chips from ServerWorks that support PC133 memory well. Here are results from Los Lobos (LL), that uses Intel 733 MHz chips in IBM Netfinity servers that use the ServerWorks chip set. SuperMicro is manufacturing a dual processor motherboard that uses a support chip from ServerWorks, but the motherboard currently costs about $280, which is about twice the price of dual processor BX motherboard. Also, this board requires registered memory which will add to the cost of the system.
One of the disadvantages of using Athlon rather than Pentium chips is that there are not dual or quad processor boards available for the Athlon. However, this should change soon as in early October, 2000 AMD demonstrated a dual processor system using double data rate (DDR) memory.
Turning now to multiprocessor performance, we find that a simple performance model of the Kogut-Susskind Conjugate Gradient algorithm gives this bandwidth requirement to overlap communication and floating point operations:
| (1) |
where is the achieved bandwidth in Megabyte/s, is the achieved floating point speed in Megaflop/s on matrix-vector multiplication and an portion of the grid is on each node. We assume there are neighboring nodes in each direction, i.e., 16 or more nodes. The constant factor 0.364 is specific to KS quarks. However, the behavior is typical of the domain decomposition approach to parallelism and comes from the surface to volume ratio.
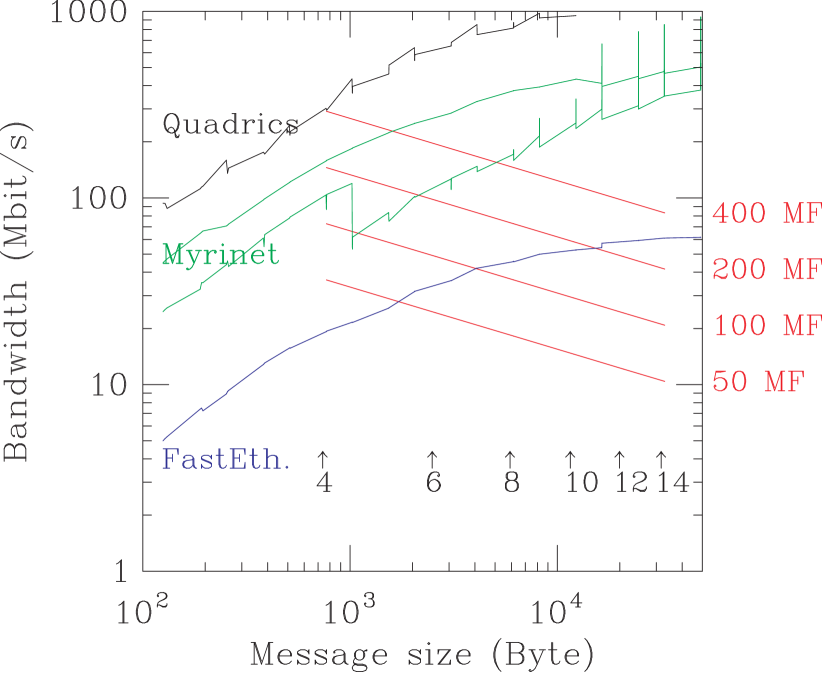
Figure 3 shows a log-log plot of measured bandwidth on a ping-pong test for three types of hardware and the performance model for several processor speeds. The messages vary in size from 800 bytes to 30 KB for problem sizes of interest. The arrows near the bottom of the graph correspond to different L values. The FastEthernet (blue) and Myrinet (green) curves come from measured performance on the Roadrunner (RR) supercluster at the Albuquerque High Performance Computer Center. Two curves are shown for Myrinet. With the newer drivers, bandwidth is better and smoother. The Quadrics curve comes from the Teracluster at Lawrence Livermore National Laboratory (LLNL). The measurement was done using the Netpipe program from the Ames Scalable Computing Laboratory [2]. The straight red lines come from the performance model presented above and are plotted for matrix times vector speeds of 50, 100, 200 and 400 MF. We need to run at a large enough value of L so that the measured bandwidth is above the red line (for what ever speed our processor achieves for the corresponding value of L). Because of cache effects, the processors will achieve higher speeds when is small, but that requires the highest bandwidth. Thus, pushing up the communication rate for small messages is important. Being able to run for a small value of with high efficiency allows running a fixed size problem at high total performance. We see that none of the networks achieves more than a small fraction of its peak bandwidth for the message sizes of interest. A system design based on achieving that peak bandwidth would almost certainly be communication bound, i.e., money would have been spent on floating point capacity that could not be used. There are large differences in the prices of FastEthernet, Myrinet and Quadrics hardware. Choice of network can obviously play a critical role in system performance and cost-effectiveness.
In addition to producing the data for the bandwidth curves, Netpipe provides the latency. It is easier to remember the latency of the different hardware and software combinations than the full bandwidth curve, so we tabulate that here.
| Hardware/software | Latency (s) |
|---|---|
| CANDYCANE MPICH | 151-166 |
| Roadrunner MPICH | 169-179 |
| CANDYCANE MVICH | 60 |
| CANDYCANE GAMMA | 41 |
| Roadrunner Myrinet | 31-34 |
| Roadrunner Myrinet∗ | 16 |
| Teracluster Quadrics | 7 |
| ∗latest drivers |
MPICH with FastEthernet clearly has the longest latency. Unfortunately, the larger value is for a more recent kernel. The longer latency for Roadrunner with MPICH may be because it has dual processors. On CANDYCANE, I have experimented with two alternative protocols. A recent protocol called Virtual Interface Architecture (VIA) is being promoted by Compaq, Intel and Microsoft as a communication architecture for clusters superior to TCP/IP. The National Energy Research Scientific Computing Center (NERSC) has developed software called M-VIA [3]. M-VIA supports two types of FastEthernet cards and Packet Engines Gigabit Ethernet cards. It will eventually support hardware that is designed to support the VIA protocol. For now, a very attractive feature is the ability to get reduced latency without spending money on more expensive hardware than FastEthernet. I have also done a small amount of testing with the Genoa Active Message Machine (GAMMA) [4]. The setup and testing of this software is not complete, but a ping pong test under GAMMA gave a latency of 37s. The GAMMA developer estimates that 7 of the 37 s come from the switch and that running MPI over GAMMA would add an additional 4s.
Myrinet hardware is quite popular for high performance Beowulf clusters. The Roadrunner “supercluster” at the Albuquerque High Performance Computer was used to test Myrinet performance. When initially tested in August, 1999, the latency was 31-34 s. I recently retested with newer drivers and found the latency reduced to 16 s.
LLNL’s Compaq Alpha based cluster is networked with a Quadrics interconnect. It is a prototype of the Compaq SC series supercomputer. The measured latency there is only 7 s.
3 BENCHMARKS
The simple performance model presented above can help us predict when the communication and floating point are in reasonable balance, but it is no substitute for real benchmarks. A web site for MILC benchmarks may be found at physics.indiana.edu/~sg/milc/benchmark.html. Additional graphs and explanations may be found there. All the benchmarks presented are for single precision Kogut-Susskind conjugate gradient. Of course, we run many other codes, but this is one for which we have results going back several years.
Key variables for the benchmarks are the problem size and number of CPUs or nodes. We run benchmarks with sites per CPU and scale the problem size as the number of CPUs increases. [In most cases, we double the dimensions starting with so that no dimension is more than a factor of two different from the others. However, for 4 CPUs we run both and .] We do this because many computers have a sweet spot for some value of , and in deciding how many nodes to use for production running, we are usually more interested in running efficiently than at maximum speed. The sweet spot comes about because on a single node, small values of usually perform best because they take advantage of cache. However, as we saw before, small values of make the most demands on the network. As is increased, the single node performance decreases, but the degradation from the network may decrease, so performance may increase until the cache misses become the limiting factor and performance again decreases. On PC clusters, the caches tend to be small and the latency high compared to parallel supercomputers, and we find that performance usually just continues to increase as is increased. It can be frustrating to run on a small supercomputer where one is forced to use a larger value of than optimal. One gets decreased performance both because one is running on fewer nodes and because each node is running more slowly than when running at the sweet spot.
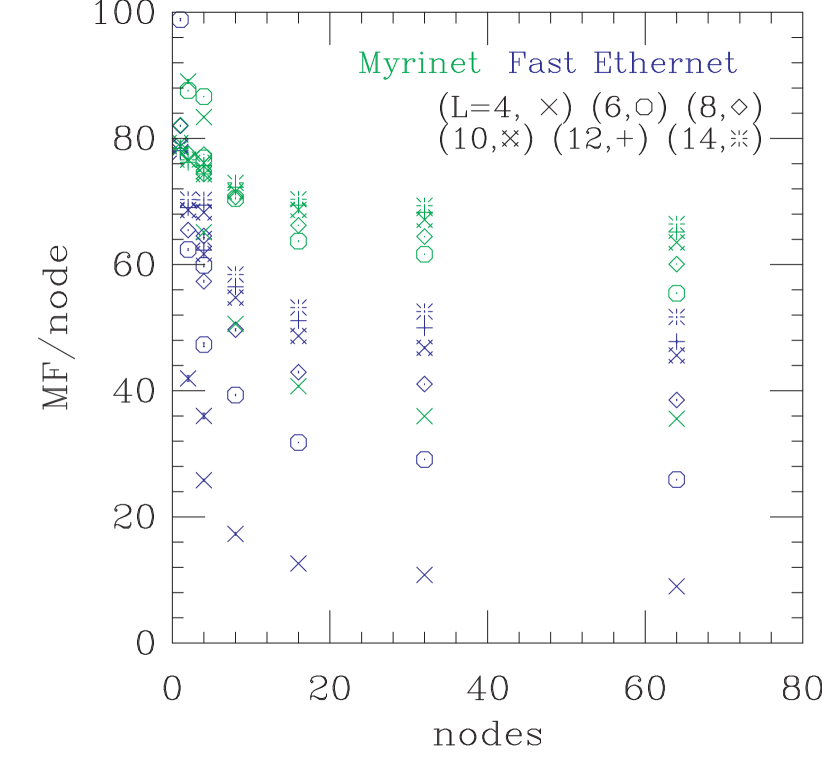
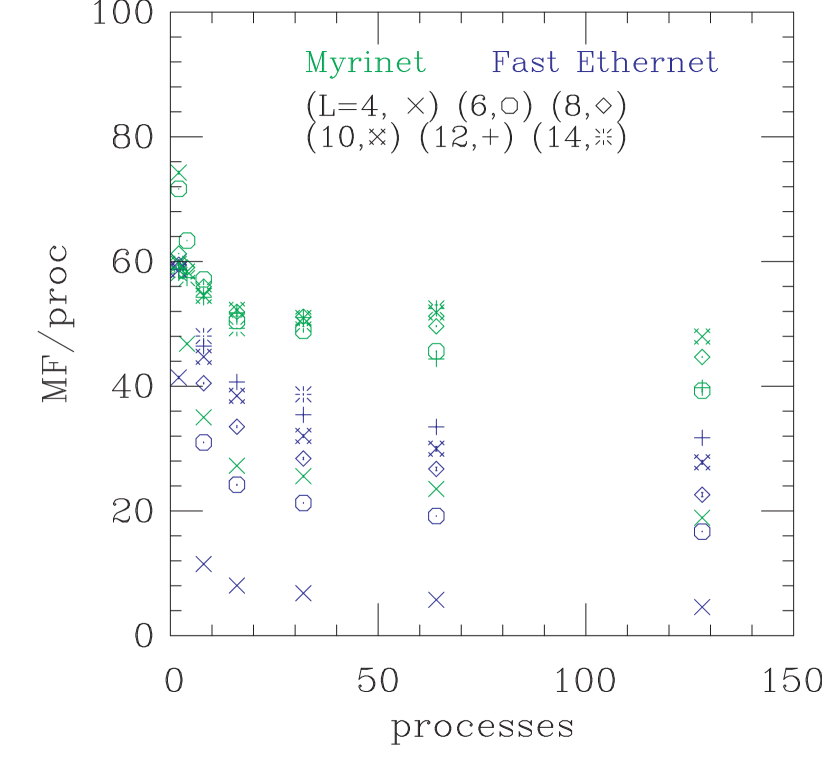
The Roadrunner cluster, built by Altatech, has been very useful for our benchmarking efforts because it has dual processor nodes and one can use either FastEthernet or Myrinet for the message passing. In Fig. 4, we compare the performance using either network but using only one CPU per node. In Fig. 5, we use both processors. From this exercise, we were able to determine that the limitations of the FastEthernet were so great that the second processor did not improve the cost-effectiveness of the system, but for Myrinet the second processor did. (Costs were determined by designing bare bones nodes with the desired characteristics, not by Altatech’s pricing.)
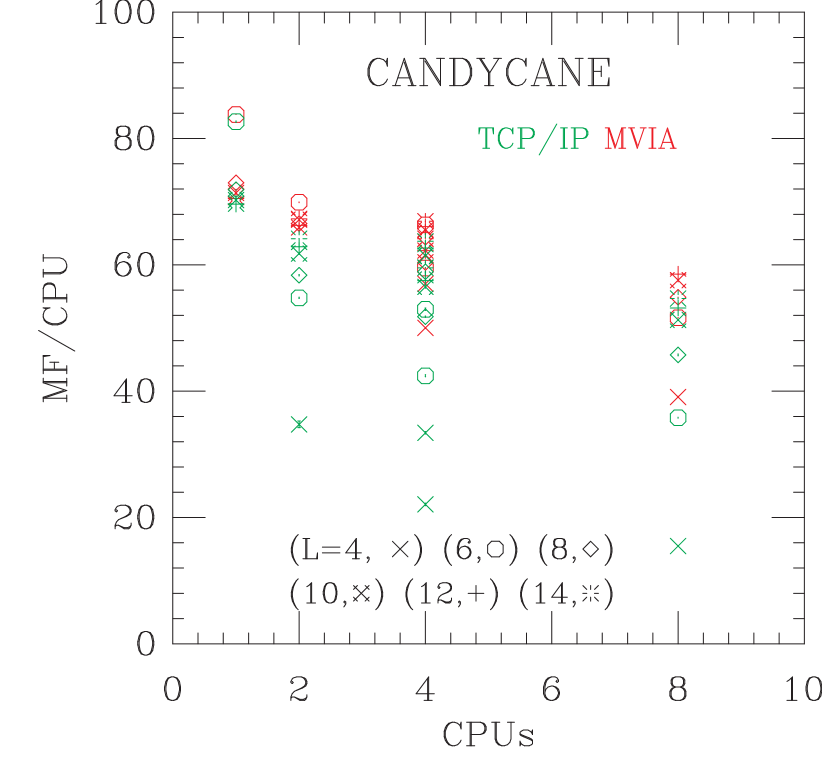
We compare MPICH and MVICH (MPICH running over M-VIA) using the same FastEthernet hardware in Fig. 6. The reduced latency really improves performance for the smaller values of . Unfortunately, we don’t have results for more than eight nodes because of a bug in the driver for the FastEthernet card we have in greatest abundance. This bug is supposed to have been fixed, but we have not found the time to install the new drivers and run the tests.
Moving on to supercomputers, we have results for Cray T3E900, IBM SP with various speed nodes, SGI Origin 2000, and Sun E10000. The Cray T3E does not have a sweet spot. Its performance continues to increase as is increased to 14. With some assembly code we get about 75–90 MF per CPU. For the IBM SP with 4 way SMP Winterhawk II (375 MHz Power 3) nodes, we find a distinct sweet spot at , where the performance is about 175 MF per CPU. By , however, performance has dropped to 50 MF per CPU. These tests were done with up to 64 CPUs. There may not be enough bandwidth to memory to support all four CPUs on a node. We ought to try prefetching data to cache on this computer to see if that would help. In a poster by Sonali Tamhankar [5], you can find out about our efforts to speed up the code using OpenMP on the SP and the E10000. The E10000 also has a sweet spot with peak performance of about 120 MF per CPU for and 64 CPUs. By , as on the SP, one is down to a performance level comparable to that of a FastEthernet cluster.
My favorite computer at this point is certainly the LLNL Teracluster, that has 4-way SMP Alpha EV67 667 MHz nodes and a Quadrics QsNet network. It is a cluster, with moderate SMP parallelism and a switched network; however, the QsNet hardware is not a commodity item at $3,000 per node. We get about 280 MF per CPU at the sweet spot . For , performance is still close to 200 MF per CPU. These benchmarks use some very old Alpha assembler code that is far from optimized for the current architecture, so with some effort, we might be able to do quite a bit better. (Faster results have been reported by others on Wilson or Clover inverters.) The new NSF Terascale computer to be built at the Pittsburgh Supercomputer Center will be quite similar to this, but it will have a more advanced processor.

Figure 7 summarizes results on various supercomputers for on up to 64 CPUs. For full details visit the MILC benchmark web page.
4 PRICE-PERFORMANCE RATIOS
Before presenting any numbers for price-performance ratios, it is essential to point out some caveats. It is not trivial to get prices for supercomputers. You actually have to take up a salesperson’s time to generate a quote, and that is not a very nice thing to do if your main goal is to tell the person that the computer is overpriced. Also, discounts can vary and details of configuration are not presented here. On the cluster side, the configurations were priced based on the lowest prices at www.pricewatch.com on October 31, 2000. Each node is configured with 64 MB of ECC memory per CPU and a 4.3 GB hard drive. To summarize, the numbers for clusters are up to date, and the numbers for supercomputers are based on older quotes. The cluster numbers presented at the conference were based on node prices over a year old.
We consider cluster nodes with either 450 MHz PII chips as in Roadrunner, or 733 MHz PIII chips as in Los Lobos. For the Los Lobos level system, we are assuming a ServerWorks dual-CPU capable motherboard will have comparable performance to the IBM Netfinity nodes. If one of the VIA chip based motherboards supports PC133 memory well, it would be a more cost effective alternative for the single CPU system. Switch prices are based on quotes received in January, 2000 or recent advertisements. Performance expectations are based on Roadrunner or Los Lobos. (An AMD Athlon based system was considered in Sec. 1. Performance claims there were based on RR, although they should be between RR and LL, so better performance than stated there is very likely.)
To build a single CPU node like Roadrunner, but with 64 MB of memory would cost $325. A dual CPU node, with 128 MB would cost $527. If more memory is desired, it should cost less than $1 per Megabyte. Los Lobos style nodes are $634 and $878, for single and dual cpu, respectively. Per port FastEthernet switch costs are about $56, $185 and $240, for 32, 72 and 144 ports, respectively. Myrinet cost is $1527 per port and scales linearly up to 128 ports with the Clos switches. These prices are for LANai 9, Myrinet 2000 cards. However, Los Lobos does not yet have the latest switch, so it is not running the Myrinet 2000 protocol, which has a peak bandwidth almost twice as fast as the current value.
For a single CPU RR level system, the price-performance ratio in $/MF is 7.2–9.3, 10–13, 11–15 and 28–31, for FastEthernet with 32, 64, 128 nodes and Myrinet, respectively. With dual CPUs, the numbers are 8–11, 12–16, 14–19 and 20–23. We see that the second CPU makes the Myrinet based system considerably more cost effective; however, for FastEthernet, although the marginal cost is small, the performance gain is not that great either, and the system is less cost effective. With the more expensive and higher performance LL level nodes, FastEthernet cost in $/MF is about 11, 14 and 17, and Myrinet is 20–22 for single CPU systems. With a second processor the Myrinet number drops to 16–21. Dual CPU benchmarks have not been run with FastEthernet, but the network performance should be even more of an issue here, and we expect the cost effectiveness to be somewhat less.
| Computer (date of quote) | $/MF |
| RR level 1 CPU FE (10/00) | 7–15 |
| RR level 1 CPU Myrinet (10/00) | 28–31 |
| RR level 2 CPU FE (10/00) | 8–19 |
| RR level 2 CPU Myrinet (10/00) | 20–23 |
| LL level 1 CPU FE (10/00) | 11–17 |
| LL level 1 CPU Myrinet (10/00) | 20–22 |
| LL level 2 CPU Myrinet (10/00) | 16–21 |
| 64-node SGI Origin 250 MHz (2/99) | 193 |
| 44 node Cray T3E (2/99) | 480 |
| 256 node IBM Power 3 SP (2/00) | 166 |
| with estimated discount | 91 |
| 64 CPU Compaq Alpha Server SC | 150 |
This work was supported by the U.S. DOE under grant DE-FG02-91ER 40661. Special thanks to the MILC collaboration, and especially R. Sugar for reading the manuscript. We thank the Albuquerque High Performance Computer Center, Indiana University, LLNL, National Center for Supercomputing Applications, Pittsburgh Supercomputer Center and San Diego Supercomputer Center.
References
- [1] The presentations may be found at physics.indiana.edu/~sg/pccluster.html
- [2] Visit www.scl.ameslab.gov. Netpipe can be downloaded from there.
- [3] To find out more about M-VIA, see www.nersc.gov/research/FTG/via.
- [4] See the GAMMA web site of G. Ciaccio, www.disi.unige.it/project/gamma/.
- [5] S. Gottlieb and S. Tamhankar, these proceedings.