UTHEP-429 UTCCP-P-91 August 2000 Phase structure and critical temperature of two-flavor QCD with a renormalization group improved gauge action and clover improved Wilson quark action
Abstract
We study the finite-temperature phase structure and the transition temperature of QCD with two flavors of dynamical quarks on a lattice with the temporal size , using a renormalization group improved gauge action and the Wilson quark action improved by the clover term. The region of a parity-broken phase is identified, and the finite-temperature transition line is located on a two-dimensional parameter space of the coupling () and hopping parameter . Near the chiral transition point, defined as the crossing point of the critical line of the vanishing pion mass and the line of finite-temperature transition, the system exhibits behavior well described by the scaling exponents of the three-dimensional O(4) spin model. This indicates a second-order chiral transition in the continuum limit. The transition temperature in the chiral limit is estimated to be MeV.
I Introduction
With the development of recent experimental projects toward a detection of the high-temperature quark-gluon plasma in relativistic heavy ion collisions, it is urgent to theoretically establish thermal properties of QCD directly from its first principles.
For the pure gluon system, numerical simulations on the lattice are quite advanced by now, with the critical temperature and the equation of state, which are the basic thermodynamic quantities needed for phenomenological studies, well established in the continuum limit[1]. Full lattice QCD simulations incorporating dynamical quarks, however, have not reached such a status. In particular studies on spatially large lattices, which are required for determination of equation of state, are still limited to lattices of a small temporal size, and 6[2], due to large computational power needed for dynamical quark simulations.
A possible way to bring the simulation close to the continuum is to employ improved lattice actions: the continuum limit may be taken for thermodynamic quantities from coarse lattice spacings and correspondingly small temporal lattice sizes such as and 6 or even smaller. For the pure gluon system, there are a number of tests of this idea reported some time ago[3]. More recently it is shown[4] that the equation of state calculated for a renormalization-group (RG) improved gluon action[5] agrees with that for the plaquette action[6] in the continuum limit. In the present work we pursue an extension of this pure gluon study to full QCD with two flavors of dynamical quarks[7].
Here we focus our attention to the Wilson-type quark action, and study the effect of improvement for both gluon and quark sectors. Compared to Kogut-Susskind (staggered) quark action[8], a clear advantage of the Wilson-type quark actions is manifest flavor symmetry. On the other hand, chiral symmetry is explicitly broken causing some subtleties in the analysis. This leads to large lattice artifacts at the range of lattice spacing –2 GeV extensively used in finite temperature simulations, when the combination of the plaquette gluon action and the standard Wilson quark action is used. The most notable artifact is an unexpected strengthening of the finite-temperature transition at intermediate values of the quark mass [9, 10]. This undesired behavior disappears when an RG-improved gauge action is employed [11]. A comparison with other action combinations, the plaquette gluon action and a clover-improved [12] Wilson quark action [13], or the Symanzik-improved gluon action and a clover-improved quark action [14], indicates that improvement of the gluon action is essential in removing the dominant lattice artifacts at finite lattice spacings. On the other hand, we expect that improvement for the quark action renders the behavior of fermionic thermodynamic quantities close to continuum.
Previous studies with the standard Wilson action have shown that the phase diagram in the plane of coupling and hopping parameter contains a phase with spontaneous breakdown of parity-flavor symmetry[15]. The boundary of this phase is characterized by vanishing of pion (screening) mass. The interplay of the boundary with the line of finite-temperature transition plays a crucial role in understanding the finite-temperature transition with Wilson-type quark actions [16, 10, 17]. Thus, prior to calculation of thermodynamics quantities, an examination of the finite-temperature phase structure is indispensable when one uses the clover-improved Wilson quark action coupled to the RG-improved gluon action.
A particularly important point concerns the universality property of the finite-temperature transition. For the standard staggered quark action, extensive scaling analyses carried out for failed to establish either the O(4) scaling expected from the effective sigma model analysis[18] or the O(2) scaling suggested from the actual symmetry of the staggered quark action[19, 20, 21, 22]. On the other hand, a study with the standard Wilson quark action coupled to the RG-improved gauge action found that the O(4) scaling ansatz describes well the chiral condensate data [11, 17]. Our interest here is to explore whether the O(4) scaling is maintained for the clover-improved Wilson action. Such an analysis is also necessary to quantitatively locate the point of transition for massless quark. Combining this information with measurements of hadron masses at zero temperature, we obtain an estimate of the critical temperature.
In this paper we adopt specifically the improved gluon and quark actions which is resulted from a systematic comparative study of various combinations of improved actions[23]. The combination is the same as that we have used in our zero-temperature studies reported elsewhere[24, 25].
This paper is organized as follows. The action and the simulation parameters are described in Sec. II. The phase structure for our action is studied in Sec. III. Section IV is devoted to the issue of the O(4) universality. Assuming the O(4) critical exponents, we then extrapolate the transition line to obtain a precise estimate of the chiral transition point. The transition temperature in physical units is discussed in Sec. VI. A brief conclusion is given in Sec. VII.
II Simulation
A Choice of the action
We employ the RG-improved gluon action [5]
| (1) |
with and and , coupled with the clover-improved Wilson quark action [12] defined by
| (2) | |||||
| (3) |
Here is the lattice discretization of the field strength,
| (4) |
with the standard clover-shaped combination of gauge links, and we adopt the meanfield-improved clover coefficient
| (5) |
using calculated in the one-loop perturbation theory[5]. This choice of , when expanded in , agrees well with the actual one-loop result [26]. Furthermore, the one-loop values of reproduce the mean values of plaquette within 8% for the range of and of our studies[24, 25].
This combination of improved gauge and quark actions was tested in our full QCD comparative study[23]. We found that the scaling violation in light hadron masses and the violation of rotational invariance in a static quark potential are both small with this combination of actions already at GeV where our finite temperature simulations are made, as compared to GeV needed for the standard plaquette gauge and Wilson quark actions.
B Details of simulations
We make our finite-temperature simulations on a lattice with a temporal extension . Zero-temperature simulations with temporal sizes comparable or larger than spatial sizes are also made to calculate hadron masses for the purpose of fixing the scale.
Our simulation parameters are summarized in Tables I–IV. Runs are carried out on lattices of size and at –2.2, and of size and at –1.7. Except for the case of the lattice, we use anti-periodic boundary conditions in the temporal direction for quarks. All other boundary conditions are taken to be periodic. Simulations are carried out at seven to eleven values of the hopping parameter for each , which correspond to –0.9 for the lattices, and –1.0 for the lattices.
The Hybrid Monte Carlo algorithm is employed to generate full QCD configurations with two flavors of dynamical quarks. Details of the simulation are basically the same as in our zero temperature studies [24, 25]. The molecular dynamics time step is chosen to yield an acceptance rate greater than about 80%. The length of one trajectory is unity in most cases, but is reduced down to 0.25 at several points close to the critical line to keep the acceptance rate of about 80% within 200 molecular dynamics time steps. The inversion of the quark matrix is made with the BiConjugate Gradient Stabilized (BiCGStab) method for , where is the critical hopping parameter at zero temperature where pion mass vanishes. For , we use the Conjugate Gradient (CG) method since the clover-Wilson operator may have negative eigenvalues, in which case the BiCGStab algorithm fails to converge.
We measure gluonic observables, Wilson loops and the Polyakov line, at every trajectory. Hadron (screening) propagators are calculated at every 2–5 trajectories using both a point source and an exponentially smeared source for quark, and a point sink. For hadronic measurements on the lattice, we double periodically the lattice in one of the spatial directions. On the and lattices, we determine hadron masses by a single hyperbolic cosine fit to the propagator calculated with the smeared source, because of its clear plateaus of effective mass. On the and lattices, since a plateau is sometimes less clear with our smeared source, we perform a combined fit using both point and smeared sources.
We measure the current quark mass defined through an axial vector Ward-Takahashi identity [27, 28],
| (6) |
where is the pseudoscalar density and the -th component of the local axial vector current. In practice we make a simultaneous fit of the two-point functions and to extract the pion mass and the amplitudes , , from which we compute
| (7) |
We choose for zero temperature simulations, and at finite temperatures for which the screening masses are determined along the axis. We also use an alternative definition of quark mass given by
| (8) |
While these different definitions of give different values at finite , they converge to the same value in the continuum limit[29, 25]. In this work, we concentrate on the phase structure and critical properties around the finite temperature chiral transition point. Therefore, in this work, we ignore the renormalization factors , and since they are regular around the transition point.
We use the zero-temperature vector meson mass as a measure of the lattice scale. For , detailed hadron mass data for light quarks are available from our extensive calculations[24]. We use the results of hadron masses obtained in this reference for our analysis. These data, however, do not fully cover the region of heavy quark where the finite-temperature transition is located for at . We evaluate hadron masses in these regions, and interpolate them by a cubic spline formula to the point of transition.
No previous data are available in the region of strong coupling –1.7. Thus the hadron masses in this region are measured in the present work. We fit the vector meson mass in terms of pseudoscalar meson mass by an ansatz inspired by chiral perturbation theory,
| (9) |
The fit curves are illustrated in Fig. 1. The lattice spacing defined by identifying MeV in the limit of zero pion mass is given in Table V.
Errors are determined by a jack-knife method. From a study of bin-size dependence, we adopt the bin size of 1–10 configurations ( 2–50 trajectories) for hadron masses and 5–20 trajectories for other gluonic quantities.
III Phase structure
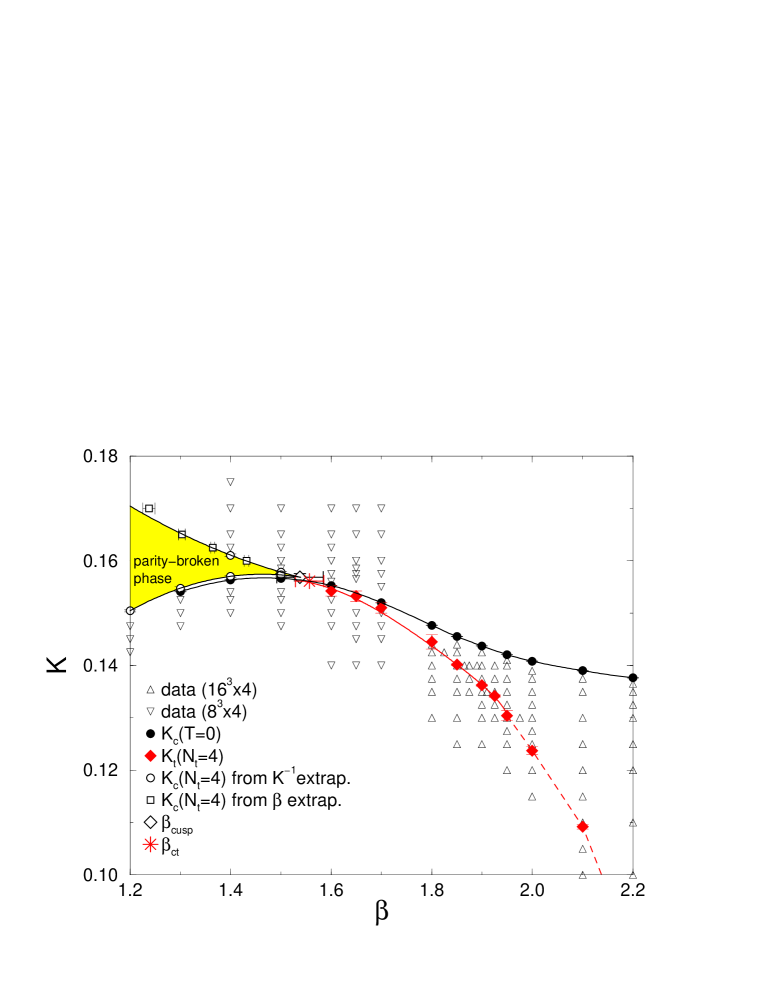
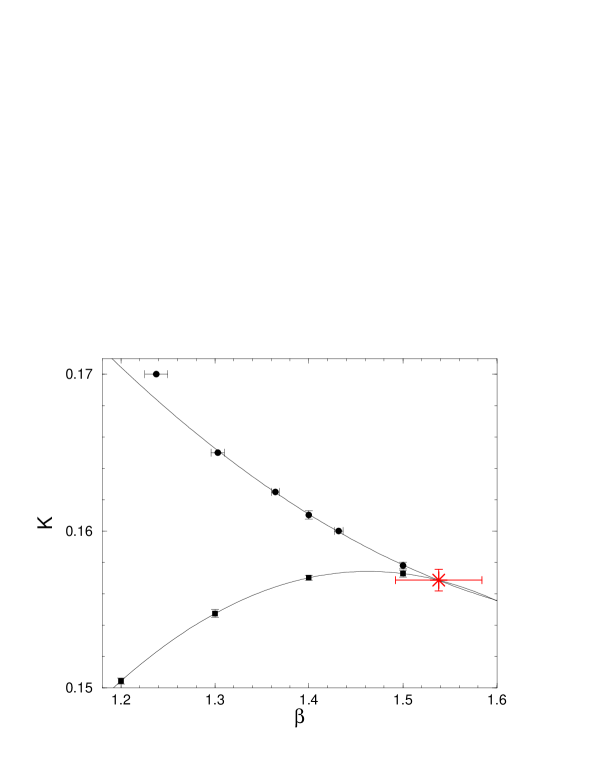
The phase diagram obtained in our study is summarized in Fig. 2. Details are discussed in the following subsections. Thin open symbols show the simulation points on the lattices. The solid line connecting symbols denoted as “” represents the critical line of vanishing pion mass at zero temperature. Other objects on the phase diagram are obtained on the lattices. The -line shows the location of the finite-temperature transition, above which the system is in the high-temperature phase. We expect the -line to cross the line. The crossing point is a natural candidate to be identified as the point of chiral transition[10]. The shaded region shows the parity-broken phase [15]. The lower boundary of the parity-broken phase lies closely above the line.
A Critical line at zero temperature
The location of the critical line at zero temperature where the pseudoscalar meson mass vanishes is essential information for discussion of chiral properties with Wilson-type quark actions. To determine , we extrapolate as a function of using a quadratic ansatz:
| (10) |
The results for are illustrated in Fig. 3 in the strong-coupling region of . Our values for are summarized in Table V and plotted in Fig. 2.
Towards the weak coupling limit, , the -line gradually approaches the free Wilson quark value 1/8. For the case of the standard unimproved Wilson quark action, is a monotonically decreasing curve connecting at and 1/8 at . For the case of our clover-improved quark action, the -line shows a maximum in at , and decreases as we lower below this value. This is likely to arise from our choice (5) for the clover coefficient, which diverges as approaches 0.8412.
B Finite-temperature transition
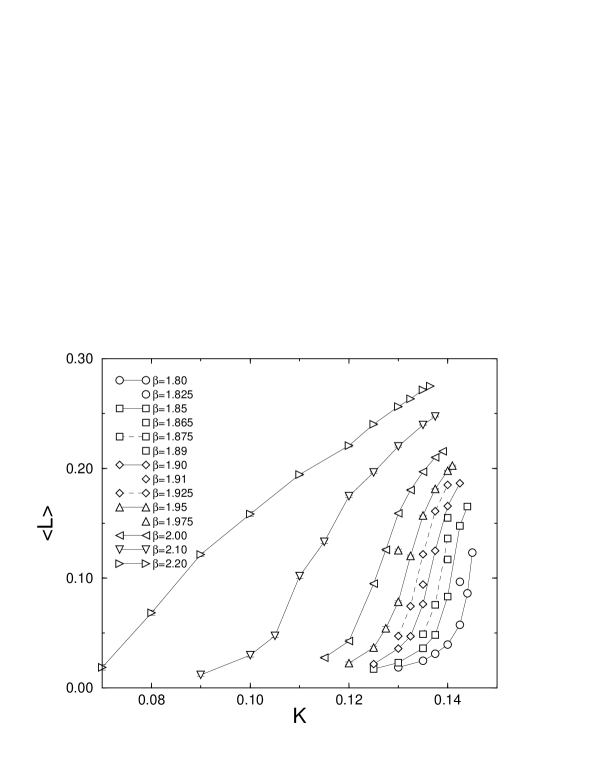
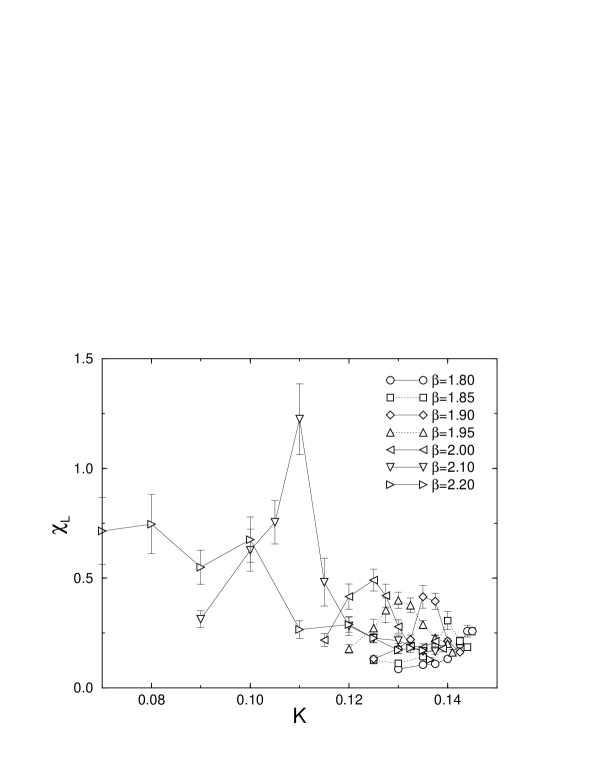
We identify the finite temperature transition point from inspection of the Polyakov line and Wilson loops. In Figs. 4 and 5 the Polyakov line and its susceptibility at –2.2 on the lattice are shown. We fit the peak of the susceptibility by a Gaussian form using 3 or 4 points near the peak, except for . The results for from the fit are given in Table VI. The ratios and with zero-temperature meson masses interpolated to the point are also summarized in the table, where is the pseudocritical temperature at . These results are used in Secs. V and VI.
On the -line thus determined, other physical observables, such as the plaquette, also show rapid changes. Smoothness of the data around suggests, however, that, for the range of quark mass we studied, the finite-temperature transition at is an analytic crossover. From Fig. 4 and similar plots for other observables, we see that the crossover becomes monotonically weaker with increasing . Increasing on the line corresponds to increasing the distance to the critical line, i.e. increasing the quark mass. In the limit of infinite quark mass , the line will end at the first-order deconfinement transition of pure gauge theory, which is located at for [30, 4].
For the smaller region () where simulations are made on an lattice, data for the Polyakov line become too noisy to determine the position of . We alternatively take the spatial plaquette shown in Fig. 6, and identify from its rapid changes. The range of for –1.7 thus estimated is summarized in Table VI.
The -line approaches the zero-temperature critical line as decreases (see Fig. 2). We expect the two lines to cross at a point . This point is a natural candidate for the point of chiral transition since the pion mass, and hence also the quark mass defined through the Ward-Takahashi identity, vanishes at zero temperature[10]. The location of this point obtained by scaling analyses (see Sec. V) is marked by a star in Fig. 2.
Our estimate for stops at . For , because the parity-broken phase appears at intermediate as discussed in the next subsection, a more detailed study is required to identify the location of .
C Parity-broken phase
For Wilson-type quark actions, chiral symmetry is explicitly broken by the Wilson term away from the continuum limit. The appearance of massless pseudoscalar meson (pion) at is, therefore, not due to spontaneous breakdown of chiral symmetry. Analytic calculations in the strong coupling limit and numerical simulations at intermediate couplings show that there exists a region in the phase diagram in which parity-flavor symmetry is spontaneously broken (“parity-broken phase”) [15, 16]. In this picture, the pion is understood as the zero mode of a second-order phase transition that takes place along the line, signaling spontaneous breakdown of parity-flavor symmetry.
At zero temperature, the parity-broken phase extends from the strong coupling region towards the weak coupling region, forming sharp cusps which touch the weak coupling limit at and at four other values of . In the present work, we concentrate on the branch of the parity-broken phase with the smallest positive values of . The lower boundary of this branch is the usual critical line denoted by in Fig. 2.
For finite temporal size , the cusp of the parity-broken phase retracts from the weak coupling limit to a finite value of . Let us denote the position of the cusp as , and the boundary of the parity-broken phase as . This boundary is double-valued for , whose two branches we denote as .
In the low temperature phase , we expect a massless pion to appear as is increased. Therefore, the lower part of the -line should be located near the zero-temperature critical line , with the difference being . On the other hand, we do not expect a massless pion in the high temperature phase . Hence the whole of -line should be in the low temperature phase. These considerations imply that the -line runs closely past the cusp of the line. Therefore we expect that the the chiral transition point is located near and above the cusp[16]:
| (11) |
with . The possibility that the chiral transition point actually agrees with the cusp is not excluded. For the case of the standard Wilson quark action coupled with the plaquette gauge action, has indeed been found to be close to [16]. Similar results were obtained for the case of the RG-improved gauge action with the standard Wilson quark action [17].
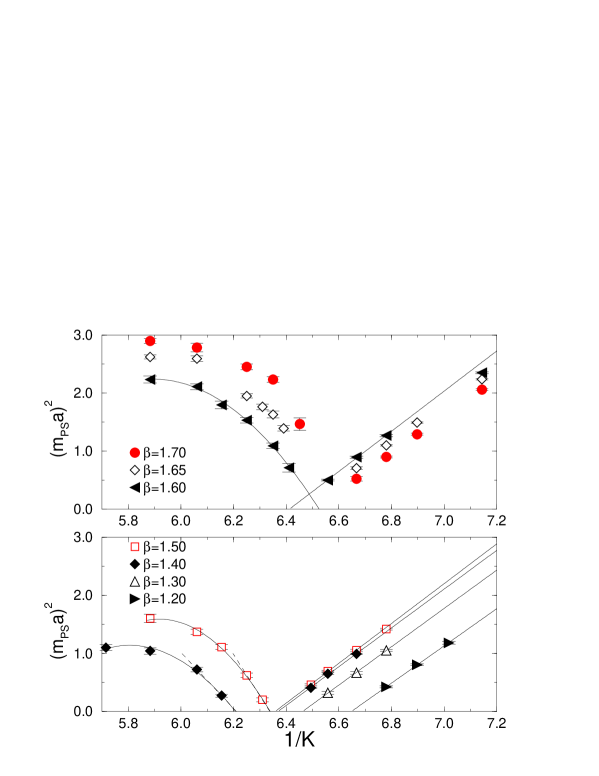
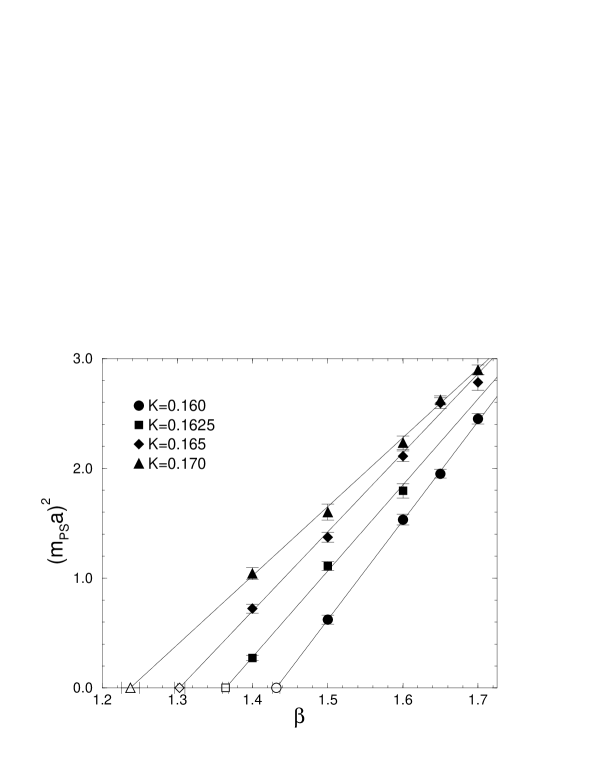
Figure 7 shows results for pion screening mass squared with our action on an lattice. Solid lines are linear or quadratic fits in . In the upper figure showing results for , the two fit lines for , from large or small values of , cross each other. This indicates that remains finite for all values of , and hence the parity-broken phase does not exist for .
In contrast, when we decrease down to 1.5 and 1.4, we see evidence for two values of (lower figure in Fig. 7) corresponding to the upper and lower boundaries of the cusp of the parity-broken phase.
We determine the location of by an extrapolation of linearly in , using the lightest two to three points. We confirm that a quadratic extrapolation gives consistent results. Results of are summarized in Table V. We find the gap between two values of to be
| (12) | |||||
| (13) |
For the upper line, we also try to estimate its location by extrapolating linearly in , at fixed , 0.1625, 0.165, and 0.17, as shown in Fig. 8. Results are listed in Table V. As is seen in Fig. 2, the points for , obtained from the fits and the fits, together form a smooth curve.
An enlargement of the phase diagram around the parity-broken phase is given in Fig. 9. Since the parity-broken phase is absent at the boundaries of the parity-broken phase should terminate at a cusp at –1.6. In order to determine the location of the cusp point more precisely, we fit the upper and lower data separately by a quadratic ansatz. From these fits, we obtain
| (14) |
where the errors are estimated from the crossing points of the one standard deviation error bands of the two fits. From the discussions around (11), this value for gives a lower bound of .
IV O(4) scaling of chiral condensate
From universality arguments, the finite-temperature QCD transition near the chiral limit is expected to be described by an effective model [18]. According to this description, the transition for two quark flavors in the chiral limit is either first order or second order depending on the strength of anomalous coupling which breaks axial U(1) symmetry. When this effect is negligible, the transition is of second order, and one expects that the critical properties are described by those of the three-dimensional O(4) Heisenberg model. Hence tests of O(4) scaling provides us with a useful way to study universality properties of the chiral transition for two-flavor QCD [19].
In the O(4) Heisenberg model, the order parameter is given by the magnetization . Near the second order transition point, satisfies the following scaling relation;
| (15) |
where is the external magnetic field, is the reduced temperature, the exponents have the values and [31], and the O(4) scaling function is also known [32].
In Ref. [11], it was shown that the O(4) scaling of (15) is well satisfied for the standard Wilson quark action combined with the RG-improved gauge action under the identification , , and , where quark mass defined by the axial vector Ward-Takahashi identity was employed. It is important to note that the naive definition of the chiral condensate is not adequate for Wilson-type quarks because chiral symmetry is explicitly broken. A proper subtraction and renormalization are required. A properly subtracted can be defined via an axial Ward-Takahashi identity [28] as first employed in Ref. [11]:
| (16) |
where with the lattice quark field. For the normalization coefficient we adopt the tree value , which is sufficient for our study of critical properties because is regular at the finite temperature transition point.
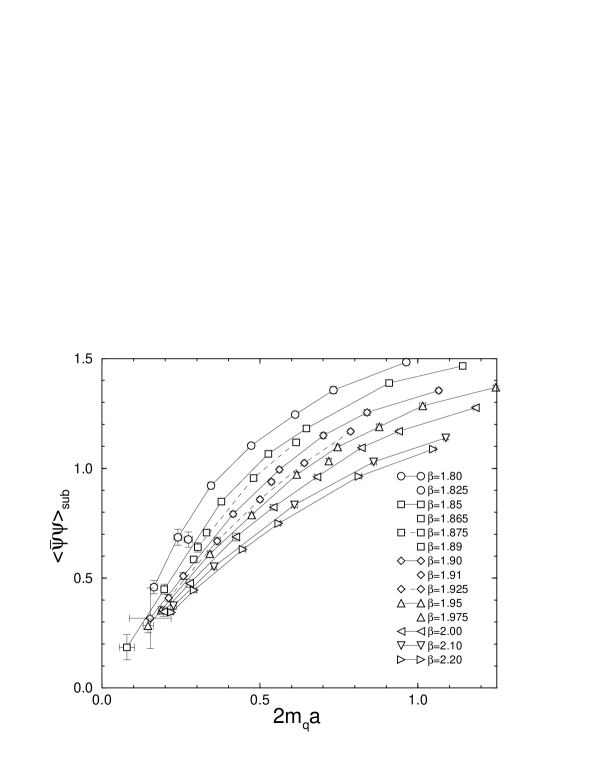
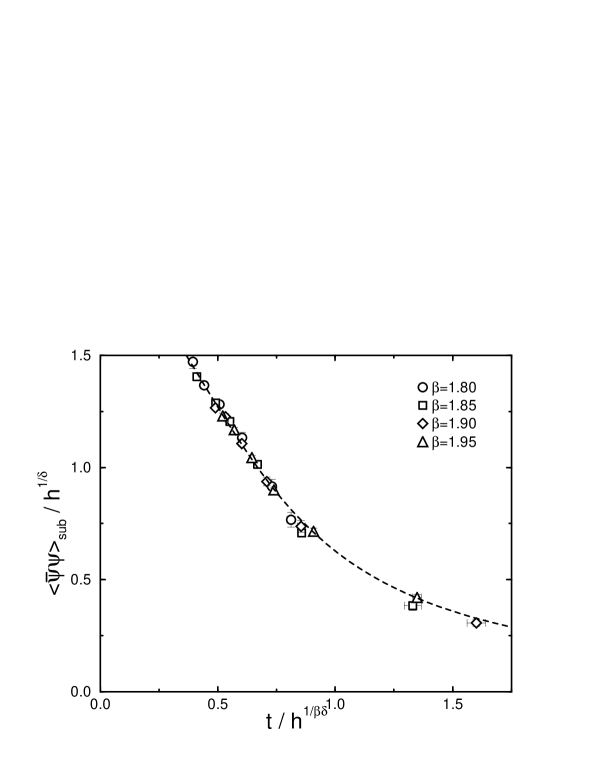
Figure 10 shows the results of as a function of Ward-Takahashi identity quark mass from our action at –2.2 obtained on a lattice. We perform a fit to the O(4) scaling function [32] by adjusting the value of as well as the scales for and , with the exponents fixed to the O(4) values [31]. Since scaling is expected toward the chiral transition point corresponding to massless quark, we start our fit with the entire data set, gradually reducing the range of toward smaller and until an acceptable is obtained. We find this condition to become satisfied for the range –1.95 and –0.9 with for , for which we obtain
| (17) |
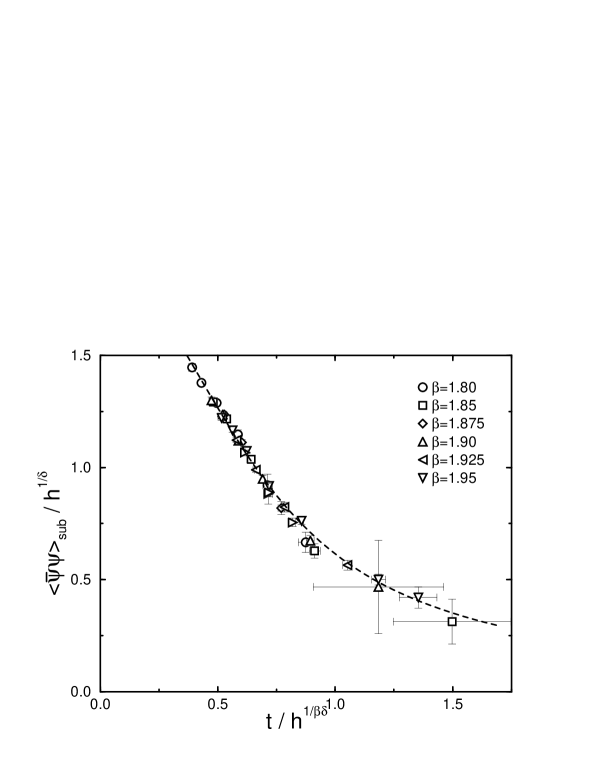
This fit is shown in Fig. 11.
In this test we use results for obtained on the finite-temperature lattice. We repeat the test using determined on the zero temperature lattice, , at the same values of . Results for quark mass extracted on a and a lattice are mutually consistent for the range –1.95 and –0.9. As shown in Fig. 12, we again find a good agreement with the O(4) scaling function with for at
| (18) |
The number of data points are smaller due to fewer simulation points on the lattice.
The good consistency of our condensate data with the O(4) scaling suggests that the chiral phase transition of two-flavor QCD in the continuum limit is of second order. The estimated value for is somewhat low compared to the result for the cusp obtained in Sec. III C. The reason for this trend is not clear at present. A possible origin is lack of condensate data below , closer toward the chiral transition point, in the scaling fit. We leave an examination of this point for future work.
V Scaling of the pseudo-critical transition point
Let us denote by the pseudo-critical point defined as the peak position of the magnetic susceptibility at finite . From the scaling relation (15), we expect
| (19) |
to be satisfied for this quantity. Identifying , where is the -coordinate of the -line, we expect
| (20) |
near the chiral transition point.
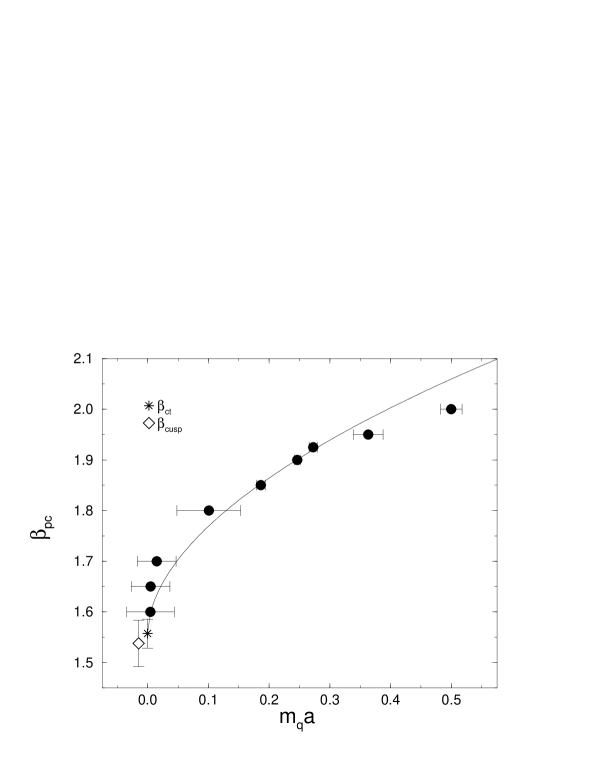
In Fig. 13 we plot the pseudo critical point choosing
| (21) |
i.e., the quark mass defined by the axial vector Ward-Takahashi identity. Errors attached to include the uncertainty in the location of the line for each value of , which actually dominates the error. The precision of our results is not sufficient to attempt a fit taking the exponent as a free parameter. We therefore make a fit adopting the value for this exponent. Taking for the fit range, since this was the range acceptable for the scaling analysis of the chiral condensate, we obtain
| (22) |
with for .
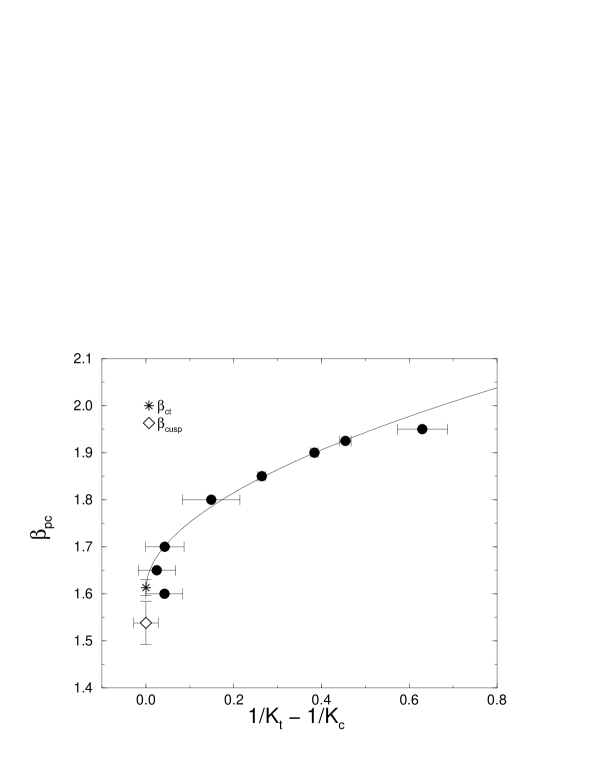
In Fig. 14 we show results of a similar analysis, making an alternative choice,
| (23) |
for the external field. The fit using this identification leads to
| (24) |
for data in the same range with for .
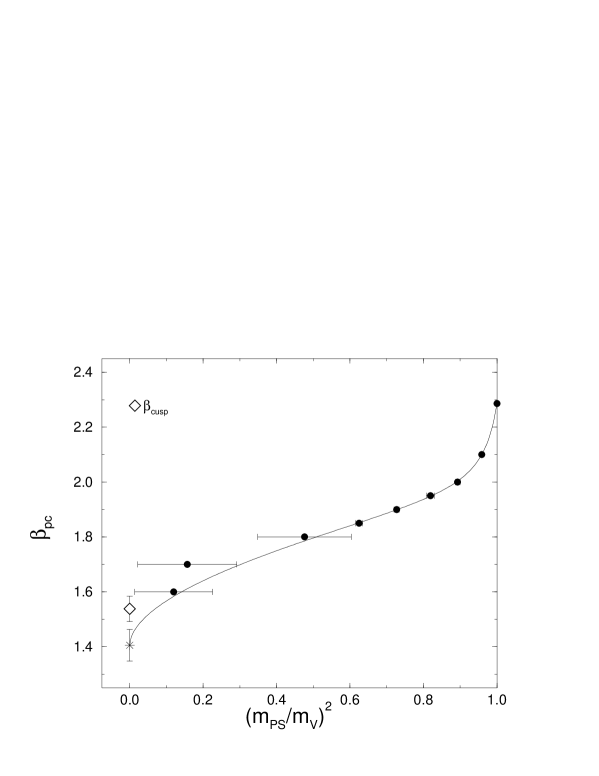
As the third possibility, we consider
| (25) |
obtained on the zero-temperature lattice. This choice has the nice feature that the location of the physical point can be easily identified as . Furthermore the entire range of quark mass from to can be parameterized in a finite interval . Taking advantage of the latter feature, we attempt a global fit including the data in the quenched limit [30, 4]. We find that a Padé-type ansatz extending (19) given by
| (26) |
reproduces our data well, as shown in Fig. 15, with for . The fitted value for the chiral transition point is too low, however, presumably because results toward larger values of including that in the quenched limit , having small errors, dominantly determine the fit.
VI Chiral transition temperature
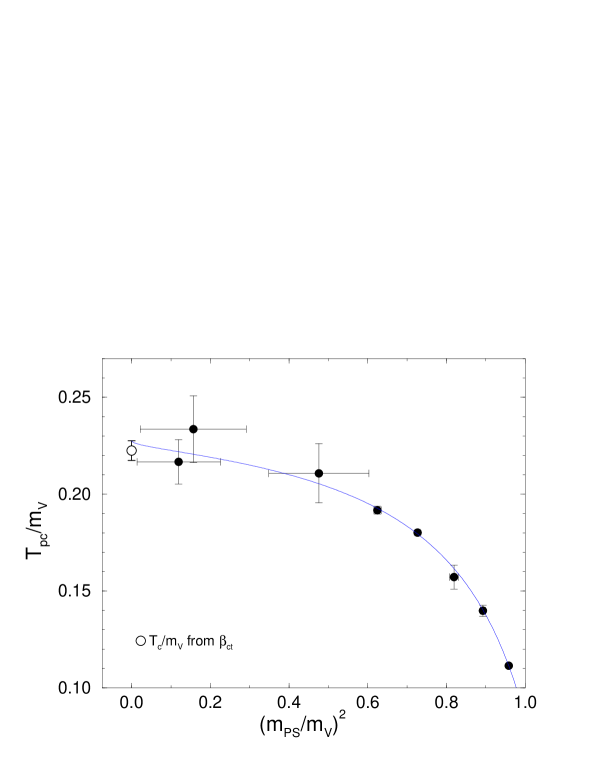
In order to calculate the transition temperature, we evaluate where is the vector meson mass at the transition point evaluated at zero temperature. The results are plotted in Fig. 16 as a function of . We see that the difference in the values of at the chiral transition point where and at the physical point is negligible compared with the current magnitude of errors. Our values of are slightly smaller than those obtained with the standard Wilson quark action on lattices, and consistent with the results from other improved actions [1].
To estimate the transition temperature in the chiral limit, we interpolate the vector meson mass along the zero-temperature critical line to . For the numerical value of we take the result (22) based on O(4) scaling of the line in terms of the Ward-Takahashi identity quark mass. This gives
| (27) |
which is plotted by open circle in Fig. 16. Converting to physical units, we obtain
| (28) |
The solid line drawn in Fig. 16 is a guide to the eyes, representing a global fit of the data to a Padé type ansatz (26), with replaced by and employing the O(4) values for the exponents.
VII Conclusions
We have studied the phase structure and the nature of the chiral transition in two-flavor QCD at finite temperatures using an RG-improved gauge action and a clover-improved Wilson-type quark action on a lattice with the temporal size . We have identified the boundary of the parity-broken phase and the finite temperature transition line on a two-parameter space of the coupling and the hopping parameter. The chiral transition point is found to be located very close to the cusp point of the parity-broken phase.
A subtracted chiral condensate is shown to satisfy the scaling behavior with the exponents and the scaling function universal to the O(4) Heisenberg model. The quark mass dependence of the transition point is also consistent with the O(4) prediction. These results, in agreement with the previous study of the standard Wilson quark action combined with the RG-improved gauge action [11, 17], indicate that the chiral transition of two-flavor QCD is of second order in the continuum limit.
Assuming the O(4) scaling, we have extrapolated the transition point towards the chiral limit. Fixing the lattice scale in terms of the meson mass, we obtain MeV for the transition temperature.
Acknowledgments
This work is supported in part by Grants-in-Aid of the Ministry of Education (Nos. 09304029, 10640246, 10640248, 10740107, 11640250, 11640294, 11740162, 12014202, 12640253). AAK and TM are supported by the Research for Future Program of JSPS (No. JSPS-RFTF 97P01102). SE, KN, M. Okamoto, and HPS are JSPS Research Fellows.
REFERENCES
- [1] For a recent review, see, F. Karsch, Nucl. Phys. B (Proc. Suppl.) 83-84 (2000) 14.
- [2] T. Blum et al., Phys. Rev. D51 (1995) 5153; C. Bernard et al., Phys. Rev. D55 (1997) 6861.
- [3] For a review and references, see, A. Ukawa, Nucl. Phys. B (Proc. Suppl.) 53 (1997) 106.
- [4] CP-PACS Collaboration, M. Okamoto et al., Phys. Rev. D60 (1999) 094510.
- [5] Y. Iwasaki, Nucl. Phys. B258 (1985) 141; Univ. of Tsukuba report UTHEP-118 (1983), unpublished.
- [6] G. Boyd et al., Nucl. Phys. B469 (1996) 419.
- [7] A preliminary account of our results has been presented in, CP-PACS Collaboration, A. Ali Khan et al., Nucl. Phys. B (Proc. Suppl.) 83-84 (2000) 360.
- [8] J. Engels et al., Phys. Lett. B396 (1997) 210; U. Heller et al., Phys. Rev. D60 (1999) 114502; F. Karsch et al., Phys. Lett. B478 (2000) 447.
- [9] C. Bernard et al., Phys. Rev. D49 (1994) 3574; T. Blum et al., Phys. Rev. D50 (1994) 3377.
- [10] Y. Iwasaki, K. Kanaya, S. Kaya, S. Sakai, and T. Yoshié, Phys. Rev. D54 (1996) 7010.
- [11] Y. Iwasaki, K. Kanaya, S. Kaya, and T. Yoshié, Phys. Rev. Lett. 78 (1997) 179.
- [12] B. Sheikholeslami and R. Wohlert, Nucl. Phys. B259 (1985) 572.
- [13] S. Aoki, A. Ukawa, T. Umemura, unpublished (1995), refered in A. Ukawa, Nucl. Phys. B (Proc. Suppl.) 53 (1997) 106; R.G. Edwards and U.M. Heller, Phys. Lett. B462 (1999) 132.
- [14] C. Bernard et al., Phys. Rev. D56 (1997) 5584.
- [15] S. Aoki, Phys. Rev. D30 (1984) 2653; S. Aoki, Nucl. Phys. B (Proc. Suppl.) 60A (1998) 206.
- [16] S. Aoki, A. Ukawa, T. Umemura, Phys. Rev. Lett. 76 (1996) 873; S. Aoki, T. Kaneda, A. Ukawa, T. Umemura, Nucl. Phys. B(Proc. Suppl) 53 (1997) 438.
- [17] S. Aoki, Y. Iwasaki, K. Kanaya, S. Kaya, A. Ukawa, and T. Yoshié, Nucl. Phys. B (Proc. Suppl.) 63 (1998) 397.
- [18] R. Pisarski and F. Wilczek, Phys. Rev. D29 (1984) 338; F. Wilczek, Int. J. Mod. Phys. A7 (1992) 3911; K. Rajagopal and F. Wilczek, Nucl. Phys. B399 (1993) 395.
- [19] F. Karsch, Phys. Rev. D49 (1994) 3791; F. Karsch and E. Laermann, Phys. Rev. D50 (1994) 6954; A. Berera, Phys. Rev. D50 (1994) 6494.
- [20] S. Aoki et al., Phys. Rev. D57 (1998) 3910.
- [21] E. Laermann, Nucl. Phys. B (Proc. Suppl.) 63 (1998) 114.
- [22] C. Bernard et al., Phys. Rev. D61 (2000) 054503.
- [23] CP-PACS Collaboration, S. Aoki et al., Phys. Rev. D60 (1999) 114508.
- [24] R. Burkhalter for the CP-PACS Collaboration, Nucl. Phys. B (Proc. Suppl.) 73 (1999) 3; CP-PACS Collaboration, S. Aoki et al., Nucl. Phys. B (Proc. Suppl.) 73 (1999) 192, 216; A. Ali Khan et al., Nucl. Phys. B (Proc. Suppl.) 83-84 (2000) 176.
- [25] CP-PACS Collaboration, A. Ali Khan et al., hep-lat/0004010, to be published in Phys. Rev. Lett.
- [26] S. Aoki et al., Nucl. Phys. B540 (1999) 501.
- [27] S. Itoh, Y. Iwasaki, Y. Oyanagi and T. Yoshié, Nucl. Phys. B274 (1986) 33.
- [28] M. Bochicchio, L. Maiani, G. Martinelli, G. Rossi and M. Testa, Nucl. Phys. B262 (1985) 331.
- [29] CP-PACS Collaboration, S. Aoki et al., Phys. Rev. Lett. 84 (2000) 238.
- [30] Y. Iwasaki, K. Kanaya, T. Kaneko and T. Yoshié, Phys. Rev. D56 (1997) 151.
- [31] K. Kanaya and S. Kaya, Phys. Rev. D51 (1995) 2404; P. Buetera and M. Comi, Phys. Rev. B52 (1995) 6185; H.G. Ballesteros, L.A. Fernández, V. Martín-Mayor and A. Muñoz Sudupe, Phys. Lett. B387 (1996) 125.
- [32] D. Toussaint, Phys. Rev. D55 (1997) 362. J. Engels and T. Mendes, hep-lat/9911028.
| traj. | therm. | ||
|---|---|---|---|
| 1.800 | 0.1300–0.1450 | 500–2000 | 200–500 |
| 1.825 | 0.1425 | 1000 | 300 |
| 1.850 | 0.1250–0.1440 | 500–1900 | 200–300 |
| 1.865 | 0.1400 | 2000 | 300 |
| 1.875 | 0.1350–0.1400 | 1580–2000 | 200 |
| 1.890 | 0.1400 | 2200 | 300 |
| 1.900 | 0.1250–0.1425 | 500–2000 | 200–400 |
| 1.910 | 0.1350 | 2100 | 300 |
| 1.925 | 0.1300–0.1400 | 1000–2000 | 200–300 |
| 1.950 | 0.1200–0.1410 | 500–2000 | 200 |
| 1.975 | 0.1300 | 1000 | 200 |
| 2.000 | 0.1150–0.1390 | 500–2000 | 200–300 |
| 2.100 | 0.0900–0.1375 | 500–1000 | 200–900 |
| 2.200 | 0.0700–0.1365 | 500 | 200 |
| traj. | therm. | ||
|---|---|---|---|
| 1.80 | 0.1300–0.1450 | 200 | 200–500 |
| 1.85 | 0.1250–0.1440 | 200–300 | 100–300 |
| 1.90 | 0.1250–0.1425 | 200 | 200–400 |
| 1.95 | 0.1200–0.1410 | 200–300 | 100–400 |
| 2.00 | 0.1150–0.1390 | 200–300 | 100–200 |
| 2.10 | 0.0900–0.1375 | 300 | 200–550 |
| 2.20 | 0.0700–0.1365 | 200–300 | 100–200 |
| 2.25 | 0.1300–0.1360 | 250 |
| traj. | therm. | ||
|---|---|---|---|
| 1.20 | 0.1425–0.1475 | 118–120 | 70–72 |
| 1.30 | 0.1475–0.1525 | 118–120 | 70–104 |
| 1.40 | 0.1500–0.1540 | 120–180 | 110–280 |
| 1.40 | 0.1625–0.1750 | 84–100 | 36–80 |
| 1.50 | 0.1475–0.1540 | 100–120 | 70 |
| 1.50 | 0.1585–0.1700 | 88–100 | 50–90 |
| 1.60 | 0.1400–0.1525 | 250–300 | 75–510 |
| 1.60 | 0.1560–0.1700 | 92–500 | 50–300 |
| 1.65 | 0.1400–0.1500 | 300–500 | 200–460 |
| 1.65 | 0.1565–0.1700 | 250–500 | 100–400 |
| 1.70 | 0.1400–0.1500 | 250–300 | 150–300 |
| 1.70 | 0.1545–0.1700 | 250 | 80–240 |
| traj. | therm. | ||
|---|---|---|---|
| 1.30 | 0.1375–0.1500 | 120 | 55–70 |
| 1.40 | 0.1400–0.1525 | 90–120 | 50–70 |
| 1.50 | 0.1375–0.1525 | 90–120 | 50–80 |
| 1.60 | 0.1370–0.1510 | 700–1240 | 50–150 |
| 1.70 | 0.1340–0.1510 | 120–1275 | 150 |
| [GeV] | ||||
|---|---|---|---|---|
| 1.20 | 0.15044(20) | |||
| 1.238(12) | 0.17000 | |||
| 1.30 | 0.563(21) | 0.154082(56) | 0.15475(25) | |
| 1.303(07) | 0.16500 | |||
| 1.364(04) | 0.16250 | |||
| 1.40 | 0.606(31) | 0.156308(62) | 0.15702(15) | 0.16103(26) |
| 1.432(05) | 0.16000 | |||
| 1.50 | 0.658(11) | 0.156641(58) | 0.15730(22) | 0.15780(21) |
| 1.60 | 0.707(10) | 0.155259(31) | ||
| 1.70 | 0.780(10) | 0.151987(22) | ||
| 1.80(*) | 0.995(19) | 0.147678(15) | ||
| 1.85 | 1.033(29) | 0.145526(58) | ||
| 1.90 | 1.207(36) | 0.143737(48) | ||
| 1.95(*) | 1.331(23) | 0.142072(14) | ||
| 2.00 | 1.445(33) | 0.140811(55) | ||
| 2.10(*) | 1.851(58) | 0.139020(21) | ||
| 2.20(*) | 2.42(14) | 0.137658(53) | ||
| 2.25 | 2.40(24) | 0.137225(92) |
| 1.600 | 0.1543(10) | 0.346(153) | 0.217(11) |
| 1.650 | 0.1533(10) | ||
| 1.700 | 0.1510(10) | 0.396(170) | 0.234(17) |
| 1.800 | 0.1445(14) | 0.690(92) | 0.211(15) |
| 1.850 | 0.14019(18) | 0.7905(60) | 0.1917(20) |
| 1.900 | 0.13621(15) | 0.8525(39) | 0.1801(12) |
| 1.925 | 0.13417(23) | ||
| 1.950 | 0.13040(97) | 0.9051(64) | 0.1572(62) |
| 2.000 | 0.12371(73) | 0.9450(36) | 0.1398(29) |
| 2.100 | 0.10921(43) | 0.9790(13) | 0.1114(09) |