Search for Neutrino Oscillations at the Palo Verde Nuclear Reactors
Abstract
We report on the initial results from a measurement of the anti-neutrino flux and spectrum at a distance of about 800 m from the three reactors of the Palo Verde Nuclear Generating Station using a segmented gadolinium-loaded scintillation detector. We find that the anti-neutrino flux agrees with that predicted in the absence of oscillations excluding at 90% CL oscillations with eV2 for maximal mixing and for large .
pacs:
PACS 13.15.+g, 14.60.Lm, 14.60.PqNuclear reactors have been used as intense sources of in experiments searching for neutrino oscillations [1]. These experiments usually detect by the process , where the cross-section-weighted energy spectrum of , peaking at about 4 MeV, can be deduced from the measured spectrum. Any flux deficit or distortions of the energy spectrum would indicate oscillations. The low energy of reactor allows these experiments to reach very small mass parameters, albeit with modest mixing-angle sensitivity. Past experiments [2] with detectors at 50-100 m from a reactor have explored the mass-parameter range down to . The work described here, and a similar experiment elsewhere [3], are the first long baseline (1 km) searches, designed to explore the parameter range down to as suggested by the early Kamiokande atmospheric neutrino anomaly [4]. Although later results from Super-Kamiokande [5] (appeared while this work was in progress) seem to disfavor the channel, a direct experimental exploration amply motivated this work.
The Palo Verde neutrino oscillation experiment is located at the Palo Verde Nuclear Generating Station near Phoenix, Arizona. The total thermal power from three identical pressurized water reactors is 11.6 GW. Two of the reactors are 890 m from the detector, while the third is at 750 m. Our detector is placed in a shallow underground site (32 mwe overburden), thus eliminating the hadronic component of cosmic radiation and reducing the muon flux by a factor of . The fiducial mass, segmented to reject the remaining background, consists of 11.3 tons of 0.1% Gd-loaded liquid scintillator contained in a array of 9 m-long acrylic cells, as shown in Fig. 1. Each cell is viewed by two 5-inch photomultiplier tubes, one at each end. A is identified by space- and time-correlated and n signals.
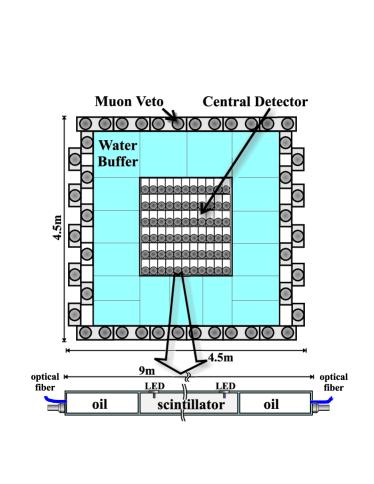
Positrons deposit their energies in the scintillator and annihilate, yielding two 511 keV ’s, giving a triple coincidence. Neutrons thermalize and are captured in Gd, giving a -ray shower of 8 MeV total energy.
The Gd loading of the scintillator has two advantages: it reduces the neutron capture time from 170 s (on protons) to 30 s and provides a high energy shower to tag the neutron capture, resulting in a substantial background reduction. Both the positron and the neutron are triggered by a triple coincidence requiring at least one cell above a “high” threshold set at about 600 keV (positron ionization or neutron shower core), and two cells above a “low” threshold set at about 40 keV (Compton scattering from annihilation photons or neutron shower tails). The triple coincidences are required to be within a matrix anywhere in the detector.
The central detector is surrounded by a 1 m water shield to moderate background neutrons produced by muons outside the detector and to absorb ’s from the laboratory walls. Outside the water tanks are 32 large liquid scintillator counters and two end-caps to veto cosmic muons. The rate of cosmic muons is approximately 2 kHz. The pattern of muons traveling through veto chambers and their timing relative to the central detector hits are recorded for subsequent off-line analysis. The central detector is equipped with a system of tubes that allows the insertion of calibration sources in the small spaces between cells. In addition, a set of blue LEDs and optical fibers can produce flashes of light inside each of the cells. In order to reduce natural radioactivity, all building materials for the detector are carefully selected, including the aggregate (marble) used in the concrete of the underground laboratory.
The detector geometry, materials and electromagnetic interactions are simulated using the package GEANT. Hadronic interactions are described by FLUKA and the low energy neutron transport is simulated by GCALOR. The inclusive gamma spectrum from neutron capture on Gd is specially modeled according to measurements [6]. Light quenching effects are also included [7].
Since the ultimate sensitivity of the experiment relies on a disappearance measurement, precise knowledge of the detector efficiency and of the expected flux from the reactors is essential.
The efficiency calibration is based upon a primary measurement performed a few times per year with a calibrated 22Na source and an Am-Be neutron source. The 22Na source is placed in the calibration pipes and mimics the effects of the positron from the interaction by providing annihilation radiation and a 1.275 MeV photon which simulates the e+ ionization in the scintillator. The source is placed at 18 positions in the detector deemed to be representative of different conditions. The neutron detection efficiency is measured by scanning the detector with the Am-Be source where the 4.4 MeV associated with the neutron emission is tagged with a miniaturized NaI(Tl) counter.
Other calibrations, used to measure the detector energy response, are performed using the Compton edges from 137Cs, 65Zn and 228Th sources. The same Th source is also used more frequently to track the scintillator transparency. Weekly runs of the fiber-optic and LED flasher systems are used, respectively, to monitor the gain and linearity of photomultipliers and the timing/position relationship along the cells.
Since the energy deposition of the 511 keV ’s in one cell has a sharp falling spectrum (Compton scattering) it is vital to have the lowest possible “low” thresholds in the trigger and to understand the behavior of such thresholds with great accuracy. This second task is complicated by the fact that the trigger uses voltage amplitudes, while only charge from integrating ADCs is available off-line. For this reason our detector simulation includes a detailed description of the signal development in time. This code correctly describes the shape of pulses taking into account scintillator light yield, attenuation length and de-excitation time; photomultiplier rise- and fall-time and gain; and event position along a cell. The simulation of the detector response to the 22Na source correctly describes the 40 keV (600 keV) threshold position to within 1.4 keV (2.6 keV), resulting in an uncertainty on the positron (neutron) efficiency of 4% (3%).
The flux and spectrum from a fission reactor and the cross section are well known [1, 2, 8] and are calculated by tracking the 235U, 238U, 239Pu, and 241Pu fission rates in the three plant reactors, taking into account both power level and fuel age. The uncertainty in the reaction rate is less than 3%.
The data presented here was collected in periods of 67.3 days in 1998 and 134.4 days in 1999. During the 98 (99) data taking one of the far (near) reactors was off for 31.3 (23.4) days. While a detailed description of the data analysis will be reported elsewhere[9], here we will outline the principles of the analysis and the results.
Neutrino candidates were selected by requiring an appropriate pattern of energy to be present in the detector for the positron- and the neutron-like parts of the events. In addition the two sub-events are required to occur closer than about 1 m from each other.
At our depth the background to events consists of two types of events: uncorrelated hits from cosmic-rays and natural radioactivity and correlated ones from cosmic-muon-induced neutrons. The first type can be measured by studying the time difference between positron-like and neutron-like parts of an event. By requiring that the time lapse between the two sub-events be , the uncorrelated background is reduced to events d-1 ( events d-1) for 1998 (1999), as measured from a fit to the capture exponential and a constant.
The distribution of time intervals between a cosmic-ray crossing the detector and a -like event carries information on the correlated background. From an exponential fit we infer that the majority of correlated background is produced by pairs of neutrons, where the capture of the first neutron in each pair mimics the positron signature. The requirement that no cosmic-ray hits be present in a window of s preceding the candidate completes the event selection. While the detector efficiency, , is dependent upon the neutrino energy, the efficiency integrated over the neutrino spectrum produced by the reactor (i.e. in the case of no oscillation) is () for 1998 (1999) (the higher efficiency in 99 is due to improvements in the data acquisition dead-time and trigger efficiency).

The resulting rates of candidates per day in different periods are given in Tab. I. Along with the events this final data set contains the random background mentioned above and a substantial amount of correlated background. Two independent techniques were used to estimate and subtract the background. The most straightforward method (“Method 1”) relies on the changes of the signal when different reactors are turned off. For simplicity we first directly subtract the efficiency-corrected rates for “off” periods from the “on” periods. For 1998 (1999) we compare the efficiency-corrected rates of observed interactions d-1 ( d-1) with the prediction of 63 d-1 (88 d-1). While the uncertainties quoted here are statistical only, we find good agreement with the hypothesis of no oscillations. We can then proceed to add the 1998 and 1999 data sets (which have a different combination of baselines) and obtain a neutrino energy spectrum for the difference “on”-“off”. This spectrum well matches the model for no oscillations as shown in Fig. 2.
In order to test quantitatively the oscillation hypothesis in the plane we perform a -analysis comparing the expected to the measured rates. Information on the reactor neutrino flux, in the form of burn-up dependent fission rates, is computed for every detector run (on average 12 h of data). This analysis effectively unfolds the background from the data using the -flux variation due to reactor power changes and fuel burn-up. At each point of the grid the energy spectrum and the detector efficiency are calculated and used to predict the expected rates , where denotes the different detector runs. We then construct the function:
| (1) |
The is minimized with respect to the background contribution to the candidate neutrino rate and the parameter that accounts for possible global normalization effects. While statistical errors have to be individually applied to each run, the systematic error is treated as a global parameter in the . The contribution of different sources of systematics to is given in the first column of Tab. II. The effect of the selection cuts is estimated by a random sampling of the unity hyper-volume defined by conservative ranges for each of the individual cuts. This technique properly takes into account the possible correlations between cuts. The 90% CL acceptance region is defined in accordance with the procedure in [10] by where describes the fit quality at the current grid point and that of the global best fit determined in the physically allowed parameter space. This procedure clearly prefers a no-oscillation scenario as illustrated in Fig. 3 (curve a). The fit also provides an estimate of the background d-1 ( d-1) for 1998 (1999), and of with a .
| Period | 98 “on” | 98 “off”∗ | 99 “on” | 99 “off”† |
|---|---|---|---|---|
| Duration (d) | 36.0 | 31.3 | 111.0 | 23.4 |
| 0.0746 | 0.0772 | 0.112 | 0.111 | |
| (d-1) | ||||
| (d-1) | ||||
| (d-1) | ||||
| (d-1) | ||||
| (d-1) |
In an independent analysis (“Method 2”) that will be described in detail elsewhere [11] we make use of the intrinsic symmetry of the dominant two-neutron background to cancel most of the background directly from data and compute the remaining components from Monte Carlo simulations. This technique makes the best possible use of the statistical power of all data collected. The rate of candidate events after all cuts can be written as where the contribution of the uncorrelated , two-neutron and other correlated backgrounds are explicitly represented, along with the signal . The dominant background (along with ) is symmetric under exchange of sub-events, so that an event selection with the requirements for the prompt and delayed event parts swapped will result in a rate where and account for the different efficiency for selecting asymmetric events after the swap.
| Systematic | Method 1 (%) | Method 2 (%) |
|---|---|---|
| e+ efficiency | 4 | 4 |
| n efficiency | 3 | 3 |
| flux prediction | 3 | 3 |
| selection cuts | 8 | 4 |
| estimate | — | 4 |
| Total | 10 | 8 |
We then calculate where the efficiency correction can be estimated from the Monte-Carlo simulation. We find that the processes of -spallation in the laboratory walls and capture of the ’s that are not tagged by the veto counter ()% contribute to , while other backgrounds are negligible. Using Monte-Carlo simulation, we obtain d-1 ( d-1) for -spallation in 1998 (1999); the same figures for -capture are d-1 ( d-1) in 1998 (1999). This represents only a small correction to since is close to 1. While the Monte-Carlo model is accurate for the capture process, in the case of spallation we simulate the broad range of spectral indexes for the n-recoil energy reported in literature [11]. The average between different predictions is then used for while the spread is used as an extra systematic error in the second column of Tab. II. Since no signal is present above 10 MeV, the observed integrated rate above such energy is used as a normalization of the Monte Carlo. The results are shown in the second part of Tab. I for different running periods. Clearly Method 2 is also in agreement with the no-oscillation hypothesis. The excluded region, calculated by comparing the expected and observed rates taking into account the effect of the oscillation parameters on and , is given in Fig. 3 (curve b).

In conclusion, the data from the first period of running from the Palo Verde detector shows no evidence for oscillations. This result, together with the data already reported by Super-Kamiokande [5] and Chooz [3], excludes the channel as being responsible for the atmospheric neutrino anomaly reported by Kamiokande [4]. Data-taking at Palo Verde is scheduled to continue until the summer of 2000.
We would like to thank the Arizona Public Service Company for the generous hospitality at the Palo Verde plant. The important contributions of M. Chen, R. Hertenberger, K. Lou and N. Mascarenhas in the early stages of this project are gratefully acknowledged. We are indebted to J.F. Beacom, B. Barish, R. Canny, A. Godber, J. Hanson, D. Michael, C. Peck, C. Roat, N. Tolich and A. Vital for their help. We also acknowledge the generous financial help from the University of Alabama, Arizona State University, Caltech and Stanford University. Finally our gratitude goes to CERN, DESY, FNAL, LANL, LLNL, SLAC and TJNAF who at different times provided us with parts and equipment for the experiment. This project was supported in part by the US DoE. One of us (J.K.) also received support from the Hungarian OTKA fund.
REFERENCES
- [1] See e.g. F. Boehm and P. Vogel, “Physics of Massive Neutrinos” Cambridge University Press 1992 (2nd ed.).
- [2] G. Zacek et al., Phys. Rev. D34 (1986) 2621 ; B. Achkar et al., Nucl. Phys. B434 (1995) 503.
- [3] M. Apollonio et al., Phys. Lett. B420 (1998) 397; M. Apollonio et al., Phys. Lett. B466 (1999) 415.
- [4] Y. Fukuda et al., Phys. Lett. B335 (1994) 237.
- [5] Y. Fukuda et al., Phys. Rev. Lett. 81 (1998) 1562.
- [6] L.V. Groshev et at., Nucl. Data Tables, A5 (1968) 1.
- [7] R.L. Craun and D.L. Smith, Nucl. Instr. and Meth. 80 (1970) 239.
- [8] P. Vogel and J.F. Beacom, Phys. Rev. D60 (1999) 053003.
- [9] F. Boehm et al., Paper in preparation.
- [10] G.J. Feldman and R.D. Cousins, Phys. Rev. D57 (1998) 3873.
- [11] Y.F. Wang et al., Paper in preparation and refs. therein.