{centering}
The ZEUS Forward Plug Calorimeter with
Lead-Scintillator Plates and WLS Fiber
Readout
The ZEUS FPC Group
A. Bamberger2, S. Böttcher8,13, I. Bohnet3, J.P. Fernández6,12, F. Goebel1, P. Göttlicher1, A. Gabareen8, G. García6,∗, N. Gendner3, R. Graciani1, M. Hauser2,11, D. Horstmann1, M. Inuzuka9, M. Kasemann1,12, B. Löhr1, R. Lewis7, H. Lim5, L. Lindemann1,16, P. Markun2, M. Martínez1, T. Neumann3,14, I.H. Park5, J. del Peso6,15, H. Raach2, A. Savin1, D. Son5, K. Tokushuku4, S. Wölfle2, J. Whitmore7, K. Wick3, G. Wolf1, S. Yamada4, T. Yamashita10, Y. Yamazaki4
1 Deutsches Elektronen-Synchrotron DESY, Hamburg, Germany
2 Fakultät für Physik der Universität Freiburg, Freiburg,
Germany a
3 Hamburg University, I. Institute of Exp. Physics, Hamburg, Germany a
4 Institute of Particle and Nuclear Studies, KEK, Tsukuba, Japan
5 Kyungpook National University, Taegu, Korea b
6 Univer. Autónoma Madrid, Dpto de Física Teórica, Madrid,
Spain c
7 Pennsylvania State University, Dept. of Physics, University Park,
PA, USA d
8 School of Physics, Tel-Aviv University, Tel Aviv, Israel e
9 Tokyo Metropolitan University, Dept. of Physics, Tokyo, Japan f
10 Department of Physics, University of Tokyo, Tokyo, Japan f
11 now at University of Bern, Switzerland
12 now at Fermilab, Batavia, USA
13 now at Nevis Labs., N.Y., USA
14 now at Deutsche Bank, Frankfurt/M, Germany
15 partially supported by Comunidad de Madrid
16 now at SAP, Walldorf, Germany
a supported by the German Federal Ministry for Education and Science,
Research and Technology (BMBF)
b supported by the Korean Ministry of Education and Korea Science and
Engineering Foundation
c supported by the Spanish Ministry of Education and Science
through funds provided by CICYT
d supported by the US National Science Foundation
e supported by the Israeli Science Foundation
f supported by the Japanese Ministry of Education, Science and Culture
∗ Corresponding author. Tel: 49-40-89983752; fax: 49-40-89983092 ;
e-mail: garcia@mail.desy.de
{centering}
A Forward Plug Calorimeter (FPC) for the ZEUS detector at HERA has been built as a shashlik lead-scintillator calorimeter with wave length shifter fiber readout. Before installation it was tested and calibrated using the X5 test beam facility of the SPS accelerator at CERN. Electron, muon and pion beams in the momentum range of 10 to 100 GeV/c were used. Results of these measurements are presented as well as a calibration monitoring system based on a 60Co source.
1 Introduction
The ZEUS [1] collaboration has installed a Forward Plug Calorimeter (FPC) around the beam line (see Fig. 1) to extend the calorimetric coverage in pseudorapidity 111Pseudorapidity is defined as , where stands for the angle between the particle trajectory and the forward proton beam direction. from to . This vastly increases the physics potential for diffraction in deep inelastic scattering. The mass range over which the dissociated photon system can be studied is enhanced by a factor of about two [2].
This document describes the construction and the results of the beam test of the FPC performed at CERN in September 1997 with electrons, muons and pions covering an energy range from 10 to 100 GeV. Prior to this, a prototype corresponding to one half of the electromagnetic section was tested at DESY with electron beams from 1 to 6 GeV [3]. Data from the beam test at DESY will also be presented where appropriate.
2 Description of the detector
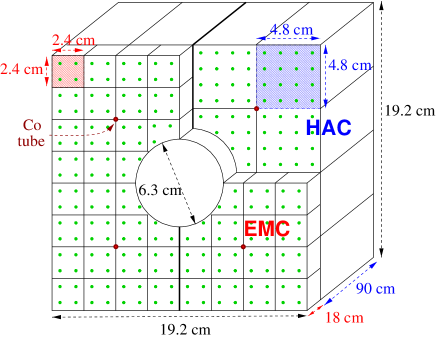
The FPC is a lead-scintillator sandwich calorimeter read out by wave length shifter (WLS) fibers and photomultipliers (PMT). This concept has been investigated in [4, 5, 6]. It has been installed in the cm2 beam hole of the forward uranium-scintillator calorimeter (FCAL) of the ZEUS detector at HERA [1] (see Fig. 1). A front view of the FPC is shown in Fig. 2. The FPC has a 63 mm diameter central hole to accommodate the HERA beampipe.

The active part of the FPC has outer dimensions of mm3. The FPC is mechanically subdivided into two identical half modules. They are attached to the bottom and top half parts of the innermost FCAL module [2]. The FCAL halves and therefore also the FPC halves are moved apart for beam injection in order to reduce the radiation dose on the calorimeters.
In the FPC, lead plates of mm thickness alternate with scintillator layers of mm. The WLS fibers have mm diameter and pass through mm diameter holes in the lead and scintillator layers. The holes are located on a mm step square grid. The FPC has 232 holes of this type. In addition, there are 4 brass tubes (mm inner diameter) which are used to guide a 60Co source, placed on the tip of a long steel wire, for the monitoring of the calibration of the FPC cells. Taking into account the WLS fibers and the fiber holes in the lead plates, the effective lead to plastic ratio by volume is 5.2:1. Based on the results from a lead-scintillator calorimeter of similar composition [7] the FPC is expected to provide equal response to electrons and hadrons (compensating calorimeter, ).
With the layer structure chosen, the FPC has approximately the same radiation length and nuclear absorption length as the FCAL, viz. FPCcm and FCALcm; FPCcm and FCALcm. This minimizes the fluctuations in the energy measurement.
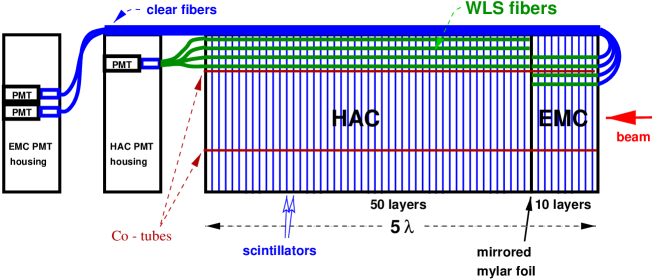
The FPC is subdivided longitudinally into an electromagnetic (EMC) and a hadronic (HAC) section which are read out separately (see Figs. 2 and 3). The electromagnetic section consists of 10 layers of lead and scintillator corresponding to and . The hadronic section of the FPC consists of 50 layers and represents leading to a total for the FPC of (see Table 1).
The scintillator layers consist of tiles and form cells which are read out individually (Fig. 2). The cell cross sections are mm2 in the EMC, commensurate with the Moliere radius, and mm2 in the HAC section. The 8 (4) innermost cells in EMC (HAC) surrounding the beam hole follow the circular shape given by the beam hole.
The polystyrene based scintillator SCSN81T2 from Kuraray was used, since it was found to be the best choice in terms of light yield and radiation stability [8]. The scintillator tiles were wrapped with mm thick tyvek paper in order to improve the light collection efficiency and avoid light coupling between neighboring cells.
The WLS fibers of the EMC are connected to clear fibers (m length) which transport the light to the PMTs placed behind the FPC (see Fig. 3). The clear fibers are bent by at the front of the EMC, and are guided to the PMTs in the rear by two ducts situated on either side of the FPC. The WLS fibers of the HAC section transport the light directly to the PMTs. All 4 (16) fibers corresponding to an EMC (HAC) cell are connected to the same PMT through a light-mixer bar. An additional fiber is connected to each PMT through the same light-mixer bar in order to inject LED and laser light pulses for monitoring the stability of the PMTs and readout electronics. On the other end of the WLS fibers a reflective aluminized mylar foil is placed to avoid light losses (see Fig. 3). The total number of readout channels is (EMC + HAC): 60 + 16 = 76 (see Table 1).
For the WLS fibers the material Y11200(dc) from Kuraray has been chosen. It has a polystyrene core and a double cladding (PMMA and fluorinated PMMA) which produces a substantial increase in light output compared to a single clad fiber. Its absorption spectrum matches best the SCSN81T2 emission spectrum.
The PMT chosen for the FPC is the Hamamatsu R5600U, a tube with metal channel dynodes. It is relatively insensitive to magnetic fields and its small dimensions (mm3) are well suited for the limited space available around the hole of the FCAL. Tests done prior to the beam tests showed that it fulfills well the constraints on dynamic ranges placed by the required FPC performance in the HERA environment [2].
The PMTs are placed in four separate iron blocks whose shape and transverse size is similar to that of the lead plates. The four structures correspond to the EMC and HAC sections of both halves. These blocks are placed behind the hadronic section, first the one containing the HAC PMTs and then that for the EMC (see Fig. 3). The EMC PMTs are arranged in their support frames in such a way that they do not line up with their respective calorimeter cell.
After the installation in ZEUS, the PMTs are connected to a high voltage system based on a Cockroft-Walton generator [9].
| unit layer | mm Pb, mm scint, mm tyvek paper |
|---|---|
| effective thickness of layer | mm Pb, mm plastic |
| transversal dimensions | mm2 |
| EMC section, 10 layers | mm |
| HAC section, 50 layers | mm |
| diameter beam hole | mm |
| number of cells | |
| EMC HAC | 60 16 |
| average density | g/cm3 |
| radiation length () | cm |
| absorption length () | cm |
| Moliere radius | cm |
| total length | mm |
| total weight | kg |
| total radiation length: | |
| EMC HAC | 26.5 133.0 159.5 |
| total absorption length: | |
| EMC HAC | 0.9 4.5 5.4 |
3 CERN setup
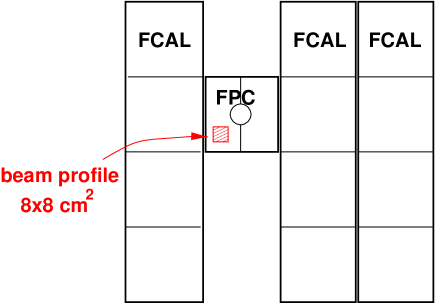
The FPC has been tested in the X5 beam of the CERN SPS. It has been installed between modules of the FCAL prototype, see Fig. 4. These are uranium-scintillator calorimeter units similar to the ones implemented at ZEUS (see [10]). The uranium plates have a thickness of mm and the scintillator layers are mm thick. The FCAL units are divided longitudinally into 3 sections, one electromagnetic, , and 2 hadronic sections, 3 each. The electromagnetic (hadronic) sections are divided transversally into cm2 cells (cm2 cells).
The combined FPC FCAL prototype setup has been placed on a structure, which could be moved in the and directions, in order to vary the impact point of the particle beam at the calorimeter. The beam line defines the -direction.
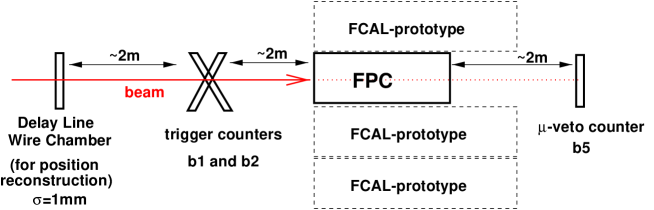
A Delay Line Wire Chamber (DLWC) in front of the FPC has given precise information on the charged particle position (see Fig. 5). The relative position of the FPC detector with respect to the DLWC coordinates has been established to within about one millimeter. Cuts on DLWC coordinates were used in the offline analysis in order to select particles hitting a given region of the detector.
A defocused beam was used to obtain events covering a wide region of the FPC. The trigger was defined by requiring signals in both scintillator counters ( and ) placed in front of the FPC. Behind the FPC an additional counter () was installed mainly for offline identification of muons.
4 Simulation of the FPC measurements performed at CERN
For the analysis of the CERN-test data the FPC has been simulated by Monte Carlo (MC) using the GEANT 3.21 package [11]. The FPC has been implemented as a sampling calorimeter consisting of scintillator and absorber layers. The density of the absorber layers has been reduced in order to account for the tyvek layer and for the holes left for the WLS fibers. The fibers were not included in the simulation. The light attenuation in the WLS fibers has been taken into account according to the measurement described in section 5.4.3. Photostatistics, noise and cross talk have also been included according to measurements results (see section 5.3). In the simulation the FPC has been positioned between FCAL modules as in the CERN-test setup described in the previous section (see also Fig. 4).
The accuracy of the simulated response to electrons and muons has been estimated to be about 3%. For pions the accuracy of the simulated energy signals, which have been determined with the hadronic package GHEISHA [12], is about 10%.
5 Calibration
For the calibration of the FPC the following scheme has been chosen:
-
•
calibration of EMC cells using electron test beam data,
-
•
calibration of HAC section using muon test beam data,
-
•
monitoring of the calibration constants using the response of each FPC channel to irradiation with a 60Co source.
5.1 Calibration of the EMC section
A data set of 60 GeV test beam electrons distributed over the complete FPC surface has been used for the calibration of the EMC cells. The calibration constants have been adjusted such that the mean of the summed signal of all EMC cells is independent of the point of incidence. The absolute calibration has been adjusted to the beam energy. For the edge cells the beam energy is reduced by a correction factor, estimated by MC, taking into account the energy leaking out of the FPC.
5.2 Calibration of the HAC section
Since the energy of pions is not fully contained in the FPC and the amount of leakage is not reliably described by the MC, muons have been used for the calibration of the HAC cells. A Landau function convoluted with a gaussian function, to take into account photostatistics and electronic noise, has been fitted to the muon signals. The calibration constants have been computed in order to adjust the peak value obtained from the fit, to the value predicted by MC. Since the distribution of the muon signals does not have a gaussian shape, it is crucial that it is well described by MC. A good overall agreement is observed for the HAC section after calibrating with muons, see Fig. 6.

In order to measure hadronic energy, the following two corrections have been applied:
-
•
The ratio between the visible and the total energy deposited in the FPC (sampling fraction) is different for an incident pion and an incident muon. Assuming that the FPC is a compensating calorimeter (), the sampling fraction obtained with electrons (see section 5.1) can also be used for pions.
-
•
The effect of the light attenuation in the WLS fibers (see section 5.4.3) is different for muons and pions due to their different longitudinal energy deposition. Whereas muons deposit energy uniformly along the -direction, pions deposit their energy predominantly at the beginning of the HAC region where the effect of the light attenuation is strongest. In order to correct for the effect, the energy scale of the HAC section has been raised by a factor of 1.33.
The accuracy of the absolute calibration thus obtained is estimated to be 5%. The error is dominated by the uncertainty of the MC prediction.
5.3 Cross talk
A cross talk effect has been observed between physically adjacent cells of the FPC in the analysis of the CERN-test data. No cross talk between PMTs or front-end electronic channels has been found. The observed cross talk has therefore been attributed to light being produced in one cell, crossing the tyvek barrier between scintillator tiles and entering the WLS fibers of a neighboring cell. It is known that tyvek is not totally light tight.
The cross talk has been measured using the muon sample. For all pairs of neighboring cells the ratio between the signal of the cell that has been hit and the signal in the adjacent cell has been determined. The mean value of this distribution has been taken as the amount of cross talk.
For light produced in the scintillator of a given cell (denoted as the central cell) the fraction of light that has been collected in this and the adjacent cells is shown in Table 2.
| EMC | HAC | |
|---|---|---|
| central cell | 73% | 81% |
| each of 4 direct neighbors | 5.8% | 4.3% |
| each of 4 diagonal neighbors | 1% | 0.4% |
Note that the method applied to calibrate the EMC (HAC), which has been described in previous sections, is not sensitive to cross talk, since it uses the sum of the signals over all cells.
In order to describe the lateral shower width, the measured cross talk has been implemented in the MC.
5.4 60Co monitoring system
A monitor system using a 60Co source, similar to the one used for the ZEUS uranium calorimeter [13], has been developed for the FPC. It allows the detection of changes in the performance of the scintillator tiles and the WLS fibers as well as drifts in the gain of the PMTs. By measuring the ratio of response to 60Co and beam particles the absolute and cell-to-cell calibration constants can be transported from the test beam to ZEUS and the stability of the calibration can be monitored.
5.4.1 60Co setup
A 1 mCi pointlike 60Co source is attached to the tip of a steel wire. For safety reasons the wire and the source are enclosed inside a stainless-steel tube. This source wire can be inserted into brass tubes of mm inner diameter inside the FPC. The brass tubes run parallel to the WLS fibers at the center of each FPC quarter (see Fig. 2). The 60Co source irradiates the scintillators of the FPC with 1.173 MeV and 1.332 MeV photons (see Fig. 7).
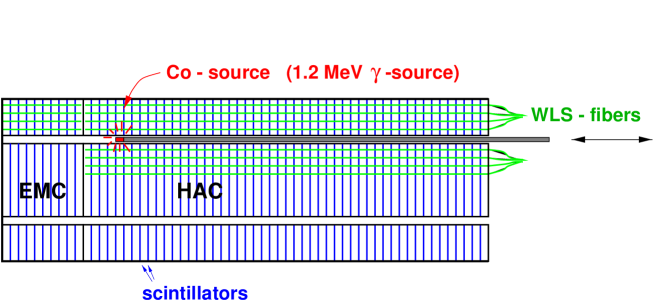
A PC-controlled motor moves the 60Co source wire in steps of mm through the FPC. At each step the PMT currents are read out across 2 M resistors by an integrating, voltage sensitive ADC. The measurement is repeated 500 times and the mean and root mean square (RMS) values are recorded. During a complete scan the source fully traverses the FPC (from EMC to HAC) and the 15 EMC and 4 HAC channels of the corresponding FPC quarter are read out.
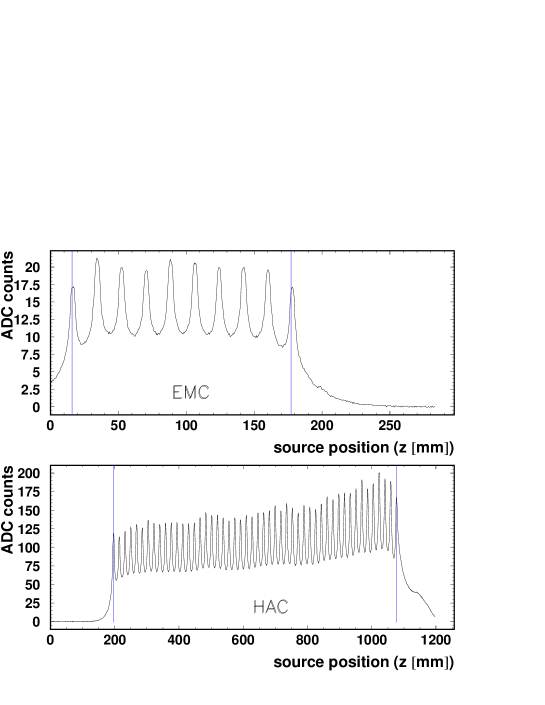
The signal as a function of position is shown in Fig. 8. The 10 (50) peaks in the EMC (HAC) part correspond to positions where the source is next to a scintillator. When the source is inside a lead layer the photons are partially shielded and the signal drops. The point where the source exits the EMC section and enters the HAC section is clearly seen at mm.
The maxima of the signals from the individual scintillator tiles fluctuate. This is assumed to be due to differences in the scintillator-WLS fiber light coupling and to differences in the tyvek wrapping and scintillator machining. The overall increase of the signal in the HAC section with increasing is due to light attenuation in the WLS fibers: the fibers are read out in the direction of positive (see section 5.4.3).
5.4.2 Monitoring of the stability of the signal
In order to study the stability of the FPC response, the signal induced by the 60Co source is integrated between the bounds shown in Fig. 8. The result of the integration is called COMEAN. Figure 9 shows COMEAN for 8 different 60Co scans spanning the time from the CERN-test period in September 1997 until the installation of the FPC in ZEUS and the start of luminosity runs in August 1998.

Up to 10% deviations can be observed after the transportation of the FPC to DESY (05.11.97) and after installation of the FPC into the ZEUS environment (25.04.98).
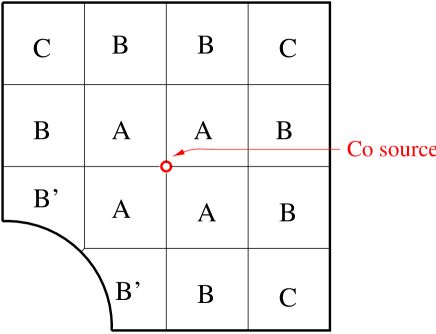
The different signal heights observed for the different cells in Fig. 9 is due to their distances from the cobalt source. The EMC cells can be subdivided into 3 groups (A,B,C) depending on their distance from the 60Co source (see Fig. 10). The distance between the 60Co source and HAC cells is the same for all HAC cells.
5.4.3 Measurement of the light attenuation in WLS fibers
The change of the peak height with the source position in the HAC section (see Fig. 8) allows the measurement of the light attenuation length in the WLS fibers directly. Since the peak height is also influenced by the scintillator quality and the light coupling into the WLS fiber, average peak values of all channels have been used (see Fig. 11).

The data are fitted by using the function:
| (1) |
where cm is the length of the HAC (distance from the reflective mylar foil to the last scintillator layer on the back) and cm is the z-position where the fiber exits the FPC. In Eq. 1 the second exponential accounts for the light reflected at the mylar foil which separates the EMC and HAC sections; , and are free parameters in the fit. The attenuation length measured using this method is cm. The weight of the second exponential function is , which indicates that 80% of the light is reflected by the mylar foil.
6 Effect of WLS fibers on the signal
6.1 Signal uniformity
The uniformity of the response across the surface of a FPC cell is affected by the presence of the WLS fibers. Light produced in scintillator regions close to a WLS fiber is collected with a better efficiency than in other regions as discussed in [5].
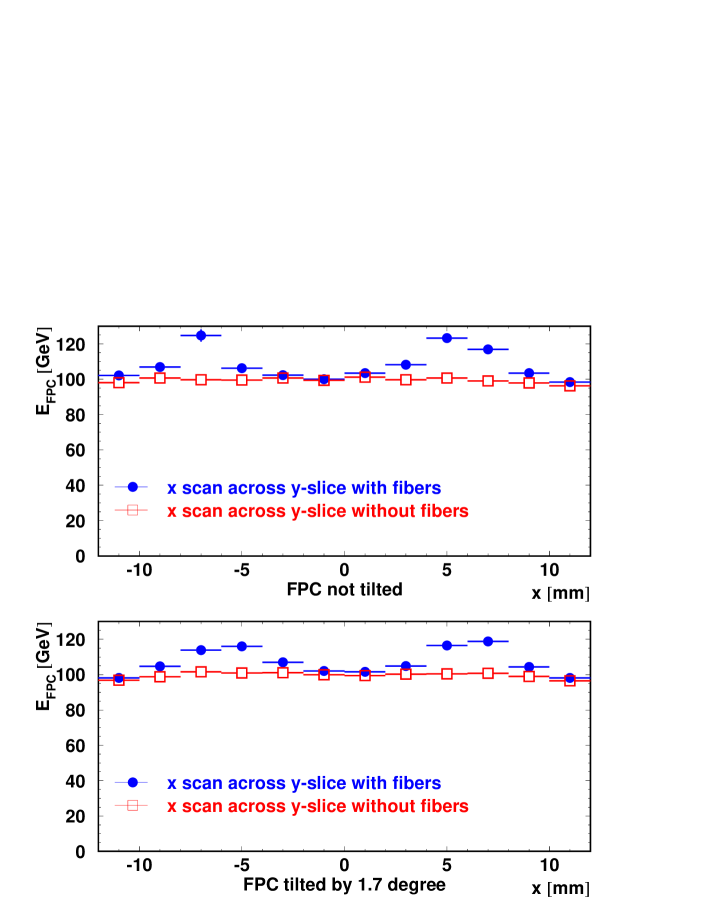
The effect of the enhanced FPC response to particles incident close to a WLS fiber has been studied using high energy electrons for which the energy resolution () is best. In Fig. 12 the FPC response to 100 GeV electrons is shown as a function of the point of incidence. The average response is enhanced by in regions close to the WLS fibers. This effect is reduced for runs where the FPC was tilted by (compare Fig. 12 top and bottom) corresponding to the mean angle of incidence of beam particles coming from the ZEUS interaction point.
6.2 Effect on the energy resolution
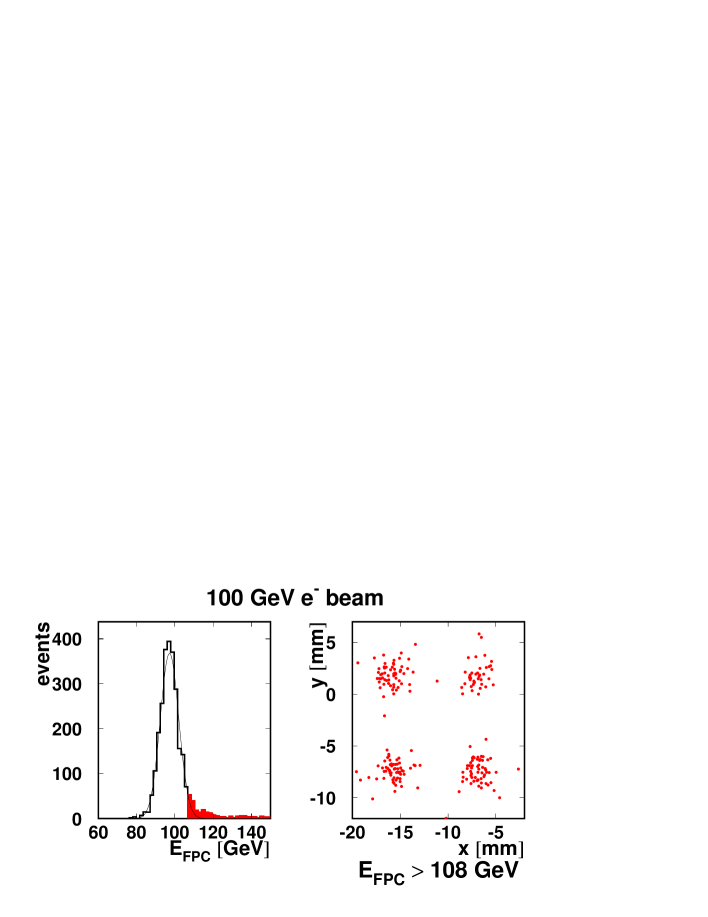
The enhancement of the signal in the fiber regions also affects the energy resolution of the FPC as seen in Fig. 13. The distribution of the total reconstructed energy, , shows a tail to higher energies. Figure 13 right shows the positions of electrons selected from this tail, as measured by the DLWC. These electrons hit the FPC close to one of the four WLS fibers of the cell. The energy resolution obtained using the RMS and the mean value of the distribution () is RMS/, while a resolution of 5% is obtained from a gaussian fit, which is insensitive to the high energy tail.
6.3 Tunneling of electrons into the HAC section
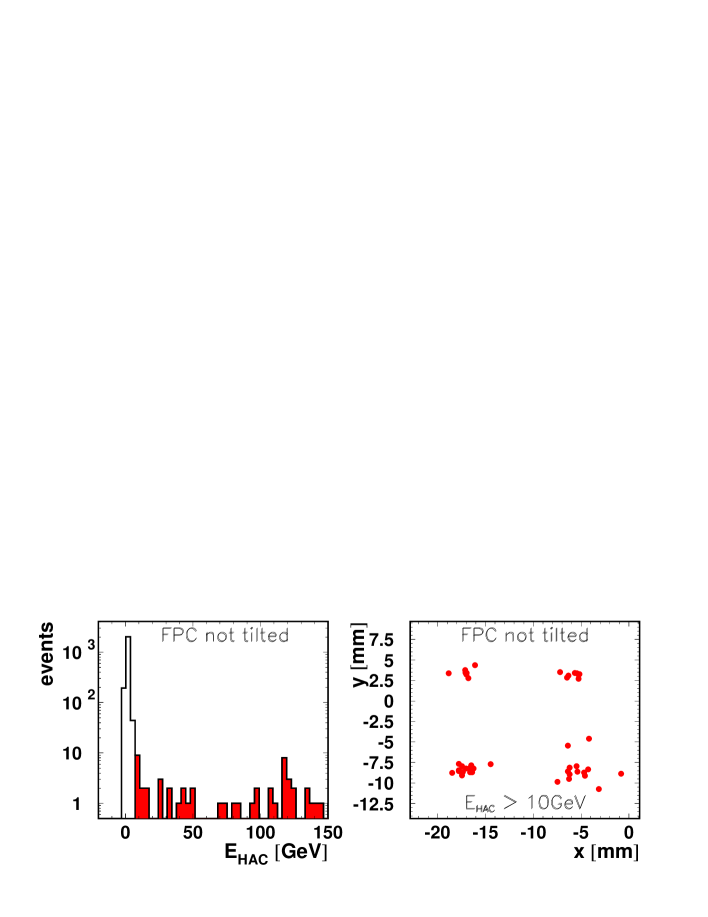
For electrons of less than 100 GeV, more than 99% of their energy is absorbed in an infinitely wide block of 26.6 depth. However, electrons hitting the WLS fibers start to shower much later than those incident on the lead. Since the fibers in the EMC section correspond to only , electrons can traverse the EMC section through the fibers and deposit their energy in the HAC section. For a data sample where electrons are uniformly distributed in the transverse plane, about 2% of the events show more than 10% of the incident energy in the HAC section. These events are also concentrated near the positions of the WLS fibers (see Fig. 14). When the FPC is tilted by this fraction of electrons reduces to 0.3% (see Fig. 15).

7 FPC performance with electrons
7.1 Linearity and energy resolution
For the study of the linearity and energy resolution, electrons incident uniformly on the area of a cell (mm2) have been selected at all available beam energies. The total signal has been obtained by summing the signals from the cluster of EMC cells centered on the cell containing the point of incidence.
Figure 16 shows the pulse height distributions for EMC cells at different beam energies. Gaussian fits have been performed to these distributions. Figure 17 shows the gaussian mean versus beam energy and the differences from a straight line fit. Two different cell clusters are considered, namely: EMC cells and the whole EMC section. About 91% (99%) of the beam energy is observed in the cluster of EMC cells (EMC section). About 1% of the electron energy leaks to the HAC section. The deviations from linearity are found to be 1% or smaller for both cluster definitions.


The ratio RMS to mean of the pulse height distribution is plotted versus the beam energy in Fig. 18. The data are fitted to the quadratic sum of a sampling and a constant term:
where is in GeV. The result of the fit is GeV1/2 and .
The signal enhancement around the WLS fiber region distorts the distribution and broadens the resolution as discussed in section 6.2. This can be demonstrated by selecting only electrons incident on a square of mm2 centered at the cell center. In this way the beam impact point is kept away from WLS fibers. Again, the signal obtained from the sum of EMC cells has been considered. The relative standard deviations, , obtained from gaussian fits are plotted versus the beam energy in Fig. 18. The data are fitted to the quadratic sum of a sampling and a constant term:
where is in GeV, yielding GeV1/2, . By restriction to the mm2 region on the center of the central cell, a substantial improvement is obtained in the resolution, particularly in the constant term , which contains the contribution of non-uniformities.

Lower energy DESY data taken with an FPC prototype are included for comparison. There are mainly two contributions to the measured value : sampling fluctuations and photoelectron fluctuations. According to MC, the expected sampling contribution to the energy resolution is . Therefore the contribution from the photoelectron statistics is estimated as about . The LED data taken in those EMC cells, which have been used for determining the electron energy resolution, show photostatistics fluctuations around , in good agreement with the estimate presented above.
7.2 Position reconstruction
Position reconstruction for incident electrons is done in the following way:
-
•
The electromagnetic cell with the maximum energy signal is searched for. The event is accepted if around this cell a EMC cluster can be defined inside the FPC.
-
•
Once the cluster is selected, a linear algorithm is used to obtain a first approach to the correct position. In the following only the position recontruction along the -direction is shown, but the same results are obtained in the -direction. The formula applied is
where runs over the 9 cells, are the -coordinates of the cells and are the energy signals.
-
•
The resulting , when plotted versus the true -coordinate as given by the DLWC, shows a characteristic S-shape as shown in Fig. 19. After applying a suitable correction to one obtains that, as shown in Fig. 19, gives an unbiased estimate of the true . The correction is of the type
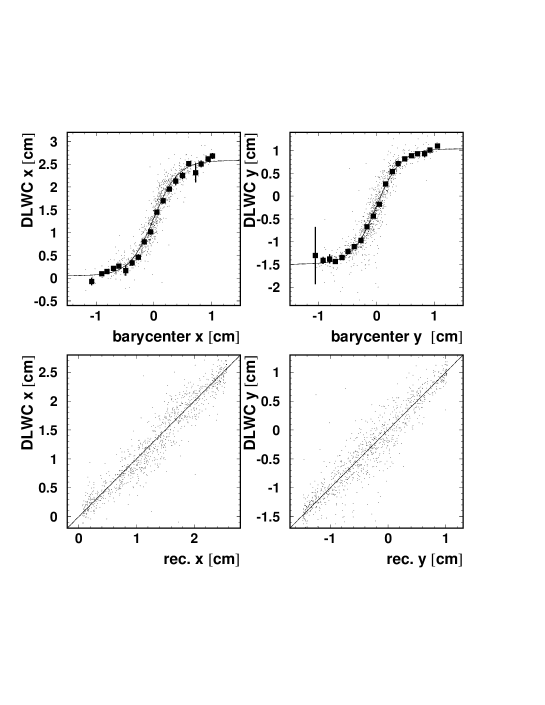
Figure 19: Position reconstruction for 20 GeV electrons before (upper) and after (lower) correcting for the S-shape distortion (see text). The correction applied at this stage is approximately independent of the beam energy, as one could expect from the fact that the shower transverse profile is almost energy independent [14].
The algorithm for electron position reconstruction explained above has been applied to large data samples taken in the CERN and DESY beam tests. The position resolution is obtained from a gaussian fit to the distribution, where . The expected scaling law is observed, as can be seen in Fig. 20 for the -coordinate. The same behavior is seen for . The result of a fit gives:
where is measured in units of GeV.

8 FPC performance with pions
8.1 Energy response
The beam provided by the CERN test beam facility showed a substantial muon contamination. These muons have been rejected from the data sample by applying the following cuts:
-
•
mip
-
•
where is the signal measured in counter (see Fig. 5), 1 mip is the most probable signal deposited by a minimum ionizing particle and is the total energy measured in the FPC.


The signal has been measured with different combinations of the FPC and FCAL prototype modules. The FCAL prototype modules are deep. For this beam test the modules have been calibrated with electrons and muons. Previously, a setup of four FCAL prototype modules had been tested with electrons, muons and hadrons, and the calorimeter was found to be compensating, for momenta GeV to within 3% [10].
Figure 21 top shows the signals measured with the FPC and FCAL prototype as a function of the beam energy. For the FPC alone and FPC+FCAL prototype the measured signal follows closely a linear rise with the beam energy. For FPC+FCAL prototype, the deviations from linearity are 3% (see Fig. 21 bottom).
Energy fractions of about 56% (FPC HAC), 75% (FPC: EMC+HAC) and 93% (FPC + FCAL prototype) are measured at GeV. These fractions change slowly with beam energy.
Signal distributions obtained when combining the signals from FPC and FCAL prototype are shown in Fig. 22 at beam energies between 10 and 100 GeV.

8.2 Energy resolution
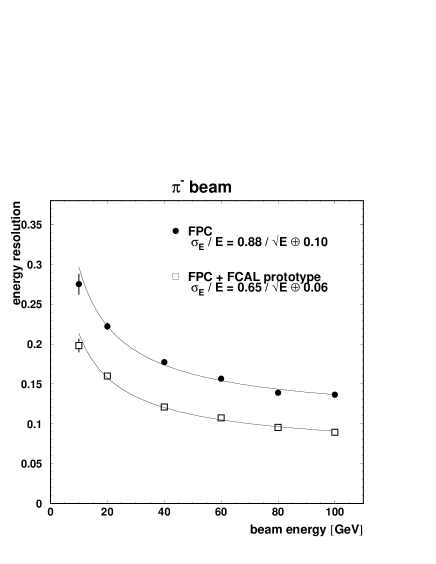
Figure 23 shows the energy resolution for as a function of energy for FPC alone and FPC + FCAL prototype. Each point is the result of a gaussian fit to the corresponding distribution shown in Fig. 22. The curve shows a fit with the parametrization
where is in GeV, yielding: GeV1/2 ; .
The resolution is affected by transverse leakage (see Fig. 4). When installed in ZEUS the FPC is completely surrounded by FCAL modules. As a result there is no transverse leakage except into the beam hole and, according to MC, the energy resolution in ZEUS improves by 20%.
8.3 Position resolution
The position reconstruction for has been studied using three different sets of cells corresponding to the FPC-EMC section, the FPC-HAC section and the combined EMC HAC sections. In the following only the position recontruction along the -direction is shown, but the same results are obtained in the -direction. A barycenter of the cell coordinates is determined as
where runs over all cells considered, is the -coordinate of the center of cell , and are weights defined as
is the energy signal in cell and is the threshold in the quantity corresponding to cell below which the cell is not included in the barycenter calculation.
The relation between the position given by the DLWC () and the measured in the FPC shows a negligible S-shape distortion. This is due to the use of a logarithmic function of the normalized signal to determine the weights . Hence no S-shape correction is needed and the reconstructed position has been obtained by just rescaling the barycenter .
The position resolution is obtained from a gaussian fit to the distribution, where . Figure 24 shows the measured resolution, , as a function of the beam energy. All the cells of the FPC have been used to determine the barycenter. The data are fitted using:
where is in GeV. The result of the fit yields: mmGeV1/2 and mm. When only EMC cells or only HAC cells are used to obtain the barycenter, the resolution degrades as shown in Table 3. For the set of EMC cells, only events which deposit more than 20% of the energy in the EMC section are considered and the RMS is used instead of the sigma from the gaussian fit.
| Cells used | mmGeV | mm |
|---|---|---|
| EMC HAC () | ||
| HAC () | ||
| EMC (, RMS) |

9 Monte Carlo for the ZEUS environment
The FPC has been implemented in the Monte Carlo program MOZART for the simulation of the ZEUS detector response. The program MOZART uses the general purpose packages GEANT 3.13 and GHEISHA modified to describe the test beam data measured with the ZEUS uranium calorimeter modules. In particular, for the ratio and energy resolution of hadrons, discrepancies in the range 20-30% were found between the GEANT 3.13 + GHEISHA prediction and the measurements from the FCAL prototype [15]. To overcome these discrepancies a shower terminator was introduced in the GEANT 3.13 + GHEISHA package, which operates on the evaporation energy of excited nuclei and on neutrons with kinetic energies below 50 MeV [16]. This shower terminator had free parameters which were chosen such that the discrepancies between Monte Carlo prediction and test beam data were below 5%. In addition, and because the package GEANT 3.13 was very time consuming by tracking shower particles in the calorimeter, a new shower terminator was introduced which operates on , and with kinetic energies below 200 MeV [16]. Using both shower terminators in the GEANT 3.13 + GHEISHA package the execution time was reduced by a factor of about 15.
The scheme of shower terminators has also been used to simulate the FPC response in GEANT 3.13 + GHEISHA. Since the FPC and FCAL are different calorimeters, a different set of parameters of the shower terminators has been chosen for the shower particles inside the FPC. In Fig. 25 average energies deposited in the different sections (FPC-EMC, FPC-HAC, FPC and FPC + FCAL prototype) are shown as a function of the beam energy for test beam data and MOZART. Good agreement for all sections is observed. Energy resolutions (from gaussian fits) are plotted in Fig. 26 as a function of the beam energy for data and MOZART. The FPC energy resolution is reasonably well described. When adding the FCAL prototype signal to the FPC signal small discrepancies of the order of 5-10% are found.


10 Conclusions
The Forward Plug Calorimeter (FPC) for the ZEUS detector at the electron-proton collider HERA at DESY, has been tested at DESY and CERN with beams of electrons, muons and pions in the range 1 to 100 GeV in 1997. The results of these tests have been used to determine the calibration of the FPC. The energy and position resolutions, and respectively, measured for both electrons and can be summarized as follows:
| for electrons: | |
|---|---|
| cm | |
| for pions: | |
| cm |
where is measured in units of GeV.
A monitoring system using a 60Co source has been used to transport the calibration constants from the test beam to the ZEUS detector and to monitor the stability of the calibration since its installation in 1998.
Acknowledgements
We would like to thank the staff support from the various Institutes which collaborated in the construction of the FPC and in the setup of the test systems, in particular J. Hauschildt and K. Löffler (DESY), R. Feller, E. Möller and H. Prause (I. Inst. for Exp. Phys., Hamburg), A. Maniatis (II. Inst. for Exp. Phys., Hamburg) and the members of the mechanical workshop of the Faculty of Physics from Freiburg University. We also would like to thank L. Hervás (CERN) for helping us with the readout electronics during the beam test. We are grateful for the Weizmann group, in particular to Prof. Y. Eisenberg, for the support in the early stages of the project. We are grateful for the hospitality of CERN and for the support of the CERN technical staff during the measurements.
References
- [1] ZEUS Collaboration, The ZEUS detector, Status Report 1993; U. Holm ed., DESY PRC 93-05.
- [2] ZEUS Collaboration, A Forward Plug Calorimeter for the ZEUS Detector, DESY-PRC-97-02.
- [3] J.P. Fernández et al., Test of a FPC prototype at DESY, ZEUS-Note 98-068, unpublished.
- [4] H. Fessler et al., Nucl. Instr. and Meth. A240 (1985) 284.
- [5] L. Labarga and E. Ros, Nucl. Instr. and Meth. A249 (1986) 228.
- [6] F.Barreiro, B.Loehr, E.Ros and S.Weissenrieder, Nucl. Instr. and Meth. A257 (1987) 145.
- [7] ZEUS Collaboration, E. Bernardi et al., Nucl. Instr. and Meth. A262 (1987) 229.
- [8] T. Hasegawa et al., Nucl. Instr. and Meth. A311 (1992) 498.
- [9] M.Gospic, H.Groenstege, A remote controlled high voltage supply system for photo-multiplier tubes, ZEUS-Note 96-006, unpublished.
- [10] U. Behrens et al., Nucl. Instr. and Meth. A289 (1990) 115.
- [11] CERN Application Software Group, GEANT 3.21 Detector Description and Simulation Tool, CERN Program Library Long Writeup W5013 (1993).
- [12] H.C. Fesefeldt, Simulation of Hadronic Showers, PITHA 85-02, RWTH Aachen (1985).
- [13] U. Behrens et al., Nucl. Instr. and Meth. A323 (1992) 611.
- [14] J. del Peso and E. Ros, Nucl. Instr. and Meth. A306 (1991) 485.
- [15] G.F. Hartner, Monte Carlo Shower Terminators for ZEUS inside GEANT311, ZEUS-Note 88-49, unpublished.
- [16] Y. Iga, Simulation of the ZEUS calorimeter, DESY 95-005.