Cross section of the reaction
below 1 GeV at CMD-2
Abstract
Using 3.07 of data collected in the energy range 0.60–0.97 GeV by CMD-2, about 150 events of the process have been selected. The energy dependence of the cross section agrees with the assumption of the intermediate state which is dominant above 1 GeV. For the first time events are observed at the meson energy. Under the assumption that all these events come from the meson decay, the value of the cross section at the meson peak corresponds to the following decay width:
or to the branching ratio
1 Introduction
Production of four pions in annihilation is now well studied in the c.m. energy range 1.05 to 2.5 GeV (see [1] and references therein). Much less is known about this process at energies below the meson mass. The first attempts to observe it resulted in detection of single events above 0.96 GeV by Orsay groups [2, 3] while scans of the energy range 0.64 to 1.00 GeV by Novosibirsk groups placed upper limits only [4, 5]. These observations confirmed the predictions that the cross section is very small at these energies [6, 7].
The situation was improved in 1992 when the upgraded high luminosity collider VEPP-2M resumed its operation at the Budker Institute of Nuclear Physics in Novosibirsk [8]. With two modern detectors CMD-2 [9] and SND [10] various high precision measurements in the c.m. energy range from the threshold of hadron production to 1.4 GeV became possible. CMD-2 has recently published results of their analysis of the four pion production above the meson [1]. The large data sample allowed a precise measurement of the energy dependence of the cross section and revealed the intermediate states through which final pions are produced. It was shown that while the reaction proceeds through the and intermediate states, it is the latter which dominates in the channel.
In this paper, we extend the analysis of the process to the c.m. energy range from 0.60 to 0.97 GeV. The high integrated luminosity allowed observation of 153 events and the first measurement of the corresponding cross section at a level as low as several tenths of pb.
2 Experiment and data analysis
The experiment was performed in spring 1998 when the energy range from 0.97 down to 0.60 GeV was scanned with a typical step of 10 MeV outside the and resonances and 1 MeV near the peak of the resonances. To decrease statistical errors, in the final analysis the information from several low energy points was combined. The two first columns of Table 1 present the corresponding energy points (intervals) and integrated luminosities. The total integrated luminosity was .
The general purpose detector CMD-2 has been described in detail elsewhere [9]. It consists of a drift chamber and proportional Z-chamber, both used for the trigger, and both inside a thin (0.4 ) superconducting solenoid with a field of 1 T.
The barrel calorimeter placed outside the solenoid consists of 892 CsI crystals of cm3 size and covers polar angles from to . The energy resolution for photons is about 9% in the energy range from 50 to 600 MeV.
The end-cap calorimeter placed inside the solenoid consists of 680 BGO crystals of cm3 size and covers forward-backward polar angles from 16∘ to 49∘ and from 131∘ to 164∘. The energy and angular resolution are equal to and radians respectively.
The luminosity was determined from the detected events [11].
For the analysis of the reaction events with four charged tracks were selected. The tracks were required to originate from the interaction region:
-
•
the impact parameter of the tracks is less than 0.3 cm
-
•
the vertex coordinate along the beam axis is within cm.
To have good reconstruction efficiency, tracks were also required to cross at least two layers of the drift chamber: .
For the selected events the kinematic fit was performed assuming that all tracks are pions and under the constraint that the sum of the 3-momenta . Further analysis was performed using the normalized “apparent energy”:

Figure 1 shows the distribution of versus the minimum space angle between the tracks with opposite charges . A narrow band with corresponding to events is clearly observed in the region “a”. The region “b” is populated by events from the processes:
| (1) |
and
| (2) | |||||
| (3) |
with the subsequent conversion of the photon into a -pair at the beam pipe.
Events of the process , where the products of the nuclear interaction of the pions scatter back into the drift chamber and induce two “extra” tracks, fall in the region “c”. To suppress the background from this process, the condition was imposed where the parameter of the normalized maximum track momentum was defined as
To reject the background from the reaction (1) in the meson region where the number of observed events is small, the -separation procedure from [12] was employed. The idea of the method is the following. Using reconstructed events of the processes and in the meson energy range, the distributions in the parameter were studied for both particle types () and signs (). Here is the energy deposition in the CsI calorimeter and is the momentum of the particle with a track matching the cluster in CsI. The probability density functions and for the parameter were determined for 50 MeV bins of particle momenta (0–50, 50–100 etc.). Then the probabilities were defined:
for a track to be respectively pion or electron. In the same way the probability was defined:
for the pair of tracks to be pions. Figure 2a shows the distribution in the parameter for the events from the processes (histogram) and (points with errors) in the meson region. As is clear from this Figure, the parameter efficiently separates events with pairs from those with pairs. In our analysis we calculated the parameter for two tracks with the smallest angle between them. Figure 2b demonstrates the distribution in this parameter for the events from the region “a” (in Figure 1) which is dominated by events. We required to suppress the background from the process (1) in the energy range 0.6 to 0.8 GeV. The efficiency of this selection criterion was determined using the events in the energy range 0.81 to 0.97 GeV.

Finally, the selection of events with and provides a practically pure sample of 153 events. The remaining background from the reactions (1), (2) and (3) was estimated using the complete Monte Carlo simulation (MC) of the CMD-2 detector [13] and appeared to be negligible. For example, in the energy range 0.6 to 0.8 GeV the expected number of events from the process (1) is less than 0.2 to be compared to four events observed.
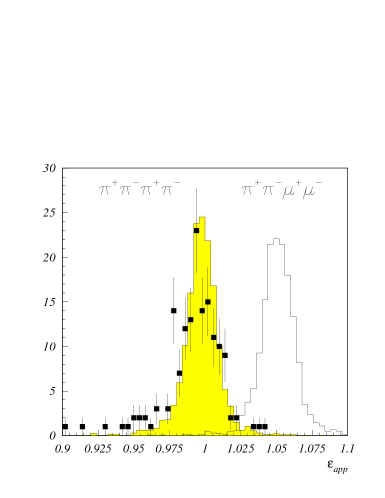
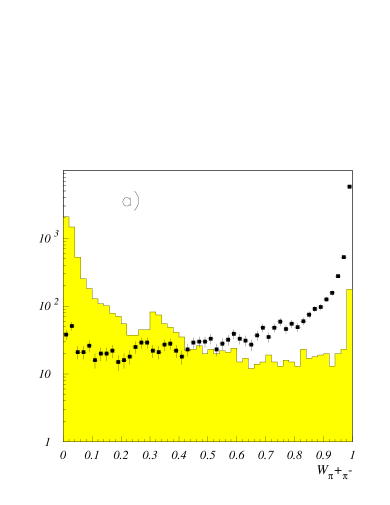
Figure 3 shows the distribution of the selected events in . In this Figure black squares with error bars represent the experimental data while the shaded histogram is simulation of the process . Good resolution in the parameter allows efficient separation even of the exotic final state . The distribution for it is shown by the transparent histogram obtained by the simulation of the process assuming the phase space kinematics of the final particles.
3 Determination of cross sections
The cross section of the process was calculated at each energy using the formula:
| (4) |
where is the number of selected events, is the integrated luminosity, is the detection efficiency, and is the radiative correction at the -th energy point.
The detection efficiency was determined from MC assuming four different quasi-twobody production mechanisms [1]: , , and . In contrast to our observations at the energy above 1.05 GeV [1], in the energy range studied in this experiment the effects of interference between amplitudes differing by permutations of identical pions make the difference between the models smaller. Comparison of various invariant mass and angular distributions predicted by the model with experiment showed that and intermediate states can not well describe the data whereas and are almost indistinguishable in this energy range. For the final calculations the production mechanism which clearly dominates at higher energy [1] has been chosen. The detection efficiency grows with energy varying from 17 to 28 % in the energy range 0.75 to 1.0 GeV. It falls quickly below 0.7 GeV since pion momenta become too small to reach the Z-chamber and produce a trigger.
Radiative corrections were calculated according to [14].
Table 1 gives the summary of the cross section calculations. Since the number of selected events below 0.8 GeV is small, the data from separate points were combined. The values of the cross sections or upper limits were obtained from the following formula:
| (5) |
which takes into account the variation of the luminosity, detection efficiency and radiative correction over the energy interval and gives basically the correct average cross section.
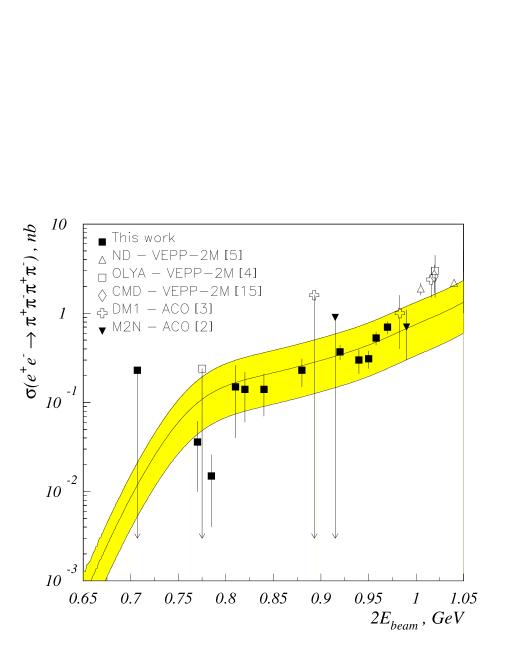
Figure 4 shows the energy dependence of the cross section below 1.05 GeV. Only statistical errors are shown. For illustration, also demonstrated in the Figure are results from other measurements [2, 3, 4, 5, 15]. The values of the cross section obtained in this work are consistent with them and match the measurements of CMD-2 above the meson.
The systematic uncertainty comes from the following sources:
-
•
selection criteria - 10 %
-
•
event reconstruction - 5 %
-
•
detection efficiency dependence on production mechanism - 3%
-
•
luminosity determination - 1.5 %
-
•
radiative corrections - 1 %.
The overall systematic uncertainty was estimated to be .

| , | , | , | |||
|---|---|---|---|---|---|
| GeV | nb | ||||
| 0.6–0.66 | 122.3 | 0 | 0.029 | -0.147 | CL |
| 0.69–0.72 | 103.2 | 0 | 0.115 | -0.157 | CL |
| 0.75–0.78 | 372.8 | 2 | 0.171 | -0.134 | 0.036 0.026 |
| 0.781–0.8 | 818.3 | 2 | 0.181 | -0.133 | 0.015 0.011 |
| 0.81 | 61.3 | 2 | 0.243 | -0.117 | 0.15 0.11 |
| 0.82 | 112.1 | 3 | 0.217 | -0.114 | 0.14 0.08 |
| 0.84 | 133.7 | 4 | 0.238 | -0.113 | 0.14 0.07 |
| 0.88 | 172.1 | 9 | 0.258 | -0.116 | 0.23 0.08 |
| 0.92 | 292.7 | 26 | 0.275 | -0.121 | 0.37 0.07 |
| 0.94 | 140.2 | 10 | 0.275 | -0.124 | 0.30 0.09 |
| 0.95 | 232.0 | 18 | 0.284 | -0.126 | 0.31 0.07 |
| 0.958 | 256.6 | 34 | 0.284 | -0.127 | 0.53 0.09 |
| 0.97 | 256.4 | 43 | 0.276 | -0.130 | 0.70 0.11 |
4 Discussion
The shaded area in Figure 4 corresponds to the extrapolation of the energy dependence of the cross section from the energy region above 1.05 GeV [1]. The calculation assumed that the cross section behaviour is determined by two interfering resonances - and its excitation () decaying into the final four pion state via the intermediate mechanism. The coupling constant was fixed from the width of the decay to . Parameters of the were determined from the fit of the high energy data of CMD-2 [1] and DM2 [19]. The central curve corresponds to the width of 600 MeV optimal in our analysis whereas the upper and lower curves are obtained for the widths of 800 and 400 MeV respectively.
It can be seen that the energy dependence of the present data is consistent with the assumption of the dominance earlier established at higher energies [1].
Figure 5 shows the energy dependence of the cross section in the energy range 0.65–2 GeV. In addition to our results also shown are the cross sections determined by various groups in Frascati, Orsay and Novosibirsk [4, 5, 15, 16, 17, 18, 19, 20, 1]. The dashed and dotted curves show separately the contribution of the and mesons respectively while the solid one is their sum taking into account the interference between them.
It can be seen that at low energies the contribution is much less than that of the (about 2% at 0.8 GeV). However, it quickly grows with energy, reaching the level of 15% already at 1 GeV.
We do not observe the energy dependence characteristic of the resonance with the Breit-Wigner fall of the cross section at the right slope of the meson. Instead, a shoulder can be seen since the resonance behaviour is compensated with the fast growth of the phase space of four pions. To compare the obtained experimental data to existing theoretical predictions, it is useful to evaluate the cross section of the process at the c.m. energy corresponding to the meson mass. To this end the energy range 0.75-0.8 GeV was considered. Using the information about the integrated luminosities in this range and following the same procedure of averaging, the cross section was determined as above. The value of the cross section at the meson mass is () nb. This value can be conventionally presented in terms of the width of the meson decay to .
Using the expression for the cross section of the resonance production at its peak
| (6) |
and the values of M and from [21] one obtains the branching ratio
or for the width
| (7) |
to be compared with the best previous measurement in which an upper limit keV was placed [4].
Attempts to describe the four pion production are known since rather long time. Earlier theoretical models devoted to the calculation of the cross section of , were based upon the natural assumption of the quasi-twobody enhancement of the tail [6, 7]. In most of them the predictions are given for the energy range above 1 GeV, while the cross section falls very rapidly when the energy decreases below this energy. For example, in [7] the cross section of production is calculated assuming , and intermediate states. The is predicted to dominate above 1.05 GeV, while only the mechanism survives at lower energies. The absolute magnitude of the cross section due to the above mechanisms is about 1 pb at 1.05 GeV and much smaller at lower energies, in obvious conflict with our observations. This model also fails to reproduce the cross section at higher energies typically predicting an order of magnitude smaller values than observed. In most of these papers interference effects are not taken into account leading to wrong relations between the probabilities of the final states differing in the number of charged and neutral pions. Another serious defect of all calculations was the lack of the which was unknown at that time and which plays a rather important role at the energies above 1 GeV. Finally, the expressions for the matrix elements contain form factors with unknown energy dependence and their wrong choice can seriously affect the magnitude of the cross section.
While theory fails to explain phenomena far from the threshold, one could expect that in the region of energies close to the meson peak there would be more successful calculations. Various theoretical predictions [22, 23, 24, 25, 26] for the value of are compared to our result in Table 2. Most of them use the low energy effective Lagrangian approach. An estimate based on the broken SUO3 quark model [22] did not incorporate chiral symmetry and was ruled out by the measurement in Ref. [4]. Later attempts to include the meson in the Lagrangian [23, 24] also failed to completely respect the chiral symmetry as noted by the authors of Ref. [25] in which various effective Lagrangians for and (and in some cases ) were suggested. The predictions of Ref. [25] are an order of magnitude smaller than these in [23, 24] and do not contradict our measurement within errors.
| Work | , keV |
|---|---|
| [22] | 172 |
| [23] | 7.5 0.8 |
| 25 3 | |
| 60 7 | |
| [24] | 16 1 |
| [25] | 0.59–1.03 |
| [26] | 0.89 |
| This experiment |
The authors of a recent publication [26] also describe the decay using the chiral Lagrangian (not including the meson) and come to the value of close to that in [25]. In contrast to [25], they consider the cross section rapidly varying with energy as a more adequate characteristics of the process than the decay width and calculate the value of the cross section up to 0.9 GeV. Above 0.8 GeV their predictions for the cross section are well below the measured values. Apparently, the chiral Lagrangian approach fails to describe the dynamics of four-pion production already at these modest energies. The authors of Ref. [26] ascribe the observed discrepancy to the fact that their model neglects higher derivatives and chiral loops. However, from the phenomenological point of view it is clear that the existence of the meson is essential for understanding the observed pattern while chiral theories fail to include excited states. In general, chiral theory seems to produce valid predictions at very low energies only.
As already noted above, thorough analysis of the four pion production above 1.05 GeV allowed to establish the dominance in annihilation [1] and successfully describe a four pion decay mode of the lepton [27, 28]. We could also observe that the extrapolation of the model predictions to lower energies is in good agreement with the experiment even at energies as low as 0.8 GeV.
Better understanding of this energy range could come after a bigger data sample is collected as well as determination of the cross section of the reaction and its combined analysis together with the reaction studied in this work.
5 Conclusions
For the first time the cross section of the process has been measured in the c.m. energy range 0.60-0.97 GeV in which 153 events are observed. The cross section falls rapidly with the energy decrease and does not contradict the model in which final pions are produced via and mesons decaying into .
The cross section value at the peak of the meson corresponds to the following value of its decay width
and its branching ratio
The measurement of the value at the energies below 1 GeV known to give the dominant contribution to the hadronic part of the (g-2)μ [29] is one of the main goals of CMD-2. Results of this work show that we can measure small cross sections even at the level of one tenth of nb and can thus provide the high precision determination of .
6 Acknowledgements
The authors are grateful to N.N.Achasov and Z.K.Silagadze for useful discussions.
References
- [1] R.R.Akhmetshin et al., Preprint Budker INP 98-83, Novosibirsk, 1998, hep-ex/9904024, 1999.
- [2] G.Cosme et al., Phys. Lett. 63B (1976) 349.
- [3] A.Cordier et al., Phys. Lett. 81B (1979) 389.
- [4] L.M.Kurdadze et al., JETP Lett. 47 (1988) 512.
-
[5]
S.I. Dolinsky et al., Phys. Reports 202 (1991) 99;
V.M.Aulchenko et al., Preprint Budker INP 86-106, Novosibirsk, 1986. -
[6]
F.M.Renard, Nuovo Cim. 64 (1969) 679.
G.Kramer, J.L.Uretsky and T.F.Walsh, Phys. Rev. D3 (1971) 719.
M.Vaughn and P.Polito, Lett. Nuovo Cim. 1 (1971) 74.
A.M.Altukhov and I.B.Khriplovich, Sov. J. Nucl. Phys. 14 (1971) 440. - [7] J.Layssac and F.M.Renard, Lett. Nuovo Cim. 1 (1971) 197.
- [8] V.V.Anashin et al., Preprint Budker INP 84-114, Novosibirsk, 1984.
-
[9]
G.A.Aksenov et al., Preprint
Budker INP 85-118, Novosibirsk, 1985.
E.V. Anashkin et al., ICFA Instr. Bulletin 5 (1988) 18. - [10] V.M.Aulchenko et al., Preprint Budker INP 99-16, Novosibirsk, 1999.
- [11] R.R.Akhmetshin et al., Preprint Budker INP 99-11, Novosibirsk, 1999.
- [12] R.R.Akhmetshin et al., Preprint Budker INP 99-97, Novosibirsk, 1999.
- [13] E.V.Anashkin et al., Preprint Budker INP 99–1, Novosibirsk, 1999.
- [14] E.A.Kuraev and V.S.Fadin, Sov. J. Nucl. Phys. 41 (1985) 466.
- [15] L.M.Barkov et al., Sov. J. Nucl. Phys. 47 (1988) 248.
- [16] G.Cosme et al., Nucl. Phys. B152 (1979) 215.
- [17] C.Bacci et al., Phys. Lett. 95B (1980) 139.
- [18] A.Cordier et al., Phys. Lett. 109B (1982) 129.
- [19] D.Bisello, Nucl. Phys. B (Proc. Suppl.) 21 (1991) 111.
- [20] M.N.Achasov et al., Preprint Budker INP 98-65, Novosibirsk, 1998.
- [21] C.Caso et al., Eur. Phys. J. C3 (1998) 1.
- [22] D.Parashar, Phys. Rev. D26 (1982) 1183.
- [23] A.Bramon, A.Grau and G.Pancheri, Phys. Lett. B317 (1993) 190.
- [24] S.I.Eidelman, Z.K.Silagadze and E.A.Kuraev, Phys. Lett. B346 (1995) 186.
- [25] R.S.Plant and M.C.Birse, Phys. Lett. B365 (1996) 292.
- [26] N.N.Achasov and A.A.Kozhevnikov, hep-ph/9911279.
- [27] A.E.Bondar et al., Preprint Budker INP 99-56, Novosibirsk, 1999, hep-ph/9907283, 1999.
- [28] K.W.Edwards et al., hep-ex/9908024, 1999.
- [29] S.Eidelman and F.Jegerlehner, Z. Phys. C67 (1995) 585.