BHAM-HEP/99-08
Precise Electroweak Results from LEP2
D.G. Charlton
Royal Society University Research Fellow
School of Physics and Astronomy
The University of Birmingham
Birmingham B15 2TT, United Kingdom
1 Introduction
The high luminosity delivered by LEP after the doubling of the collision energy means that LEP2 is now providing substantial samples of W bosons with which to make complementary tests of the Standard Model to those of LEP1. This, together with collision energies in excess of 200 GeV, is ensuring that the three central physics goals of the LEP2 programme are properly explored: the precise measurement of the W mass; the measurement of vector-boson self-interactions; and the search for new particles. This review discusses the first two of these objectives: the third is addressed elsewhere in these proceedings [1].
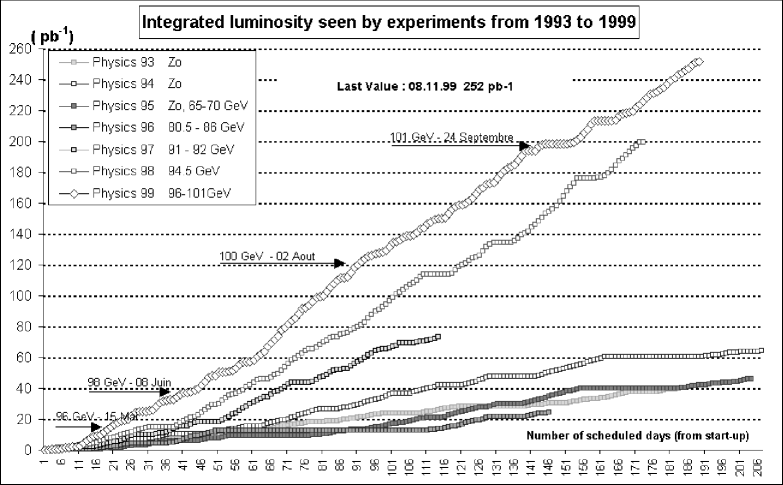
| Centre-of-mass energy (GeV) | 161 | 172 | 183 | 189 | 192 | 196 | 200 | 202 |
|---|---|---|---|---|---|---|---|---|
| Integ. luminosity (pb-1) | 10 | 10 | 55 | 180 | 30 | 80 | 80 | 40 |
| Collection year | 1996 | 1997 | 1998 | — 1999 — | ||||
After a hesitant start of LEP above the W pair production threshold in 1996, subsequent years have seen increasingly large data samples accumulated by the experiments (Table 1). A total of around 480 pb-1 has now been recorded by each experiment at LEP2. This integrated exposure can be expected to pass 650 pb-1 by the time data-taking is completed in the second half of 2000. During 1999, the collision energy has reached, and surpassed111At the time of the conference, the LEP collision energy had just reached 200 GeV. The figures quoted in the text refer to the achievements at the time of writing (November 1999)., its design value of GeV. As illustrated in Figure 1, the machine performance has been better than ever in 1999, in spite of the increased load on the RF system imposed by the higher energies.
This report describes various Standard Model tests made with the first parts of the LEP2 data. Because analyses are in varying stages of completion essentially all results quoted are preliminary. In addition to the measurements made with W pairs, studies of fermion-pair production, QED tests, and Z pair production are reviewed.
2 Fermion-Pair Production
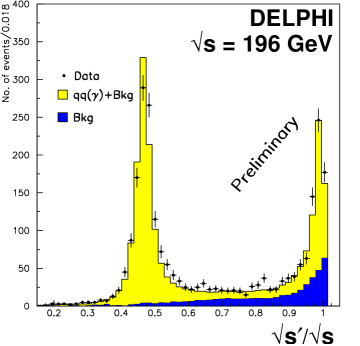
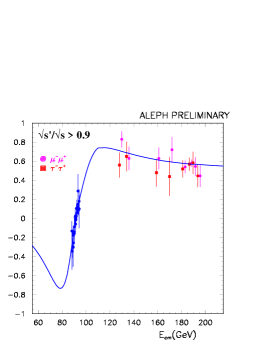
Although two to three orders of magnitudes less than at LEP1 (Figure 3b), the cross-section for fermion-pair production at LEP2 is still high compared to many other processes. The presence of the Z resonance at lower centre-of-mass energies strongly affects the characteristics of events at higher energies, because initial-state photon radiation leads to so-called “radiative return” events where the fermion-pair system has an invariant mass () close to the Z. As a result two typical populations of fermion-pair events are observed, as illustrated in Figure 3a: the radiative return events with , and non-radiative events with . The latter events are of more interest, as they probe the full centre-of-mass energy scale.
a)
 b)
b)
a)
 b)
b)
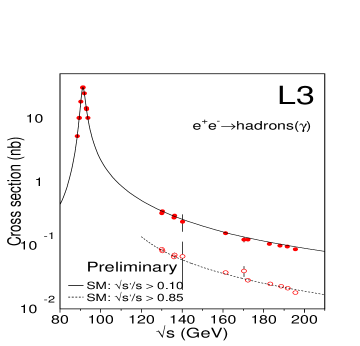
The cross-sections for fermion-pair production have been measured [2, 3, 4, 5] in the hadronic channel (q production), and for , and (the latter dominated by t-channel Bhabha scattering). The Standard Model expectation describes the data well, as shown in Figure 4a for the combined LEP cross-sections.
a)
 b)
b)

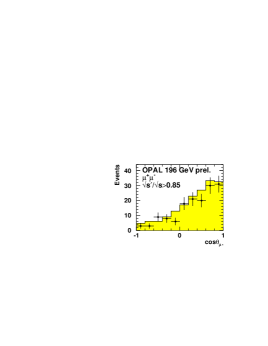
For muon and tau pair production, the easily identifiable lepton charge is further employed to measure the forward-backward asymmetry of the non-radiative events. As shown in Figure 3, the asymmetry for non-radiative events is large at these energies, in contrast to that at LEP1. Again the Standard Model expectation describes the data well – an expanded view of the higher energy LEP-averaged asymmetries is shown in Figure 4b.
In addition to the results presented, measurements have further been made of heavy quark pair production at LEP2 energies [2, 8]. They too are well described by the Standard Model expectation. Constraints on a wide range of new physics scenarios have been placed with the fermion-pair data, ranging from four-fermion contact interactions to electroweak scale quantum gravity [1, 2, 3, 5, 9]. Discussion of these topics is beyond the scope of this report.
3 QED Tests
A few electroweak processes at LEP2 do not have any significant contribution from massive vector boson exchange, and so may be employed to test the adequacy of quantum electrodynamics, QED, at the highest LEP energies.
4 W Pair Production and Decays
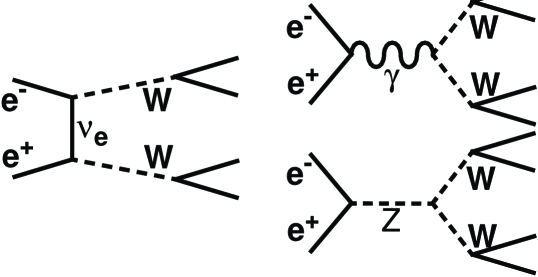
At LEP2, three diagrams contribute to doubly-resonant W pair production, as shown in Figure 5. The neutrino exchange diagram dominates close to the W pair threshold, and in the Standard Model the main effect of the other two diagrams at LEP energies is a negative interference. This is illustrated in Figure 6, where the expected cross-section is shown with the full Standard Model structure, and if one or both of the diagrams with triple vector boson couplings is omitted. The effect of the triple gauge coupling is discussed further in section 6.
| Decay mode | Efficiency | Purity |
|---|---|---|
| 90% | 80% | |
| 82% | 90% | |
| 60-80% | 90% |
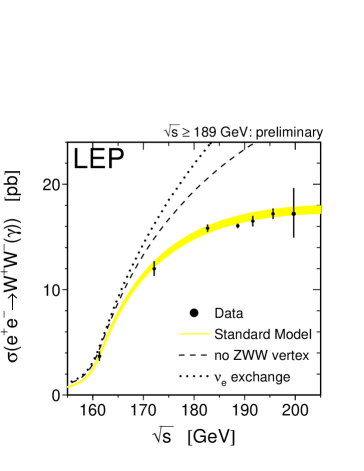
The typical selection efficiencies and purities for W pair events [12] are given in Table 2. The main backgrounds arise from other four-fermion processes, and non-radiative events in the and decay channels, or lepton-pair production and multiperipheral interactions in the channel. The cross-sections measured [12, 6] are shown in Figure 6 for the various LEP2 centre-of-mass energies. The peak cross-section, of around 17 pb, is more than three orders of magnitude less than the Z cross-section at LEP1: consequently even with the high luminosities collected at LEP2 the W pair events number a few thousand per experiment. Nonetheless, precision electroweak measurements can be made.
| Decay mode | Branching ratio (%) |
|---|---|
| W | 10.610.25 |
| W | 10.650.24 |
| W | 10.820.32 |
| W | 10.680.13 |
| W | 67.960.41 |
The branching ratio for W decays via the electron, muon, tau and hadronic modes have been measured by all four experiments [12]. The LEP average results are given in Table 3. The results for the individual leptonic channels are consistent with lepton universality, and the average leptonic branching ratio is also consistent with the Standard Model expectation. The precision of the measurement of B(W ) from LEP is now better than that from colliders.
The leptonic W branching ratio can be re-interpreted [12] in terms of the CKM matrix element without need for a CKM unitarity constraint, using the relatively well-known values of other CKM matrix elements involving light quarks [14]. These indirect constraints currently lead to a value [6] of , much more precise than the value derived from D decays of 1.04 0.16 [14].
5 Measurement of the W Mass and Width
At centre-of-mass energies above the W pair threshold, the technique for measuring the W mass lies in the reconstruction of the directions and energies of the four primary W decay products. These may be either four quarks, approximated by four jet directions and energies, for the channel; or two quarks/jets and a charged lepton for the channel, deducing the neutrino direction and energy from the missing momentum in the event. Decays to are of limited use because at least two neutrinos are undetected. The W decay products are paired up to give reconstructed W mass estimates. A substantial improvement is made in the mass resolution for both and channels by applying a kinematic fit, constraining the total energy and momentum in the event to be that of the known colliding electron-positron system, making a small correction for possible unobserved initial-state radiation.
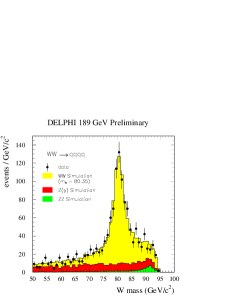
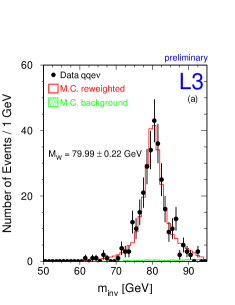
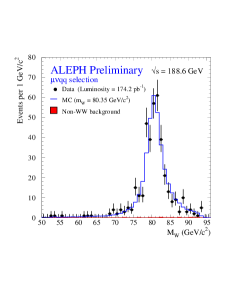
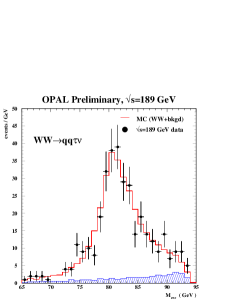
Typical reconstructed mass distributions from the kinematic fit are shown in Figure 7, for the and three channels. Clear W mass peaks are observed, in some cases with very low backgrounds. The W mass is extracted [15, 16] from the measured W masses in each data event using a Monte Carlo technique, the details of which differ from one experiment to another. The Monte Carlo techniques have in common that they use full detector simulations to correct for the effects of finite detector acceptance and resolution, as well as initial-state radiation, and in most cases a reweighting technique is used to model different true W mass values. The results obtained from the fits are given in Table 4, separately for the and channels (in the case of ALEPH, an analysis employing also purely leptonic W decays is included).
| Mass measurement (GeV) | ||
| Experiment | () | |
| ALEPH | 80.5610.121 | 80.3430.098 |
| DELPHI | 80.3670.115 | 80.2970.155 |
| L3 | 80.6560.156 | 80.2240.135 |
| OPAL | 80.3450.134 | 80.6560.156 |
| LEP | 80.4290.089 | 80.3130.063 |
| LEP (161 GeV) | 80.400.22 | |
| Combined | 80.3500.056 | |
For all of these fits, the W width is taken to have its expected Standard Model dependence on the W mass. The results are consistent with each other, and also with the W mass extracted from the measurement of the W pair threshold cross-section at 161 GeV. The overall LEP average W mass measurement obtained is thus [6]:
| (1) |
The LEP W mass measurement is slightly more precise than that from colliders, of GeV [17]. The two measurements have similar precision but use very different techniques, and so are essentially uncorrelated. A substantial improvement is obtained by averaging them [6]:
| (2) |
The width of the W mass distributions shown in Figure 7 has components from the true W width and from detector resolution. In many events the mass resolution is comparable to, or better than, the true width. It is consequently possible to measure directly both the W mass and width, and in practice the two results are little correlated. This has been done by three experiments [16], the combined result currently being:
| (3) |
With the full LEP2 statistics the precision should improve on the current measurement from CDF, of 2.0550.125 GeV [17].
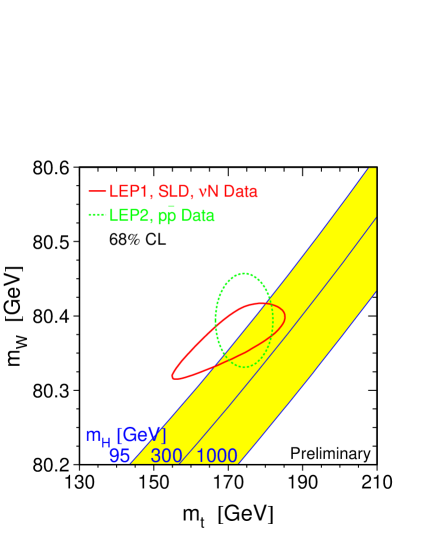
With the current uncertainties, the measurement of the W mass starts to provide an interesting further test of the Standard Model relative to other precision electroweak measurements. This is illustrated in Figure 8 [6]: the predicted W and top masses extracted from fits to lower energy electroweak data are consistent with the direct measurements from LEP and the Tevatron [17], and the precision of the measurements is similar to that of the prediction. From the overlaid curves showing the Standard Model expectation as a function of the Higgs boson mass, it is further evident that both the precise lower energy measurements, and the direct W and top mass measurements taken together, separately favour a Standard Model Higgs boson in the relatively low mass region.
At the time of writing, the LEP W mass analyses are in a stage of detailed review and improvement, as careful systematic studies are needed to match the statistical precision: for this reason the W mass results of all experiments are preliminary. It is not possible to predict with certainty the final W mass error from LEP2, but it is interesting to consider the main error sources, in order to extrapolate to the full data sample. If the present LEP average W mass result is broken down into statistical and systematic components, they are respectively approximately 36 MeV and 43 MeV. This does not mean simply that a systematic limit is being reached, because the analysis is performed in two channels, and , of approximately equal statistical weight but with different systematic error behaviour. In the case the main systematic errors arise from detector calibration uncertainties and Monte Carlo statistics: these are amenable to reduction with more statistics, and are uncorrelated between the different LEP experiments. In neither case do they give a large contribution to the combined LEP error. In the channel, on the other hand, the systematic errors are dominated by contributions from final-state interaction effects such as colour-reconnection [18] and Bose-Einstein correlations [19], and the modelling of backgrounds and fragmentation uncertainties. These error sources are largely correlated between different experiments, and will be relatively difficult to reduce. Consequently, with the full LEP2 data sample the channel analysis should remain statistics limited, but the channel will probably be limited by systematics at some level below the currently estimated error. A realistic expectation for the overall combined W mass error from LEP2 then lies in the region of 30 MeV.
6 Gauge Boson Self-Interactions
a)
 b)
b)
As mentioned in Section 4, W pair production at LEP2 probes the triple gauge boson vertices WW and WWZ. The form and strength of these vertex couplings is unambiguously predicted by the gauge structure of the Standard Model. Possible new physics beyond the Standard Model may additionally bring in extra effective interactions between three gauge bosons without affecting other sectors, mandating a test of this aspect of the theory.
The general lagrangian for the WWV (V= or Z) interaction contains 14 parameters. Constraints of C, P and CP invariance and U(1)em gauge invariance reduce these to five parameters, and constraints from low energy measurements reduce these further to three, conventionally taken to be , and , respectively 1, 1 and 0 in the Standard Model. The LEP experimental analyses are performed in terms of these three variables, or equivalently deviations from their respective Standard Model values.
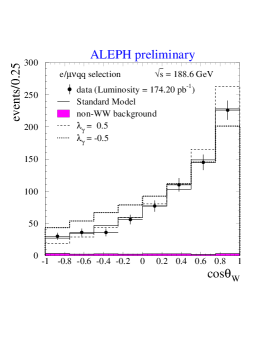
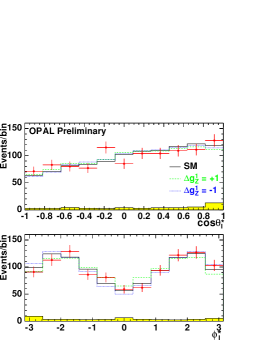
The triple gauge couplings affect the characteristics of W pair production in three ways: the total cross-section changes, as shown in Figure 6, by an amount which increases rapidly with ; the production angular distribution of the W is modified, as shown in Figure 9a; finally, the helicity mixture of the Ws produced at a given is affected. This last effect can be measured experimentally by using the W decay as a polarisation analyser. Typical W decay angle distributions under different coupling hypotheses are shown in Figure 9b.
Values of triple gauge coupling parameters are extracted from the W pair data using the W production and decay angles [20, 21, 22, 23]. This typically employs so-called optimal observables [24] constructed from these angles, which has the advantage of not requiring analysis of a five-dimensional differential distribution. The preliminary results obtained, averaging over all experiments and including also the less sensitive single-W and constraints [21, 25], are [6]:
| (4) | |||||
| (5) | |||||
| (6) |
strikingly well described by the Standard Model predictions of unity, unity and zero, respectively. The results are quoted for the case where only one of the anomalous parameters differs from the Standard Model at a time: fits have also been performed allowing up to three parameters to vary at once: consistent results are obtained.
An alternative perspective on the W-pair production process is provided by analyses which directly measure the relative rates of production of transversely and longitudinally polarised W bosons. A recent analysis along these lines by L3 [26] gives the fraction of longitudinal W polarisation as (24.44.83)% at 189 GeV. Overall, longitudinal W polarisation is established at the five standard deviation level. This contrasts with W production from the process at colliders, where the W is transversely polarised.
Recently a study has been carried out by OPAL [27] of the quartic gauge couplings between WW and WWZ. These couplings are non-zero in the Standard Model, but the effect on the data is tiny for the LEP2 sample. However, constraints have been placed on possible large anomalous values of these parameters using WW production with photon energies above 10 GeV, and also the final-state, where there is sensitivity from the W fusion diagrams. This analysis places the first, albeit weak, direct limits on quartic gauge couplings.
7 Z Pair Production
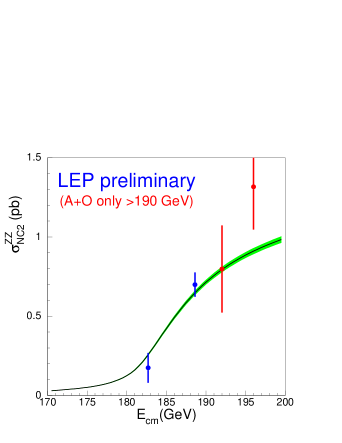
Since 1997, LEP has been running at centre-of-mass energies around and above the Z pair production threshold. Unlike the W case, Z pair production involves no triple gauge coupling diagrams in the Standard Model, but instead simply those with and channel electron exchange. Production is suppressed by factors of at two eeZ vertices, so that the Z pair cross-section is significantly lower than that for W pairs. The measured cross-section [29, 6] is shown in Figure 10, compared to the Standard Model prediction. A particular interest of this process is that it forms an irreducible background to potential Higgs boson production if the Higgs mass were around the Z mass, in cases where one Z decays to b quarks. Figure 10 indicates that ZZ production is well understood.
8 Summary
With the excellent performance of the LEP machine at high energy in the last couple of years, electroweak physics at LEP2 now truly merits the epithet “precise”. The core measurements of the LEP2 programme, the W mass and the vector boson self-couplings, have been made with precision better, in some cases substantially so, than elsewhere. Tests of the Standard Model with other processes serve to confirm the superb description it provides of the data.
Finalisation of the current analyses, and inclusion of the 1999 and 2000 data samples, will provide significant further improvements in precision, although requiring care and attention to the encroaching systematic difficulties. By the time of the next Lepton-Photon meeting, the full fruits of this labour should be harvested.
Much credit is due to the LEP electroweak working group for the preparation of most of the averages and figures presented. The work of this team makes the job of a rapporteur simpler and more enjoyable. For their help during the preparation of this talk, I wish to thank: R. Bailey, R. Clare, J. Ellison, M. Grünewald, R. Hemingway, M. Hildreth, E. Lançon, M. Lancaster, C. Matteuzzi, D. Miller, K. Mönig, D. Plane, A. Straessner, D. Strom, M. Thomson, H. Voss, P. Ward and P. Wells.
References
- [1] V. Ruhlmann-Kleider, these proceedings.
- [2] ALEPH Collaboration, hep-ex/9904011; ALEPH CONF/99-013; ALEPH CONF/99-049.
- [3] DELPHI Collaboration, CERN-EP-99-005; DELPHI 99-135 CONF 322; DELPHI 99-138 CONF 325.
- [4] L3 Collaboration, Phys. Lett. B407, 361 (1997); L3 note 2398; L3 note 2440.
- [5] OPAL Collaboration, hep-ex/9908008; OPAL Physics Note PN415.
- [6] The LEP Collaborations, the LEP Electroweak Working Group and the SLD Heavy Flavour and Electroweak Groups, A Combination of Preliminary Electroweak Measurements and Constraints on the Standard Model, CERN-EP note (in preparation).
- [7] ZFITTER version 6.04, see D.Y. Bardin et al., hep-ph/9908433, and references therein.
-
[8]
DELPHI Collaboration, DELPHI 99-99 CONF 286;
L3 Collaboration, L3 note 2417;
OPAL Collaboration, OPAL Physics Note PN380. -
[9]
ALEPH Collaboration, ALEPH CONF/99-027;
L3 Collaboration, L3 note 2402; L3 note 2418;
OPAL Collaboration, OPAL Physics Note PN372. -
[10]
ALEPH Collaboration, ALEPH CONF/99-025;
DELPHI Collaboration, DELPHI 99-137 CONF 324; DELPHI 99-138 CONF 325;
L3 Collaboration, L3 note 2411;
OPAL Collaboration, Phys. Lett. B465, 303 (1999); OPAL Physics Note PN415. - [11] S.D. Drell, Ann. Phys. 4, 75 (1958).
-
[12]
ALEPH Collaboration, ALEPH CONF/99-038; ALEPH CONF/99-049;
DELPHI Collaboration, DELPHI 99-61 CONF 248; DELPHI 99-64 CONF 251;
L3 Collaboration, L3 note 2376; L3 note 2450;
OPAL Collaboration, Eur. Phys. J. C8, 191 (1999). OPAL Physics Note PN378; OPAL Physics Note PN415. - [13] D. Bardin et al., Comput. Phys. Commun. 104, 161 (1997).
- [14] C. Caso et al., Eur. Phys. J. C3, 1 (1998).
-
[15]
ALEPH Collaboration, ALEPH CONF/99-010; ALEPH CONF/99-012;
DELPHI Collaboration, DELPHI 99-64 CONF 251;
OPAL Collaboration, OPAL Physics Note PN385. -
[16]
L3 Collaboration, L3 note 2377;
OPAL Collaboration, Phys. Lett. B453, 138 (1999); OPAL Physics Note PN385. - [17] M. Lancaster, these proceedings.
-
[18]
ALEPH Collaboration, ALEPH CONF/99-020;
DELPHI Collaboration, DELPHI 99-119 CONF 306;
L3 Collaboration, L3 Note 2406;
OPAL Collaboration, Phys. Lett. B453, 153 (1999); OPAL Physics Note PN412. -
[19]
ALEPH Collaboration, ALEPH CONF/99-036;
L3 Collaboration, L3 Note 2405;
DELPHI Collaboration, DELPHI 99-22 CONF 221;
OPAL Collaboration, OPAL Physics Note PN393. - [20] ALEPH Collaboration, ALEPH CONF/99-046.
- [21] DELPHI Collaboration, DELPHI 99-63 CONF 250.
- [22] L3 Collaboration, L3 note 2378.
- [23] OPAL Collaboration, Eur. Phys. J. C8, 191 (1999); OPAL Physics Note PN375.
-
[24]
M. Davier, L. Duflot, F. Le Diberder and A. Rouge,
Phys. Lett. B306, 411 (1993);
M. Diehl and O. Nachtmann, Z. Phys. C62, 397 (1994). -
[25]
ALEPH Collaboration, ALEPH CONF/99-025, ALEPH CONF/99-028;
L3 Collaboration, L3 note 2367; - [26] L3 Collaboration, L3 note 2441.
- [27] OPAL Collaboration, hep-ex/9910069; OPAL Physics Note PN410.
- [28] S. Jadach, W. Placzek and B.F. Ward, Phys. Rev. D56, 6939 (1997).
-
[29]
ALEPH Collaboration, ALEPH CONF/99-035; ALEPH CONF/99-049;
DELPHI Collaboration, DELPHI 99-69 CONF 256;
L3 Collaboration, L3 note 2413; L3 note 2450;
OPAL Collaboration, OPAL Physics Note PN408; OPAL Physics Note PN415.
Discussion
Howie Haber (UCSC): Could you comment on the maximum energy achievable at LEP?
Charlton: Increasing the energy beyond 200 GeV will be difficult, and it is unclear how the performance will evolve. An absolute maximum is 205-206 GeV, but 202-203 GeV may be more realistic.
Tom Ferbel (University of Rochester): You mentioned the observation of longitudinal W polarization at LEP2. There is also dominant longitudinal W production in top quark decay, and this has been reported by the Tevatron experiments.
Charlton: Yes, that is correct. The significance observed in that case, however, is at a much lower level than that from LEP.
Michael Peskin (SLAC): You quoted a large systematic error for the W mass measurement in WW—50-90 MeV—due to color reconnection and Bose-Einstein effects. Models of color reconnection predict observable manifestations in the final state, and since these are not observed, the constraints should put bounds on these errors. Could you comment on this?
Charlton: Some models of colour-reconnection effects have been excluded by LEP data; however, others will be hard to test even with the full LEP2 statistics. The errors I quoted also have large Monte Carlo statistical components. A final error on the channel from this source of around 30 MeV may be achievable.