Non-compensation of the Barrel Combined Calorimeter Prototype
Y.A. Kulchitsky, M.V. Kuzmin
Institute of Physics, National Academy of Sciences, Minsk, Belarus
& JINR, Dubna, Russia
Abstract
The e/ ratio for the Barrel Combined Calorimeter Prototype, composed from electromagnetic LArg calorimeter and hadronic Tile calorimter was investigated. Response of Combined Calorimeter on pions and electrons in the energy region 20 – 300 GeV was studied. Found is in good agreement with results from previous Combined Calorimeter test but has more precisions.
1 Introduction
ATLAS project [1] represents a general-purpose detector to investigate pp collisions in the energy region up to 14 TeV. Designed barrel part of calorimetry system consists of the electromagnetic liquid argon (Larg) calorimeter, using the accordion geometry and a large scintillating tile hadronic barrel calorimeter, based on a sampling technique using steel absorber material and scintillating plates read out by wavelength shifting fibers. Detailed description of them can be found in [2],[3].
In that work we report the results on the studying of the e/ and e/h for the Combined calorimeter, composed from Larg and TILE prototypes. A e/h is a characteristic number of any calorimeter system and describe the non-compensation of calorimeter response on hadrons relatively to electrons. As electro-magnetic calorimeter is slim for hadrons, great part of hadron shower is outside from LArg. Therefore e/pi for Combined calorimeter is of special interest.
That investigation was performed on the basis of data on exposure of ATLAS Barrel Combined Calorimeter Prototype in beams of pions and electrons with energy 20 – 300 GeV in April 1996. Results on the studying e/h for TILE calorimeter can be found in [4].
2 The Electromagnetic Calorimeter
The electro-magnetic LArg calorimeter prototype consists of a stack of three azimuthal modules, each one spanning in azimuth and extending over 2 m along the z direction. The calorimeter structure is defined by 2.2 mm thick steel-plated lead absorbers, folded to an accordion shape and separated by 3.8 mm gaps, filled with liquid argon; the signals are collected by Kapton electrodes located in the gaps.
The calorimeter extends from an inner radius of 131.5 cm to an outer radius of 182.6 cm, representing (at = 0) a total of 25 radiation lengths (), or 1.22 interaction lengths () for protons. The calorimeter is longitudinally segmented into three compartments of , and , respectively. The segmentation is for the first two longitudinal compartments and for the last compartment, where . Each read-out cell has full projective geometry in and in . The calorimeter was located inside a large cylindrical cryostat with 2 m internal diameter, filled with liquid argon.
3 The Hadronic Calorimeter
The hadron calorimeter prototype consists of an azimuthal stack of five modules. Each module covers in azimuth and extends 1 m along the z direction, such that the front face covers cm2. The radial depth, from an inner radius of 200 cm to an outer radius of 380 cm, accounts for 8.9 at = 0 (80.5 ) for protons. Read-out cells are defined by grouping together a bundle of fibers into one photo-multiplier (PMT). Each of the 100 cells is read out by two PMTs and is fully projective in azimuth (with ), while the segmentation along the z axis is made by grouping fibers into read-out cells spanning cm () and is therefore not projective. Each module is read out in four longitudinal segments (corresponding to about 1.5, 2, 2.5 and 3 at = 0). More details of this prototype can be found in [1],[4].
The beam incident angle was, as in the previous combined run, of about 110, but now the impact point was 8 cm left from the center to avoid side leakage.
4 Experimental Setup
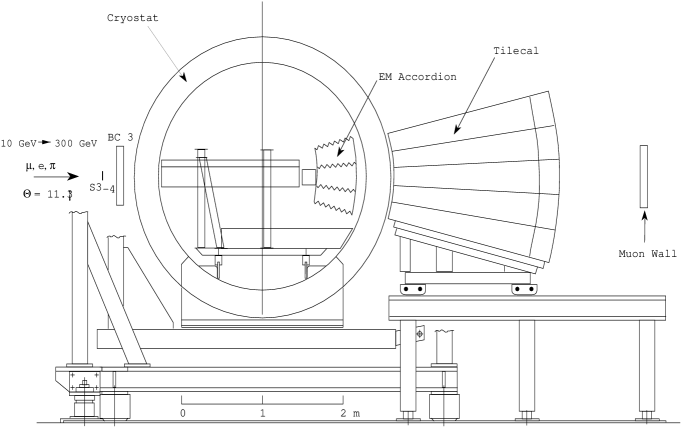
To simulate the ATLAS setup, the Tile calorimeter was placed on a fixed table, just behind the LArg Accordion cryostat, as shown in figure 1.
To optimize the containment of hadronic showers the electro-magnetic calorimeter was located as close as possible to the back of the cryostat as in the previous combined run. Early showers in the liquid argon were kept to a minimum by placing light foam material in the cryostat upstream of the calorimeter.
With respect to previous combined test beam setup [6], a new element is present.In order to try to understand the energy loss in dead material between the active part of the LArg detector and the Tilecal, a layer of scintillator called the mid-sampler was installed . The mid-sampler consisted of five scintillators, 20 cm 100 cm each, fastened directly to the front face of the Tilecal modules. The scintillator was 1 cm thick, and was readout using ten 1 mm WLS fibers on each of the long sides.
Beam quality and geometry were monitored with a set of beam chambers and trigger hodoscopes placed upstream of the LArg cryostat. The momentum bite of the beam was always less than 0.5%. Single-track pion events were selected offline by requiring the pulse height of the beam scintillation counters (S3-4 on the picture) and the energy released in the presampler of the electro-magnetic calorimeter to be compatible with that of a single particle. Beam halo events were removed with appropriate cuts on the horizontal and vertical positions of the incoming track impact point as measured with the two beam chambers (BC on the picture).
For this layout the effective distance between the two active parts of the detector is of the order of 50 cm, instead of the 25 cm as foreseen in the ATLAS setup. The amount of material has been quantified to be about in between the two calorimeters. This value is similar to the ATLAS design value, but the material type is different: steel instead of aluminum for the cryostat. The total depth corresponds to about 10.1 , to be compared with the 9.6 foreseen in the ATLAS setup [1]. A large scintillator wall (“muon wall”) covering about 1 of surface has been placed on the back of the calorimeter to quantify leakage.
5 Reconstruction of Electron Energy
To separate electrons from the muons, hadrons and events with interactions in dead material before combined calorimeter the following cuts were applied:
-
•
events with only physical trigger were selected;
-
•
cuts on beam geometry (signals from wire chambers BC1, BC2, BC3 were used);
-
•
cuts on signal from scintillator counters S1, S2, S3, S4 and pressampler to reject events with interactions before combined calorimeter;
-
•
to separate electrons from hadrons cuts on responses of Tile calorimeter samplings were applied;
-
•
cuts on total energy deposition to reject muons.
The characteristic feature of the electro-magnetic shower is its small transverse radius with the comparison of hadronic one. For reconstruction of electron energy cluster in cells of electro-magnetic calorimeter was used to avoid including noise in total response. Meanwhile, direct response of LArg on electrons is not Gaussian-like, as shown on Fig. 2.
Explanation of such behavior appears to be dependence of response on an impact point of electron, which is shown on Fig. 3, where dependence (top picture) can be considered negligible in terms of uncertainties, there -coordinate is expressed in cell numbers of electro-magnetic calorimeter along direction. For along (bottom picture) one can observe strong influence of LArg internal structure on total electron response, where also in cells numbers. Therefore total response of LArg on electrons represents a sum of normal distributions with different mean values, according to their statistical weights, and shouldn’t be Gaussian-like.
As there is no any strong dependence of calorimeter response on the electron impacting point along , therefore to achieve the mean value of energy spectrum -dependence was fitted with the line in the same region for all energies. To put mean value of LArg response on electrons correspondent to known beam energy scale factor was applied. Received mean values of responses, and reconstructed energy of electrons for 20 – 287.5 GeV beams are gathered in Table 1.
Direct error of the fitting parameter was considered as statistical error. An systematic error 0.4% was introduced to achieve total for all set of energy points. Additional error in 0.3% was introduced due to the uncertainty of scale factor. Achieved linearity of LArg response on electrons is in terms of , which is comparable with results from Ref. [5].
5.1 The e/ Ratio
To extract ratio for combined calorimeter system, one should go to the absolute energy scale for each calorimeter. In our case for electrons the signal from LArg calorimeter is sufficient for energy reconstruction, so to receive response of Combined calorimeter on pions, and extract ratio the following formula was used:
| (1) |
where and are response of LArg calorimeter on electrons and pions, is calibration constant for LArg calorimeter for window , is scale factor for electron response in Larg window , is response of Tile calorimeter on pions, is calibration constant for Tile calorimeter and , is the energy loss in the cryostat, is the calibration constant for cryostat. For the case of stand-alone calorimeter that formula leads us to the obvious expression . Calculated ratios for beam energies 20 – 300 are gathered in Table 2.
For the case of 300 GeV point, offset in 12.5 GeV was added to the reconstructed mean value of response on 287.5 GeV electrons. To achieve good of fitting an additional error for 20 GeV point 2% was introduced due to the large uncertainty in definition of response on electrons (beam spot in the ). The ratio was extracted from received data by fitting them with expression [7]:
| (2) |
Fig. 4 show the ratios for Combine 96 (black circles) and Combine 94 (open circles). The solid curve is fit of our data by function (2). As the result of fit we found , which is in a good agreement with data, received in 1994 (), but more precision. With the comparison for stand-alone prototype of Tile calorimeter [4] for incident particle angle , we received larger value for . That could be explained if LArg calorimeter is more uncompensated then Tile calorimeter, as for Combined setup represents a average on for both calorimeters.
6 Conclusion
To measure e/ and ratio for prototype of ATLAS Barrel Combined Calorimeter responses on pions and electrons were studied. Found is in good agreement with results [6] but more precisions.
7 Acknowledgments
This work is the result of the efforts of many people from ATLAS Collaboration. the authors are greatly indebted to all Collaboration for their test beam setup and data taking. Authors are grateful for M. Nessi and J. Budagov for their attention and support of this work. We are indebted to M. Cobal, D. Constanzo, B. Lung-Jensen and V.V. Vinogradov for the valuable discussions and constgructive advices.
References
- [1] ATLAS Technical Proposal, CERN/LHCC/94-43 LHCC/P2, CERN, Geneva, Switzerland, 1994.
- [2] ATLAS Collaboration, ATLAS Liquid Argon Calorimeter Technical Design Report, CERN/LHCC/96-41, ATLAS TDR 2, CERN, Geneva, Switzerland, 1996.
- [3] ATLAS Collaboration, Atlas Tile Calorimeter Technical Design Report, CERN/LHCC/96-42, ATLAS TDR 3, CERN, Geneva, Switzerland, 1996.
- [4] J.A. Budagov, Y.A. Kulchitsky , JINR, E1-95-513, 1995, Dubna, Russia; ATLAS Internal note, TILE-CAL-No-72, CERN, Geneva, Switzerland, 1995.
- [5] A. Castera , ATLAS Internal note, LARG-No-72, CERN, Geneva, Switzerland, 1997.
- [6] Z. Ajaltouni , NIM A387 (1997) 333.
- [7] R.Wigmans, NIM A265 (1988) 273.
| Beam energy | Mean value of response | Reconstructed |
| (GeV) | (GeV) | energy (GeV) |
| 287.5 | 250.6 0.30 1.00 | 292.3 2.0 |
| 150 | 130.9 0.12 0.52 | 152.7 0.9 |
| 100 | 86.36 0.08 0.34 | 100.7 0.6 |
| 80 | 69.09 0.05 0.28 | 80.6 0.4 |
| 50 | 42.45 0.04 0.17 | 49.5 0.3 |
| 40 | 33.84 0.03 0.14 | 39.5 0.2 |
| 20 | 16.88 0.03 0.07 | 19.7 0.1 |
| (GeV) | e/ ratio |
|---|---|
| 300 | 1.114 0.013 |
| 150 | 1.137 0.013 |
| 100 | 1.158 0.012 |
| 80 | 1.170 0.013 |
| 50 | 1.174 0.012 |
| 40 | 1.186 0.012 |
| 20 | 1.278 0.016 |
 |
 |
 |
