A New Measurement of the Rare Recay
Abstract
More than 400 events were observed in a rare decay experiment at the AGS. Normalized to the decay, the branching ratio is determined to be . This branching ratio and the mass spectrum is in very good agreement with the measurement of the decay, but deviates significantly from the previous measurement.
pacs:
13.20.-v,13.20EbIn the Standard Model, the decay () proceeds through the same mechanism as (). It has been recognized for a long time that both decays are dominated by long distance contributions involving one photon exchange [7, 8, 9, 10] and therefore can be described by a vector interaction form factor. Consequently, the ratio of the two decay rates depends only on the shape of this form factor. Comparisons of the and measurements are of great interest, not only within the framework of the Standard Model, but also because differences in the form factors measured separately in the two decays would indicate new physics, in particular those extensions that involve mass dependent couplings. The dilepton mass range below 350 MeV/ is almost inaccessible by other means. A precise measurement of the decay amplitude is also essential for future investigations of in the context of P- and CP-violation through measurements of the polarization, as suggested by many theoretical calculations [11].
The mode has been measured several times since the mid-70’s [12, 13, 14], most recently with high precision by this group [15], which observed a sample of 10,000 events. This recent measurement firmly established that the decay proceeds through a vector interaction and provided a precise measurement of the form factor. The result can be quoted as, and where is a parameter in the form factor, with or [16]. The slope of the form factor, which is significantly larger than the prediction of meson dominance models or leading order chiral perturbation theory, has a direct impact on the prediction of the branching ratio.
The first observation of the decay was reported by the E787 collaboration at the AGS in 1997 [17] . The data sample consists of 13 fully reconstructed three track and 221 partially reconstructed two track events, with an estimated background of 2.4 and 25 events, respectively. The mass spectrum was not analyzed. The branching ratio was measured to be . The central value used the form factor shape measured by [13], corresponding to , and the last error came from the theoretical uncertainty of the form factor shape. This branching ratio measurement was found to be 2.2 below the expectation from the then existing measurement [13]. The significance of the discrepancy becomes greater when this branching ratio is compared to the new measurement, which predicts a model independent branching ratio of . In view of the important consequences of such a discrepancy, an experiment capable of collecting a large sample with fully reconstructed kinematics and improved systematic errors is called for.
The experiment reported here was performed at the Brookhaven Alternating Gradient Synchrotron (AGS) in 1997, using the E865 detector, which was designed to search for the lepton number violating decay [18, 19]. The data were collected in a period of six weeks. The details of the detector design and performance are discussed elsewhere [15, 20]. The components relevant to this study are emphasized here.
With 2.2 protons on target, an unseparated 6 GeV beam of , together with and protons, was produced per 1.6 sec AGS pulse. Fig. 1 is a schematic diagram of the detector. Decay products were measured in a proportional wire chamber based magnetic spectrometer system, together with scintillating hodoscopes and an electromagnetic calorimeter. Muons were identified in a range stack consisting of 24 planes of proportional tubes situated between iron absorber plates, and two sets of hodoscopes (48 pieces each) situated in the middle and at the end of the stack. The hodoscopes were segmented as vertical strips, separated in the middle.

The primary trigger is formed by the A and D hodoscopes and the electromagnetic calorimeter, where three charged particle hits are required. Most of the trigger rate, which is about 70,000/pulse, comes from accidentals. This raw trigger rate is reduced by a prescale factor of 2000. The most frequent decay that gives three charged particles in the final state is the decay (), and this decay mode is used for normalization. For decays, the next trigger level requires one muon on each side of the detector. Each muon is identified as a spatially correlated coincidence between the B and C hodoscope hits. The trigger rate at this stage is about 2000/pulse, still dominated by accidental coincidences.
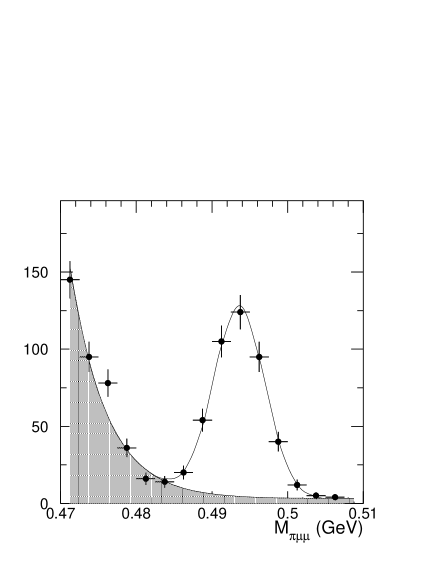
In the off-line analysis, events are required to have three reconstructed tracks that come from a common vertex in the decay volume, a reconstructed kaon momentum consistent with the beam phase space, and a timing spread between the tracks consistent with the resolution. Fig. 2 shows the reconstructed kaon mass for , in comparison with the Monte Carlo simulation. The mass resolution is MeV. The Monte Carlo simulation, using the GEANT package, takes into account the detector geometry, particle decays and interactions with the detector, as well as the independently measured efficiencies for each detector component. It reproduces all the essential distributions of the normalization sample, .

For a muon to reach the C hodoscope at the end of the muon stack, its momentum must exceed 1.3 GeV. Because of the trigger requirement, only events with the on the left side and the on the right side of the detector are accepted. A muon is required to have deposited an energy in the calorimeter consistent with a minimum ionizing particle, and to have B and C hodoscope hits and sufficient muon chamber hits along the projected trajectory through the muon stack. At this stage, the accidental background is virtually eliminated, and the candidates are dominated by the background from , followed by the decay. The majority of such background events have a mass much smaller than . To significantly suppress this background while keeping a high efficiency for the signal, a joint likelihood function is constructed, using the vertex quality, phase space, and the of the tracks. Fig. 3 is a scatter plot of the joint likelihood vs the invariant mass. The cluster of events with high likelihood value at the kaon mass are the signal, while the events below the kaon mass with low likelihood value are background from . Monte Carlo simulations show that it is the pion decays in the spectrometer magnet that cause significant mis-measurements of the particle momenta and spread the mass upwards to the signal region. The cuts based on the likelihood reduce such background. Fig. 4 shows the invariant mass distribution after requiring the joint likelihood function to be greater than -13. The observed background events below the kaon peak are consistent with the simulation of the background from .

To subtract the background, we model the mass spectrum with
| (1) |
where are parameters to be determined, , and is the kaon mass. The first two terms represent the background, which is subtracted in the signal region.
The same likelihood function is calculated for the normalization data sample (), as well as Monte Carlo events of and decays. To verify that the background subtraction procedure is reliable, the cut on the likelihood function is varied from -18 to -10. Although the number of signal events drops from 535 events to 230 events, and the background fraction improves from 38% to 1%, the branching ratio measurement remains constant within 7%. The cut of -13 is chosen such that the statistical error, including the uncertainty in background subtraction, is a minimum. There are 430 events in the signal region, with 28 background events. The mass resolution is MeV.
To examine the decay mechanism, the distribution (where is the angle between and in the center of mass of the pair), and invariant mass distribution are compared to the expectation, as shown in Fig 5. The angular distribution is consistent with the decay proceeding through a vector interaction, and the form factor parameters describing the spectrum are consistent with those of .


Normalized to the branching ratio, the branching ratio and the form factor slope parameter are determined to be
| (2) | |||||
| (3) |
Errors are statistical only, taking into account the uncertainty in the background fluctuation.
The similarity between the and final state makes the normalization very reliable. The systematic error comes mainly from the uncertainty in the muon identification, and the background subtraction procedure.

Table I summarizes the systematic errors. There is sufficient overlap between the primary trigger and the trigger that the trigger efficiency and primary trigger prescale factor can be precisely determined. To confirm the detector acceptance and efficiencies, many other checks were made. The Dalitz plot parameters of the events were found to be consistent with the published values. The muon identification efficiency was checked with the decay followed by the decay.
The branching ratio divided by the model independent partial branching ratio of with GeV is . This is to be compared to the expectation of 0.432 when is assumed. A more complete comparison is shown in Fig. 6, where the contours are plotted as a function of for both decay modes. The consistency is evident.
| Sources | |
| branching ratio | 0.01 |
| prescale factor | 0.01 |
| trigger efficiency | 0.01 |
| B, C hodoscope efficiency | 0.02 |
| EM energy scale | 0.01 |
| Energy loss before C hodoscope | |
| Background subtraction & cuts | 0.03 |
| Reconstruction Efficiency | |
| Magnetic field map | |
| Total | 0.053 |
The two normalization samples, namely, for and followed by for , are compared and found to be consistent within the uncertainty.
Our branching ratio measurement disagrees with that of [17]. The discrepancy is 3.3
To summarize, we have measured the branching ratio to be . Both the decay rate and the form factor shape are found to be in good agreement with the expectation based on the measurements, from which we conclude that the mechanisms for these two decay modes are consistent with being the same, as theoretically expected.
We gratefully acknowledge the contributions to the success of this experiment by the staff and management of the AGS at the Brookhaven National Laboratory, and the technical staffs of the participating institutions. This work was supported in part by the U. S. Department of Energy, the National Science Foundations of the USA(REU program), Russia and Switzerland, and the Research Corporation.
REFERENCES
- [1] Now at: Rutgers University, Piscataway, NJ 08855
- [2] Now at:University of Texas, Austin, TX 78712
- [3] Now at: Albert-Ludwigs-Universität, D-79104 Freiburg, Germany
- [4] Now at: University of Connecticut, Storrs, CT 06269
- [5] Now at: LIGO/Caltech, Pasadena, CA 91125
- [6] Now at: Universitätspital, CH-8091 Zürich, Switzerland
- [7] A. I. Vainshtein et al., Yad. Fiz. 24, 820 (1976) [Sov. J. Nucl. Phys. 24, 427 (1976)].
- [8] G. Eilam and M. D. Scadron, Phys. Rev. D 31, 2263 (1985).
- [9] L. Bergström and P. Singer, Phys. Rev. D 43, 1568 (1991); Phys. Rev. Lett. 55,2633 (1985).
- [10] P. Lichard, Phys. Rev. D55, 5385 (1997); id. 60, 053007 (1999); hep-ph/9904265 (University of Pittsburgh).
- [11] See, e.g., P. Agrawal et al., Phys. Rev. D45,2383 (1992); G. Buchalla and A. Buras, Phys. Lett. B 336, 263 (1994).
- [12] P. Bloch et al., Phys. Lett. B 56, 201 (1975).
- [13] C. Alliegro et al, Phys. Rev. Lett. 68, 278 (1992).
- [14] A. L. Deshpande, Ph.D. thesis, Yale University (1995).
- [15] R. Appel et al., Phys. Rev. Lett, in print, (hep-ex/9907045).
- [16] See [15] for the definition of the decay amplitude. Although a small, but significant, nonlinearity of the form factor was found in the analysis of the data[15], the linear approximation is sufficient for this analysis.
- [17] S. Adler et al., Phys. Rev. Lett. 79, 4756 (1997).
- [18] D. R. Bergman, Ph.D. thesis, Yale University (1997).
- [19] S. Pislak, Ph.D. thesis, University of Zürich (1997).
- [20] R. Appel et al., to be submitted to Nucl. Instr. Meth.