Search for the Weak Decay of a Lightly Bound Dibaryon
Abstract
We present results of a search for a neutral, six-quark, dibaryon state called the , a state predicted to exist in several theoretical models. Observation of such a state would signal the discovery of a new form of hadronic matter. Analyzing data collected by experiment E799-II, using the KTeV detector at Fermilab, we searched for the decay and found no candidate events. We exclude the region of lightly bound mass states just below the mass threshold, , with lifetimes from sec to sec.
pacs:
PACS numbers: 14.20.Pt, 13.85.Rm, 13.75.Ev, 21.80.+a, 12.39.BaIn 1977, Jaffe [1] proposed the existence of a metastable dibaryon, the (-quark), a bound six-quark state (, ), described as . If it exists, this hadron would be a new form of matter. The observation of a bound dibaryon would enhance the understanding of strong interactions and would aid in the search for additional exotic-multiquark states [2].
The two-flavor six-quark state is unbound [3], a result of the Pauli exclusion principle. The Pauli exclusion principle can be circumvented through the addition of strangeness as an extra degree of freedom. Jaffe estimated that the color-hyperfine interaction between the six quarks of a state would be strong enough to cause the to be a bound state. Different theoretical models have produced a multitude of predictions for , covering a broad mass range from deeply bound states to unbound states [4]. Most of the predictions, however, are clustered in the range of 2.1 up to a few above the threshold of 2.231 . If is between the (2.055 ) and thresholds, it is expected to be a metastable state and undergo a weak decay. Its lifetime is estimated to be less than sec [5], while baryonic weak decays suggest a lower limit on the lifetime of sec.
Using a variety of techniques, experimentalists have been trying for years to detect the , without conclusive results [6]. In recent years, production models based on empirical data with few assumptions built into them have allowed experimentalists to gauge the sensitivity of their results. In particular, the combined results from three recent experiments [6, 7, 8] rule out the mass range for transitions below 2.21 . The analysis presented here covers the mass range of lightly bound ’s between the and thresholds, 2.194 and 2.231 , respectively. In addition, this search is sensitive to a large range of lifetimes, from to sec, completely covering the range of lifetimes proposed in reference [5] yet to be probed.
It is expected that an can be produced in collisions through hyperon production; where two strange quarks are produced, followed by the coalescence of a hyperon and a baryon to form a bound six-quark state. Currently, the only model for production at Tevatron beam energies is one proposed by Rotondo [9]. His model is based on production of the doubly strange , followed by the coalescence of the with a , predicting a total cross-section of 1.2 b. Our search for the is the first search to normalize to the doubly strange , removing the strangeness production portion from the production process, making this analysis a sensitive probe of hypernuclear coalescence. The production process at the Tevatron, through collisions, complements other current experimental efforts that search for ’s produced in heavy ion collisions.
The KTeV beam line and detector at Fermilab were designed for high precision studies of direct CP violation in the neutral kaon system (E832) and in rare decays (E799-II). To reduce backgrounds from long lived neutral states, the apparatus was situated far from the production target. A clean neutral beam, powerful particle identification, and very good resolution for both charged particles and photons made it a good facility to search for and fully reconstruct both the signal mode, , and the normalization mode, , where refers to the Dalitz decay of the to . For both modes, the ’s decay downstream of the parent particle’s vertex to a . The data presented here were collected during two months of E799-II data-taking in 1997.
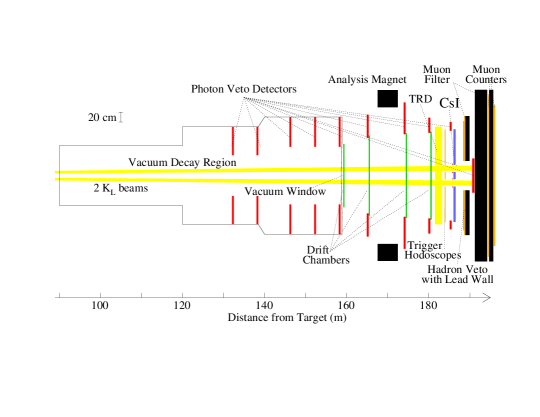
The KTeV detector and the trigger configuration used to select events with four charged particles have been described elsewhere [10]. This article highlights aspects of the detector directly relevant to this analysis. A neutral beam, composed primarily of kaons and neutrons was produced by focusing an 800 GeV/ proton beam at a vertical angle of 4.8 mrad on a 1.1 interaction length (30 cm) BeO target. Photons produced in the target were converted in a 7.6 cm lead absorber located downstream of the target. Charged particles were removed further downstream with magnetic sweeping. Collimators, followed by sweeping magnets, defined two 0.25 sr neutral beams that entered the KTeV apparatus (Fig. 1) 94 m downstream from the target. The 65 m vacuum ( Torr) decay region extended to the first drift chamber.
The momenta of the charged particles were measured with a charged particle spectrometer, consisting of four planar drift chambers, two upstream and two downstream of a dipole analyzing magnet. The energies of the particles were measured with a high resolution CsI electromagnetic calorimeter. To distinguish electrons from hadrons, the energy (E) measured by the calorimeter was compared to the momentum (p) measured by the charged spectrometer. Electrons were identified by , while pions and protons were identified by .
Offline, events were required to have four reconstructed charged particles. We searched for long lived ’s which were produced at the target and decayed in the vacuum decay region. A characteristic feature of the topology of both the signal and normalization modes is that the parent particle’s true decay vertex is defined by a charged track vertex; the vertex for the and the vertex for the . The subsequent ’s decay downstream of the parent particle’s vertex to . Events were required to have at least four reconstructed tracks, two tracks associated with positive particles and two with negative particles. In the case of the , having identified the and the by their and their charge, there remains a two-fold ambiguity in combining the ’s with the ’s to form a vertex. To resolve that ambiguity, each pair of positive and negative tracks was combined to form a vertex at the location of closest approach between the two tracks. The distance of closest approach (DOCA) and the resultant momentum vector of the combined charged tracks for both the upstream vertex and the downstream vertex were calculated. The vertex was determined by calculating the DOCA of the downstream and the upstream . The DOCA’s of the upstream, downstream and vertices were summed in quadrature, and the permutation that gave the minimum quadrature sum was selected.
Downstream ’s were identified by requiring the ratio of the lab momenta of the to to be greater than 3, which accepted 99.8% of the simulated signal events. Because the decays to two particles, the transverse momentum () distribution of the decay products relative to the direction of the exhibits a Jacobian peak at a maximum of 0.1 GeV/c. To enhance the selection of decays relative to background three body decays, where the distribution is peaked at 0, we required the of the and the to be between 0.07 GeV/c and 0.11 GeV/c, accepting 60% of the simulated signal events. To select ’s further, we required the mass of the reconstructed to fall within of , where the resolution is 1 . The charged portion of the upstream vertex is made up of a and and has kinematics similar to a decay. Thus, the same constraint used for the was applied, requiring the ratio of the lab momenta of the to to be greater than 3.
Interactions in the collimator, sweeping magnets, and vacuum window produced background events with multiple vertices. Events where at least one decaying particle was short-lived were removed by requiring the reconstructed and vertices to be between 100 m and 155 m from the target, 5 m away from those apparatus elements.
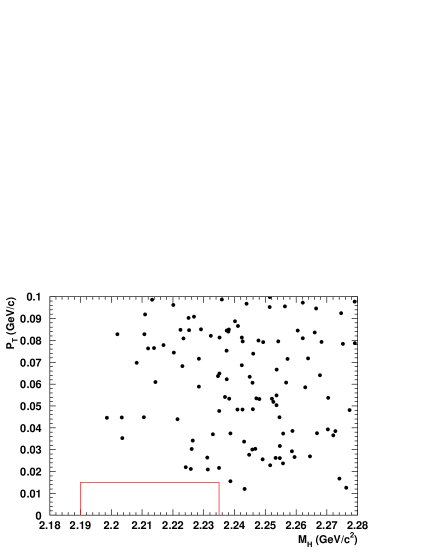
The signal region for candidates was defined by requiring to be between 2.190 and 2.235 to account for resolution effects in measuring ; the upper and lower limits on are 4 (more than twice our estimated resolution) above the threshold of 2.231 and below the threshold of 2.194 , respectively. In addition, the transverse momentum of the reconstructed (), measured relative to a vector connecting the decay vertex and the target was required to be less than 0.015 GeV/c (see Fig. 2). The cut on accepted 90% of the remaining simulated signal events. None of the events passed all the selection criteria.
To quantify the measurement sensitivity, we normalized to production, using data taken with the same trigger configuration as that for the analysis, reconstructing decays. Except for the additional photon coming from the , the normalization mode’s decay topology is similar to that of the ’s. Applying a series of cuts similar to those used for the analysis yields 17 160 events, with negligible background. The cleanliness of the normalization mode’s signal is demonstrated in Fig. 3 which shows the invariant mass peak. The accepted ’s have mean momentum of GeV/c. Distributions of variables from simulated decays, such as the ’s momentum and the location of the ’s decay vertex are consistant with the same for data.
The and are expected to have different absorption lengths in the BeO target and the Pb absorber, leading to a difference in the transmission probability () for the two particles. We estimate the -nucleon () and -nucleon () cross-sections and thus the ’s based on the assumption of isospin invariance. In addition, we utilize measured , and deuteron-proton () cross-sections [11], 40 mb, 35 mb and 75 mb, respectively, to account for the effect of replacing down quarks with strange quarks; we assume that the scale factor can be used to correct for the substitution of a single strange quark for a down quark and for a double substitution. We then estimate to be mb and to be mb, where the assigned errors are taken to be equal to the magnitude of the correction itself. The measured absorption lengths for nucleons in BeO and Pb are scaled by the factors and . The estimated ’s in the target are and . In the lead absorber, the ’s are estimated to be and .
As no signal events passed all the selection criteria, the final result is presented as a 90% C.L. upper limit on the inclusive production cross-section over the solid angle defined by the collimators, expressed in terms of the inclusive production cross-section
| (1) |
where is the factor which multiplies the single event sensitivity (SES) to give the 90% C.L. upper limit, is the number of reconstructed decays, the various factors are the transmission probabilities described previously, and are the acceptances for and decays, respectively, and and are the respective branching ratios. Our estimate of the SES suffers from a large relative uncertainty of , predominantly due to the uncertainty in determining the transmission factors. The uncertainty in the SES gives rise to a factor of in the determination of the 90% C.L. upper limit [12].
The acceptances were determined from a detailed detector simulation. Because the trigger was the same for both the signal and normalization modes and because both the signal and normalization modes consist of four-track events with largely similar topologies, trigger and acceptance inefficiencies mostly cancel. The flux was measured using two separate triggers, each composed of different trigger elements. The discrepancy between the two flux measurements was converted into a systematic uncertainty in determining . Other systematic uncertainties were negligible relative to this uncertainty. was determined to be .
To determine , the detector simulation included the production spectrum proposed in Rotondo’s phenomenological model [9]. The dominant experimental uncertainty in comes from the simulation of proton showers in the calorimeter, where the relative uncertainty was determined to be 5.3%. For example, taking in the middle of the mass range we are sensitive to, , and the lifetime corresponding to the lifetime given in reference [5] for this mass, sec, . As a cross-check of Rotondo’s model, which incorporates a production spectrum, we applied our measured production spectrum in the detector simulation, replacing and with and , respectively. This lowered by 15%. The 90% C.L. upper limit on the product of the branching ratio and the production cross-section, taking into account all the uncertainties, is
| (2) |
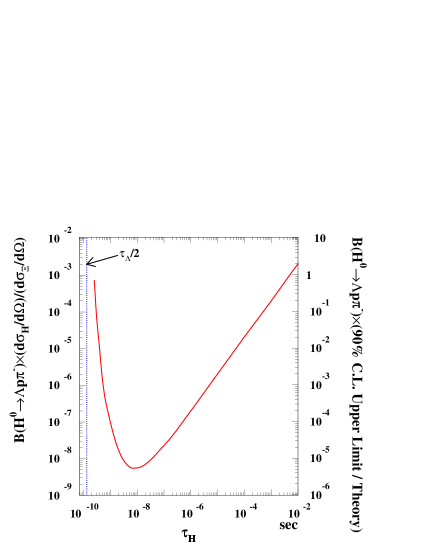
In Fig. 4, we plot the 90% C.L. upper limit on the ratio , studying the effect on of varying over a large range of values. For short lifetimes, the ’s decay before reaching the decay region, while for long lived states, only a few decay while passing through the detector. Both effects lower our sensitivity to decays. Varying across the full range of masses to which we are sensitive leads to a relative shift of approximately from the central value of the curve plotted in Fig. 4. Included in the figure is a line at sec, the expected lifetime of system made up of two lightly bound ’s, which might be a lower bound on . To interpret the sensitivity of this result relative to the theoretical production model, we integrate the theoretical predictions for both [9] and [13] over the solid angle covered by the collimators. The right ordinate axis of Fig. 4 shows the sensitivity of this measurement. Thus our result rules out lightly bound ’s, between the and thresholds of 2.194 and 2.231 , respectively, over a large range of lifetimes, from sec up to sec.
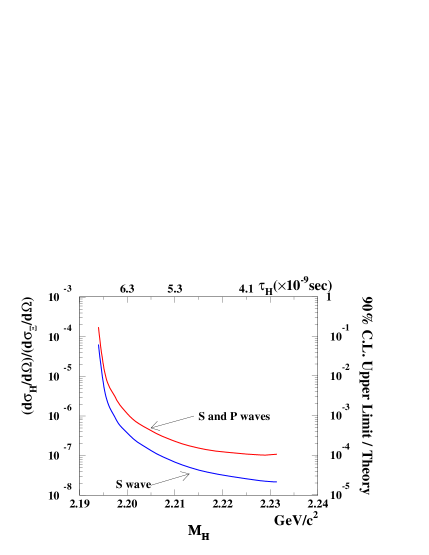
A model proposed in reference [5] associates with both and . For example, for they predict sec and a branching ratio of . To test this model, we vary between the and thresholds, determining the dependence of the production cross-section on the mass, lifetime and branching ratio. Figure 5 is a plot of versus . In this figure, the factor influencing the sensitivity the most is the branching ratio which decreases from a maximum of 14% at the threshold down to zero at the threshold. The right ordinate axis of Fig. 5 shows the sensitivity of this measurement, based on Rotondo’s model. Assuming Rotondo’s production model, this result clearly rules out a long lived state, as proposed in reference [5], for between the and thresholds.
To conclude, our result rules out a lightly bound dibaryon over a range of mass below the threshold not ruled out by previous experiments and for a wide range of lifetimes, placing stringent limits on the production process. This result, in conjunction with the result from experiment BNL E888 [8], completely rules out the model proposed in reference [5] for all transitions.
We thank D. Ashery, F.S. Rotondo and A. Schwartz for their insightful comments. We gratefully acknowledge the support and effort of the Fermilab staff and the technical staffs of the participating institutions for their vital contributions. This work was supported in part by the U.S. Department of Energy, The National Science Foundation and The Ministry of Education and Science of Japan.
REFERENCES
- [1] R.L. Jaffe, Phys. Rev. Lett. 38, 195 (1977).
- [2] H.J. Lipkin, Phys. Lett. B 195, 484 (1987); C. Gignoux et al., Phys. Lett. B 193, 323 (1987); J. Leandri et al., Phys. Rev. D 51, 3628 (1995).
- [3] H.J. Lipkin, Phys. Lett. B 198, 131 (1987).
- [4] B. Quinn et al., in Proceedings of Baryons’92: International Conference on the Structure of Baryons and Related Mesons, New Haven, Connecticut, 1992, edited by M. Gai, (World Scientific, River Edge, New Jersey, 1993), p. 278. For a comprehensive listing of current theoretical predictions see R.W. Stotzer, Ph.D. dissertation, University of New Mexico, 1997 (unpublished).
- [5] J.F. Donoghue, E. Golowich, and B.R. Holstein, Phys. Rev. D 34, 3434 (1986).
- [6] D. Ashery, in Proceedings of Hadron Spectroscopy: Seventh International Conference, Upton, New York, 1997, edited by S.U. Chung and H.J. Willutzki (Amer. Inst. Phys., Woodbury, New York, 1998), p. 293.
- [7] J.K. Ahn et al., Phys. Lett. B 378, 53 (1996); R.W. Stotzer et al., Phys. Rev. Lett. 78, 3646 (1997).
- [8] J. Belz et al., Phys. Rev. Lett. 76, 3277 (1996). Addendum in J. Belz et al., Phys. Rev. C 56, 1164 (1997).
- [9] F.S. Rotondo, Phys. Rev. D 47, 3871 (1993).
- [10] J. Adams et al., Phys. Rev. Lett. 80, 4123 (1998).
- [11] Particle Data Group, C. Caso et al., Eur. Phys. J. C 3, 1 (1998).
- [12] R.D. Cousins and V.L. Highland, Nucl. Instrum. and Meth. A 320, 331 (1992).
- [13] L.G. Pondrom, Phys. Rep. 122, 57 (1985).