FERMILAB-PUB-99/301-E
Production of Mesons from Decays in Collisions at TeV
T. Affolder,21 H. Akimoto,43 A. Akopian,36 M. G. Albrow,10 P. Amaral,7 S. R. Amendolia,32 D. Amidei,24 J. Antos,1 G. Apollinari,36 T. Arisawa,43 T. Asakawa,41 W. Ashmanskas,7 M. Atac,10 F. Azfar,29 P. Azzi-Bacchetta,30 N. Bacchetta,30 M. W. Bailey,26 S. Bailey,14 P. de Barbaro,35 A. Barbaro-Galtieri,21 V. E. Barnes,34 B. A. Barnett,17 M. Barone,12 G. Bauer,22 F. Bedeschi,32 S. Belforte,40 G. Bellettini,32 J. Bellinger,44 D. Benjamin,9 J. Bensinger,4 A. Beretvas,10 J. P. Berge,10 J. Berryhill,7 S. Bertolucci,12 B. Bevensee,31 A. Bhatti,36 C. Bigongiari,32 M. Binkley,10 D. Bisello,30 R. E. Blair,2 C. Blocker,4 K. Bloom,24 B. Blumenfeld,17 B. S. Blusk,35 A. Bocci,32 A. Bodek,35 W. Bokhari,31 G. Bolla,34 Y. Bonushkin,5 D. Bortoletto,34 J. Boudreau,33 A. Brandl,26 S. van den Brink,17 C. Bromberg,25 N. Bruner,26 E. Buckley-Geer,10 J. Budagov,8 H. S. Budd,35 K. Burkett,14 G. Busetto,30 A. Byon-Wagner,10 K. L. Byrum,2 M. Campbell,24 A. Caner,32 W. Carithers,21 J. Carlson,24 D. Carlsmith,44 J. Cassada,35 A. Castro,30 D. Cauz,40 A. Cerri,32 A. W. Chan,1 P. S. Chang,1 P. T. Chang,1 J. Chapman,24 C. Chen,31 Y. C. Chen,1 M. -T. Cheng,1 M. Chertok,38 G. Chiarelli,32 I. Chirikov-Zorin,8 G. Chlachidze,8 F. Chlebana,10 L. Christofek,16 M. L. Chu,1 S. Cihangir,10 C. I. Ciobanu,27 A. G. Clark,13 M. Cobal,32 E. Cocca,32 A. Connolly,21 J. Conway,37 J. Cooper,10 M. Cordelli,12 D. Costanzo,32 J. Cranshaw,39 D. Cronin-Hennessy,9 R. Cropp,23 R. Culbertson,7 D. Dagenhart,42 F. DeJongh,10 S. Dell’Agnello,12 M. Dell’Orso,32 R. Demina,10 L. Demortier,36 M. Deninno,3 P. F. Derwent,10 T. Devlin,37 J. R. Dittmann,10 S. Donati,32 J. Done,38 T. Dorigo,14 N. Eddy,16 K. Einsweiler,21 J. E. Elias,10 E. Engels, Jr.,33 W. Erdmann,10 D. Errede,16 S. Errede,16 Q. Fan,35 R. G. Feild,45 C. Ferretti,32 I. Fiori,3 B. Flaugher,10 G. W. Foster,10 M. Franklin,14 J. Freeman,10 J. Friedman,22 Y. Fukui,20 S. Gadomski,23 S. Galeotti,32 M. Gallinaro,36 T. Gao,31 M. Garcia-Sciveres,21 A. F. Garfinkel,34 P. Gatti,30 C. Gay,45 S. Geer,10 D. W. Gerdes,24 P. Giannetti,32 P. Giromini,12 V. Glagolev,8 M. Gold,26 J. Goldstein,10 A. Gordon,14 A. T. Goshaw,9 Y. Gotra,33 K. Goulianos,36 H. Grassmann,40 C. Green,34 L. Groer,37 C. Grosso-Pilcher,7 M. Guenther,34 G. Guillian,24 J. Guimaraes da Costa,24 R. S. Guo,1 C. Haber,21 E. Hafen,22 S. R. Hahn,10 C. Hall,14 T. Handa,15 R. Handler,44 W. Hao,39 F. Happacher,12 K. Hara,41 A. D. Hardman,34 R. M. Harris,10 F. Hartmann,18 K. Hatakeyama,36 J. Hauser,5 J. Heinrich,31 A. Heiss,18 B. Hinrichsen,23 K. D. Hoffman,34 C. Holck,31 R. Hollebeek,31 L. Holloway,16 R. Hughes,27 J. Huston,25 J. Huth,14 H. Ikeda,41 M. Incagli,32 J. Incandela,10 G. Introzzi,32 J. Iwai,43 Y. Iwata,15 E. James,24 H. Jensen,10 M. Jones,31 U. Joshi,10 H. Kambara,13 T. Kamon,38 T. Kaneko,41 K. Karr,42 H. Kasha,45 Y. Kato,28 T. A. Keaffaber,34 K. Kelley,22 M. Kelly,24 R. D. Kennedy,10 R. Kephart,10 D. Khazins,9 T. Kikuchi,41 M. Kirk,4 B. J. Kim,19 H. S. Kim,23 S. H. Kim,41 Y. K. Kim,21 L. Kirsch,4 S. Klimenko,11 D. Knoblauch,18 P. Koehn,27 A. Köngeter,18 K. Kondo,43 J. Konigsberg,11 K. Kordas,23 A. Korytov,11 E. Kovacs,2 J. Kroll,31 M. Kruse,35 S. E. Kuhlmann,2 K. Kurino,15 T. Kuwabara,41 A. T. Laasanen,34 N. Lai,7 S. Lami,36 S. Lammel,10 J. I. Lamoureux,4 M. Lancaster,21 G. Latino,32 T. LeCompte,2 A. M. Lee IV,9 S. Leone,32 J. D. Lewis,10 M. Lindgren,5 T. M. Liss,16 J. B. Liu,35 Y. C. Liu,1 N. Lockyer,31 J. Loken,29 M. Loreti,30 D. Lucchesi,30 P. Lukens,10 S. Lusin,44 L. Lyons,29 J. Lys,21 R. Madrak,14 K. Maeshima,10 P. Maksimovic,14 L. Malferrari,3 M. Mangano,32 M. Mariotti,30 G. Martignon,30 A. Martin,45 J. A. J. Matthews,26 P. Mazzanti,3 K. S. McFarland,35 P. McIntyre,38 E. McKigney,31 M. Menguzzato,30 A. Menzione,32 E. Meschi,32 C. Mesropian,36 C. Miao,24 T. Miao,10 R. Miller,25 J. S. Miller,24 H. Minato,41 S. Miscetti,12 M. Mishina,20 N. Moggi,32 E. Moore,26 R. Moore,24 Y. Morita,20 A. Mukherjee,10 T. Muller,18 A. Munar,32 P. Murat,32 S. Murgia,25 M. Musy,40 J. Nachtman,5 S. Nahn,45 H. Nakada,41 T. Nakaya,7 I. Nakano,15 C. Nelson,10 D. Neuberger,18 C. Newman-Holmes,10 C.-Y. P. Ngan,22 P. Nicolaidi,40 H. Niu,4 L. Nodulman,2 A. Nomerotski,11 S. H. Oh,9 T. Ohmoto,15 T. Ohsugi,15 R. Oishi,41 T. Okusawa,28 J. Olsen,44 C. Pagliarone,32 F. Palmonari,32 R. Paoletti,32 V. Papadimitriou,39 S. P. Pappas,45 A. Parri,12 D. Partos,4 J. Patrick,10 G. Pauletta,40 M. Paulini,21 A. Perazzo,32 L. Pescara,30 T. J. Phillips,9 G. Piacentino,32 K. T. Pitts,10 R. Plunkett,10 A. Pompos,34 L. Pondrom,44 G. Pope,33 F. Prokoshin,8 J. Proudfoot,2 F. Ptohos,12 G. Punzi,32 K. Ragan,23 D. Reher,21 A. Reichold,29 W. Riegler,14 A. Ribon,30 F. Rimondi,3 L. Ristori,32 W. J. Robertson,9 A. Robinson,23 T. Rodrigo,6 S. Rolli,42 L. Rosenson,22 R. Roser,10 R. Rossin,30 W. K. Sakumoto,35 D. Saltzberg,5 A. Sansoni,12 L. Santi,40 H. Sato,41 P. Savard,23 P. Schlabach,10 E. E. Schmidt,10 M. P. Schmidt,45 M. Schmitt,14 L. Scodellaro,30 A. Scott,5 A. Scribano,32 S. Segler,10 S. Seidel,26 Y. Seiya,41 A. Semenov,8 F. Semeria,3 T. Shah,22 M. D. Shapiro,21 P. F. Shepard,33 T. Shibayama,41 M. Shimojima,41 M. Shochet,7 J. Siegrist,21 G. Signorelli,32 A. Sill,39 P. Sinervo,23 P. Singh,16 A. J. Slaughter,45 K. Sliwa,42 C. Smith,17 F. D. Snider,10 A. Solodsky,36 J. Spalding,10 T. Speer,13 P. Sphicas,22 F. Spinella,32 M. Spiropulu,14 L. Spiegel,10 L. Stanco,30 J. Steele,44 A. Stefanini,32 J. Strologas,16 F. Strumia, 13 D. Stuart,10 K. Sumorok,22 T. Suzuki,41 R. Takashima,15 K. Takikawa,41 M. Tanaka,41 T. Takano,28 B. Tannenbaum,5 W. Taylor,23 M. Tecchio,24 P. K. Teng,1 K. Terashi,41 S. Tether,22 D. Theriot,10 R. Thurman-Keup,2 P. Tipton,35 S. Tkaczyk,10 K. Tollefson,35 A. Tollestrup,10 H. Toyoda,28 W. Trischuk,23 J. F. de Troconiz,14 S. Truitt,24 J. Tseng,22 N. Turini,32 F. Ukegawa,41 J. Valls,37 S. Vejcik III,10 G. Velev,32 R. Vidal,10 R. Vilar,6 I. Vologouev,21 D. Vucinic,22 R. G. Wagner,2 R. L. Wagner,10 J. Wahl,7 N. B. Wallace,37 A. M. Walsh,37 C. Wang,9 C. H. Wang,1 M. J. Wang,1 T. Watanabe,41 D. Waters,29 T. Watts,37 R. Webb,38 H. Wenzel,18 W. C. Wester III,10 A. B. Wicklund,2 E. Wicklund,10 H. H. Williams,31 P. Wilson,10 B. L. Winer,27 D. Winn,24 S. Wolbers,10 D. Wolinski,24 J. Wolinski,25 S. Worm,26 X. Wu,13 J. Wyss,32 A. Yagil,10 W. Yao,21 G. P. Yeh,10 P. Yeh,1 J. Yoh,10 C. Yosef,25 T. Yoshida,28 I. Yu,19 S. Yu,31 A. Zanetti,40 F. Zetti,21 and S. Zucchelli3
(CDF Collaboration)
1 Institute of Physics, Academia Sinica, Taipei, Taiwan 11529, Republic of China
2 Argonne National Laboratory, Argonne, Illinois 60439
3 Istituto Nazionale di Fisica Nucleare, University of Bologna, I-40127 Bologna, Italy
4 Brandeis University, Waltham, Massachusetts 02254
5 University of California at Los Angeles, Los Angeles, California 90024
6 Instituto de Fisica de Cantabria, University of Cantabria, 39005 Santander, Spain
7 Enrico Fermi Institute, University of Chicago, Chicago, Illinois 60637
8 Joint Institute for Nuclear Research, RU-141980 Dubna, Russia
9 Duke University, Durham, North Carolina 27708
10 Fermi National Accelerator Laboratory, Batavia, Illinois 60510
11 University of Florida, Gainesville, Florida 32611
12 Laboratori Nazionali di Frascati, Istituto Nazionale di Fisica Nucleare, I-00044 Frascati, Italy
13 University of Geneva, CH-1211 Geneva 4, Switzerland
14 Harvard University, Cambridge, Massachusetts 02138
15 Hiroshima University, Higashi-Hiroshima 724, Japan
16 University of Illinois, Urbana, Illinois 61801
17 The Johns Hopkins University, Baltimore, Maryland 21218
18 Institut für Experimentelle Kernphysik, Universität Karlsruhe, 76128 Karlsruhe, Germany
19 Korean Hadron Collider Laboratory: Kyungpook National University, Taegu 702-701; Seoul National University, Seoul 151-742; and SungKyunKwan University, Suwon 440-746; Korea
20 High Energy Accelerator Research Organization (KEK), Tsukuba, Ibaraki 305, Japan
21 Ernest Orlando Lawrence Berkeley National Laboratory, Berkeley, California 94720
22 Massachusetts Institute of Technology, Cambridge, Massachusetts 02139
23 Institute of Particle Physics: McGill University, Montreal H3A 2T8; and University of Toronto, Toronto M5S 1A7; Canada
24 University of Michigan, Ann Arbor, Michigan 48109
25 Michigan State University, East Lansing, Michigan 48824
26 University of New Mexico, Albuquerque, New Mexico 87131
27 The Ohio State University, Columbus, Ohio 43210
28 Osaka City University, Osaka 588, Japan
29 University of Oxford, Oxford OX1 3RH, United Kingdom
30 Universita di Padova, Istituto Nazionale di Fisica Nucleare, Sezione di Padova, I-35131 Padova, Italy
31 University of Pennsylvania, Philadelphia, Pennsylvania 19104
32 Istituto Nazionale di Fisica Nucleare, University and Scuola Normale Superiore of Pisa, I-56100 Pisa, Italy
33 University of Pittsburgh, Pittsburgh, Pennsylvania 15260
34 Purdue University, West Lafayette, Indiana 47907
35 University of Rochester, Rochester, New York 14627
36 Rockefeller University, New York, New York 10021
37 Rutgers University, Piscataway, New Jersey 08855
38 Texas A&M University, College Station, Texas 77843
39 Texas Tech University, Lubbock, Texas 79409
40 Istituto Nazionale di Fisica Nucleare, University of Trieste/ Udine, Italy
41 University of Tsukuba, Tsukuba, Ibaraki 305, Japan
42 Tufts University, Medford, Massachusetts 02155
43 Waseda University, Tokyo 169, Japan
44 University of Wisconsin, Madison, Wisconsin 53706
45 Yale University, New Haven, Connecticut 06520
Abstract
We have reconstructed the radiative decays and in collisions at TeV, and measured the fraction of mesons that originate from these decays. For mesons with GeV/, the fractions that come from and decays are and , respectively. We have derived the fraction of directly produced mesons to be .
PACS numbers: 13.85.Ni, 14.40.Gx
The large discrepancies between the charmonium production cross sections measured by the Collider Detector at Fermilab (CDF) [1] and the predictions of the Color Singlet Model (CSM) can be explained in a theoretical framework based on non-relativistic QCD [2]. In this model, originally developed to describe rigorously the decay of heavy quarkonium states, the production process is factorized into short distance cross sections to produce the heavy quark pair, and long distance matrix elements, describing their binding into the quarkonium state. These matrix elements must be determined from experimental data but are assumed to be independent of the reaction and can be used to predict other processes. A consequence of this approach, when applied to charmonium production in collisions, is the realization that pairs, produced at short distance in a color-octet state, are responsible for the bulk of the cross section. In the bottomonium sector CDF has measured the inclusive production cross section of , and . The prediction of CSM underestimates the measured rate, although by a smaller amount than found for charmonium [3]. Color-octet contributions can account for the discrepancies, but data on the inclusive cross section alone is not enough to extract the matrix elements without assumptions [4]. In order to do this one needs to separate experimentally ’s produced directly from those arising from the decays of heavier mesons.
In this letter we report a study of the reaction , , at TeV using CDF. This analysis, based on approximately 90 pb-1 of data collected during the 1994-1995 collider run, describes the first observation of mesons at a hadron collider. Since the branching fractions for decays into other modes containing an are expected to be small, this study allows us to measure the contribution of decays to production. Even though mesons can be reconstructed at CDF throughout the low region, we perform this measurement only for GeV/ because at lower the photon emitted in the radiative decay is not energetic enough to be detected efficiently. In this analysis we do not study transitions of mesons to because photons from this decay have even lower energy.
The CDF detector has been described in detail elsewhere [5]. The events used in this analysis were collected with a three-level trigger system which selects events consistent with the presence of two muons. The first level required that two candidates be observed in the muon chambers. The second level required that two or more charged particle tracks, partially reconstructed in the central tracking chamber (CTC) using a fast processor, matched within in (the azimuthal angle) the muon candidates. The third level required better precision on the azimuthal matching and required the dimuon invariant mass to be between 8.5 and 11.4 GeV/.
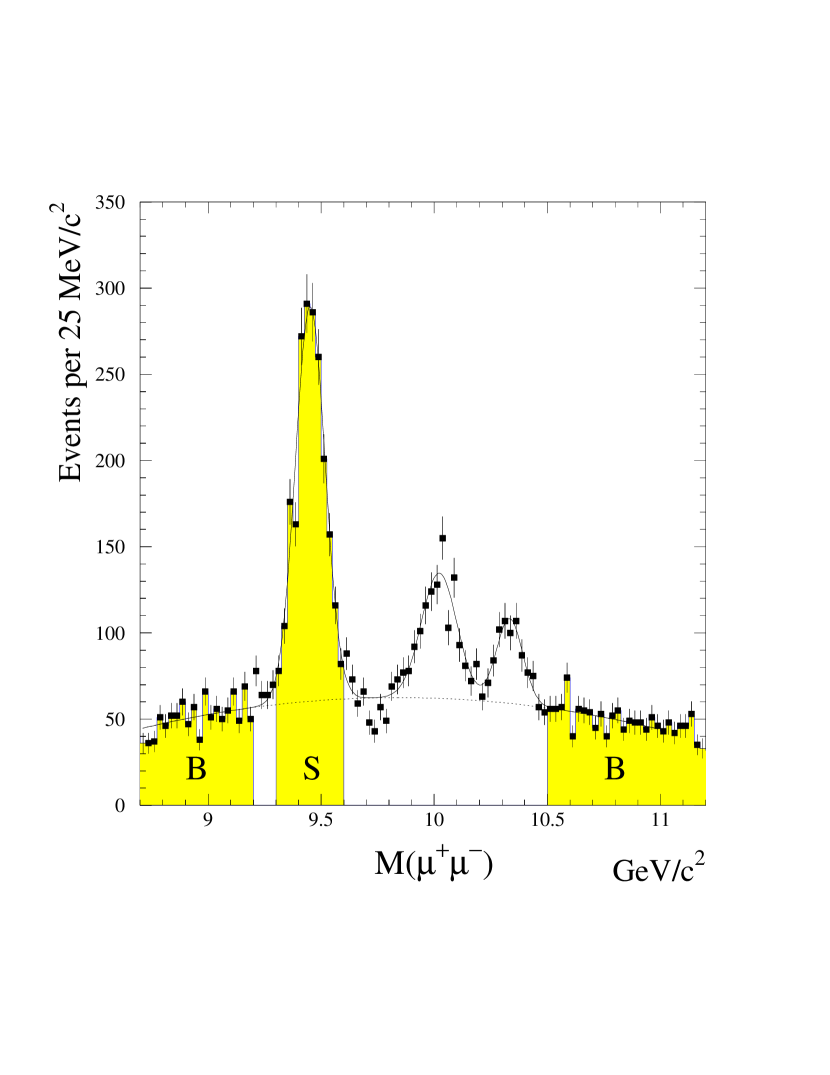
To identify ’s we select pairs of oppositely charged muon candidates with GeV/, and we require the pair to have GeV/. Since mesons do not originate from long lived particles [6] we constrain the muon tracks to originate from the primary interaction point to improve mass resolution. Fig. 1 is the resulting dimuon invariant mass distribution showing three peaks corresponding to the , and resonances. Due to the trigger and muon acceptance, the pseudorapidity of the muon pairs is limited to the central region, corresponding approximately to , where ln[tan()] and is the polar angle with respect to the beam axis. A muon pair is considered an candidate if its invariant mass is in the signal region defined by 9300 MeV 9600 MeV; this selection yields a sample of 2186 events. The number of background events in this sample is obtained by fitting the invariant mass distribution to a polynomial plus three Gaussians and integrating the function associated with the background in the signal region. The resulting number of mesons is .
Photon candidates are selected by demanding a transverse energy deposition of at least 0.7 GeV in a cell of the central electromagnetic calorimeter and a signal in the fiducial volume of the proportional chambers (CES) which are embedded in the calorimeter at a depth of six radiation lengths. The fiducial volume requirement ensures that the shower is fully contained in a cell. The location of the signal in the CES chambers and the event interaction point determine the direction of the photon momentum; its magnitude is the energy deposited in the calorimeter. We correct the photon energy for the energy lost in the material in front of the calorimeter based on a simulation of the detector response to photons. For low energy photons the average correction factor varies from 1.03 to 1.14 depending on the polar angle. We have verified that the simulation is trustworthy by comparing the simulated electron response with the response of electrons from photon conversions found in the data.
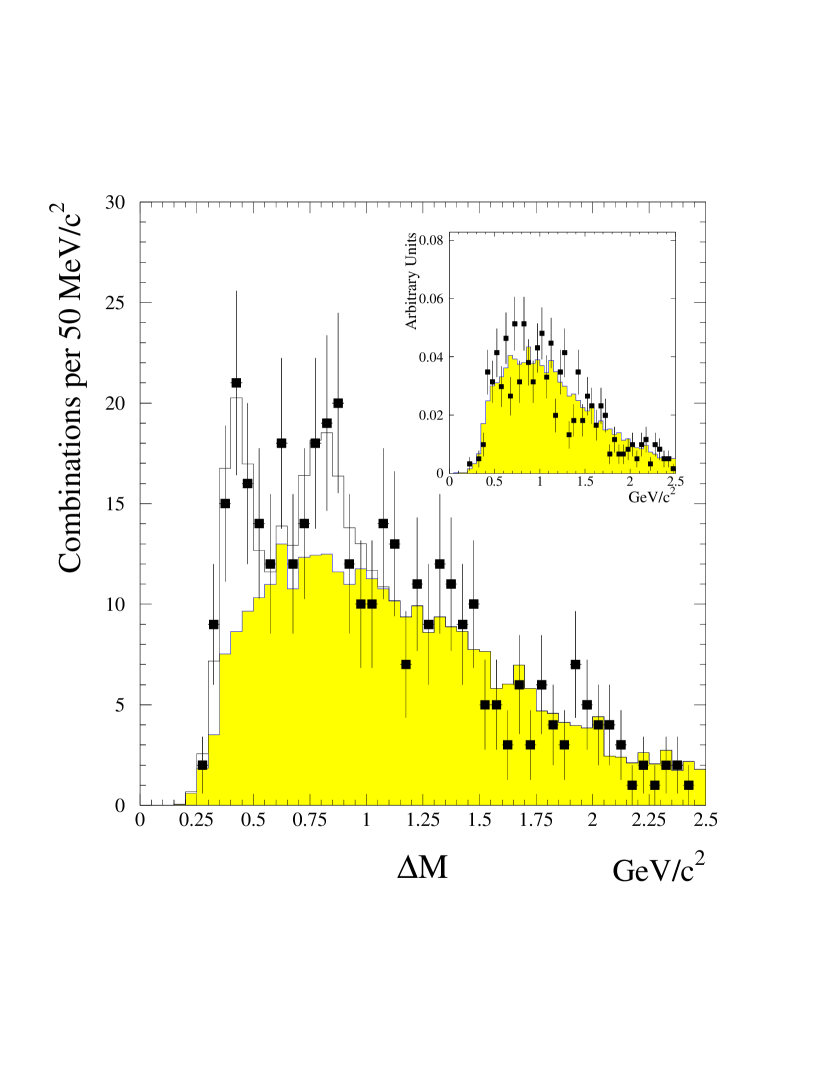
To reduce the combinatorial background resulting from multiple photon candidates per event we apply the following isolation requirements to the photon: a) no charged particle track should point to the photon cell, b) only one CES cluster should be associated with the cell, and c) the total electromagnetic energy in the 8 cells neighboring the photon must be less than 0.5 GeV. The is combined with all remaining photons within the 90 degree cone around the , and the invariant mass difference, , is calculated. The distribution is shown in Fig. 2. There are two well separated signals; their masses and widths are consistent with expectations based on a simulation of the radiative decays of the and mesons. The individual angular momentum states of the ’s (J=1,2) however, cannot be resolved.
The shape of the background resulting from combinations of the with photons unassociated with decays is obtained with a Monte Carlo method that uses candidate events as input. We consider as sources of photons: a) decays of that are not from or decays, b) decays, c) decays. These sources are simulated by replacing each charged particle in the event, other than the two muons, with a , or with probabilities proportional to 4:2:1. These proportions follow from isospin symmetry and the ratios , [7]. Uncertainties in these ratios are considered as sources of systematic uncertainty. The response of the detector to the photons resulting from the decay of these embedded neutral particles is calculated using a Monte Carlo simulation. Applying the reconstruction to these events results in a mass distribution that models the shape of the background. This model was tested by comparing the Monte Carlo distribution obtained using events in the mass sidebands of the peak, with the corresponding distribution obtained directly from the data where there should be no signal. The two distributions agree well as shown in the inset of Fig. 2. The number of signal events is determined by fitting the data distribution to the sum of the background distribution, with an unconstrained normalization, and two Gaussian functions associated with the signals. The mass resolution was fixed to the value calculated by the simulation (60 and 93 MeV). The fit results in and signal events for and respectively.
The fraction of mesons originating from decays is calculated according to the equation:
where and are the numbers of reconstructed and mesons respectively, is the probability to reconstruct the photon once the is found, and is the efficiency of the isolation cuts.
The photon acceptance, , is the product of the probability that the photon is within the fiducial volume and the reconstruction efficiency of the fiducial photon. The geometric acceptance is determined by using a Monte Carlo simulation where ’s are generated uniformly in pseudorapidity, and with a distribution equal to the measured spectrum [3]. The decay is generated with a uniform angular distribution in the rest frame. The decay is also generated uniformly in the rest frame and the trigger simulation is applied to the decay muons. Uncertainties associated with the spectrum used for the production of mesons and with the unknown polarization are considered as sources of systematic uncertainty. The photon reconstruction efficiency is obtained from the data by applying the photon requirements, except for the isolation cuts, to a sample of electrons from photon conversions selected using only tracking information. This efficiency is then corrected for the known differences in the detector response between photons and electrons. The reconstruction efficiency rises from 17% to 85% for photon with ranging from 0.7 GeV to 1.4 GeV. For GeV/, the photon acceptance is and for and respectively. The large difference is entirely due to the mass difference between the parent particles, resulting in different photon energies.
To study the effect of the isolation cuts we use a Monte Carlo method that uses candidate events as input. For each event, we generate a vector distributed according to the angular distribution of the photon, relative to the momentum, obtained simulating the decay . The probability that the isolation requirements are satisfied when applied to the calorimeter cell intercepted by the vector gives the cut efficiency. Since there are background events in the signal region, we measure the efficiency in the signal and sideband regions and derive the efficiency associated with mesons. The resulting efficiency is for and for ; the difference is due to the different kinematic of the decays. We assume that this efficiency, calculated from the inclusive sample of events, is applicable to the subsample of interest where the originates from a . This assumption is supported by a study using samples of events. We calculate using the inclusive sample of events, with the Monte Carlo method just described, and independently using a pure sample of from decay. The latter is the sample of reconstructed by requiring the photon to convert into an electron-positron pair. In this sample we measure the efficiency by applying the isolation cuts to the calorimeter cell which would have been hit by the photon, had it not converted [8]. This measurement yields an efficiency of ; the Monte Carlo calculation is in good agreement, yielding an efficiency of .
The systematic uncertainty on associated with the production and decay model is estimated by varying the shape of the spectrum as well as the decay angular distribution to account for fully polarized ’s; the uncertainty is for and for . The uncertainty in the determination of is for and for . This includes the effect of varying the and composition in our background model from 4:2:1 to all , and a variation of of the calorimeter energy scale used in the simulation. It also includes the effect of varying the resolution of the Gaussians used in the fit by , the uncertainty on the resolution. An uncertainty of for and for is associated with the estimation of the detector response difference between photons and electrons. An additional uncertainty arises from the statistical and systematic uncertainties associated with . We combine these uncertainties, assuming they are independent, into a total systematic uncertainty of for and for . The fractions of mesons, with GeV/, that come from and decays are and respectively.
To calculate the fraction of directly produced mesons we must estimate the fraction of ’s associated with sources other than and . We calculate the contribution due to using a Monte Carlo simulation of these decays normalized with the and cross section measured in this experiment [3]. We find that the fraction of ’s, with GeV/, from and decays, is and respectively. An additional contribution could be associated to the yet unobserved mesons. These states are predicted to lie below threshold and to decay radiatively to , and . An upper limit on the fraction of ’s from decays can be calculated with the conservative assumption that all mesons in our data come from decays. To estimate the contribution to , relative to , we have used a theoretical calculation of the radiative decay widths of the [9] and the detector simulation to take into account the effect of the trigger and kinematical cuts. Our estimate is that less than of the ’s, with GeV/, arise from decays. We derive the fraction of directly produced mesons according to the equation , where is the fraction of ’s from and . Systematic uncertainties on arise from uncertainties on the cross section and branching fractions. Our upper limit on the contribution from decays is also considered a systematic uncertainty, and is added in quadrature to the negative error. We find for GeV/.
In conclusion, we have measured the fraction of mesons originating from decays and derived the fraction of directly produced ’s. We find that of all mesons with GeV/ come from decays, from decays, and are directly produced. A calculation based on the Color Singlet Model [10] predicts a contribution of about and from and decays respectively. This measurement will allow the determination of the matrix elements associated with the production of , and mesons, thus providing information on color-octet contributions in bottomonium production.
We thank the Fermilab staff and the technical staffs of the participating institutions for their vital contributions. This work was supported by the U.S. Department of Energy and National Science Foundation; the Italian Istituto Nazionale di Fisica Nucleare; the Ministry of Education, Science and Culture of Japan; the Natural Sciences and Engineering Research Council of Canada; the National Science Council of the Republic of China; and the A. P. Sloan Foundation.
REFERENCES
- [1] F. Abe et al., Phys. Rev. Lett. 79, 572 (1997); ibid. 79, 578 (1997).
- [2] E. Braaten and S. Fleming, Phys. Rev. Lett. 74, 3327 (1995); G.T. Bodwin, E. Braaten and G.P. Lepage, Phys. Rev. D51, 1125 (1995).
- [3] F. Abe et al., Phys. Rev. Lett. 75, 4358 (1995).
- [4] P. Cho and A.K. Leibovich, Phys. Rev. D53, 150 (1996); ibid. D53, 6203 (1996).
- [5] F. Abe et al., Nucl. Instr. Meth. Phys. Res., Sect. A 271, 387 (1988).
- [6] F. Abe et al., Phys. Rev. D57, 5382 (1998).
- [7] T. Alexopoulos et al., Phys. Rev. Lett. 64, 991 (1990); M. Banner et al., Z. Phys. C27, 329 (1985).
- [8] The small conversion probability, and the lower available statistics, prevent us from applying this technique directly in the sample.
- [9] F. Daghighian and D. Silverman, Phys. Rev. D36, 3401 (1987).
- [10] A.K. Leibovich private communication. The calculation is based on the Color Singlet contribution, as described in [4].
Figure Captions
-
FIG. 1. The invariant mass distribution of muon pairs after the selection described in the text. Region S is the signal region, region B defines the sidebands. The solid line is the function used to fit the data, the dotted line is the function used to calculate the number of background events in the signal region.
-
FIG. 2. The mass difference distribution, , after the selection described in the text. The points represent the data. The shaded histogram is the background shape predicted by the Monte Carlo calculation. The solid line is the fit of the data to two Gaussian functions plus the background histogram. The inset shows the comparison between the distribution for dimuons in the sidebands (region B of Fig.1), and the corresponding one predicted by the Monte Carlo calculation; the two distributions are normalized to equal area and the vertical scale is arbitrary. The size of the bin is the same in both figures.