{Authlist} Sandro Palestini \Arefa \Instfoota1CERN, 1211 Geneva 23, Switzerland \Arefb
Direct CP violation is studied in two pion decays of the neutral kaon. Using data collected in the first beam period in 1997, the result for the parameter is .
\conferenceTalk presented at the EPS–HEP 99 Conference
Tampere, Finland, July 15–21, 1999
\AnotfootaOn behalf of the NA48 Collaboration:
Cagliari, Cambridge, CERN, Dubna, Edinburgh, Ferrara, Firenze, Mainz, Orsay,
Perugia, Pisa, Saclay, Siegen, Torino, Vienna, Warsaw.
\AnotfootbPermanent address: INFN, sez. Torino, 10125 Torino, Italy.
1 Introduction
Two pion decays of [1] established the violation of the symmetry CP. The main effect is due to a small component of CP = eigenstate in , which decays into two pions in a way similar to . Direct CP violation is found in the deviation from unity of the double ratio of decay rates:
First evidence for non–vanishing [2] was not supported by a different experiment [3], while a recent result [4] confirms the effect.
2 Experimental technique
In order to minimize the sensitivity to detector efficiency, to variations in beam intensity, and to accidental activity, the experiment [7] is designed to collect data simultaneously in the four channels , , , with the kaon energy in the interval 70–170 GeV. Two neutral beams are used: the beam is produced 126 m
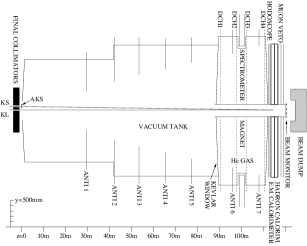

(corresponding on average to 21 lifetimes ) upstream of the nominal decay region. The beam is produced 6 m (one ) upstream of the decays region. The two beams, which are 68 mm apart as they pass the final collimator, converge and cross at the position of the electromagnetic (e.m.) calorimeter, 115 m downstream. Figure 1 shows the layout of the decay region and the main detector components. In order to minimize the difference in acceptance between and , only decays occurring in the upstream part are used, requiring , which corresponds to m on average.
The identification vs. is done looking for a time coincidence between a kaon decay measured in the main detector, and the detection of a proton in the beam directed to the production target. This is done by means of a finely segmented scintillation counter (tagger).


3 Event selection
Decays to are triggered in a 40 MHz pipeline, which computes the number of clusters, the total energy and the first and second momenta of the energy distribution in the calorimeter. This allows to select candidates with decay time . The trigger inefficiency is equal to . Off–line, the four clusters are paired to check that their invariant mass is compatible with the mass (resolution 1.1 MeV/). The corresponding distribution is shown in figure 2, where the difference between and is due to background from events, and is equal to .
In decays, a first level trigger is based on the scintillation hodoscope and the total energy measured by the calorimeters. This is down–scaled by two, and prompts the second level trigger, which uses drift chamber data to reconstruct vertices and compute invariant masses and decay times. The trigger efficiency is computed on samples of events from auxiliary, down–scaled triggers, and found equal to %. The off–line selection includes tighter cuts on invariant mass (2.5 MeV/ resolution) and transverse momentum. The background from semileptonic decays is further rejected using the muon hodoscope, and the ratio from the e.m. calorimeter and the spectrometer. The total background in the charged mode is (see figure 4).
Figure 4 shows the distribution of the time difference between the tagger (on the proton beam line) and the main detector, where the event time is measured by the e.m. calorimeter, and by the scintillation hodoscope, respectively for neutral and charged decays. The coincidence window is ns.
| 489 | 975 | 1,071 | 2,087 |
|---|
For , the rate of inefficiency (resulting in a being misidentified as a ) and of accidental coincidences (tagging a as ) are measured applying a selection on the vertex position (figure 4b). In the neutral mode, accidental tagging is measured in off–set time intervals, and the efficiency is obtained comparing the response of the calorimeter and the scintillation hodoscope in events with photon conversion or Dalitz decays (figure 4d). The double ratio is affected by the differences of the tagging errors between neutral and charged modes. The tagging inefficiency is about , with a difference of between the two modes. The rate of accidental tagging is 11.2 % on average, and is measured to be larger in the neutral mode.
Table 1 shows the number of events in each channel, after background and tagging corrections.
4 Systematic corrections and uncertainties
The difference between the decay distributions of and in the 3.5 accepted interval implies a difference in acceptance, which requires a correction to the measured value of . This effect is reduced by weighting the events used in the double ratio with a function of the proper decay time , proportional to the expected ratio of and decay rates. In the charged mode, residual differences in acceptance due to the beam geometries are minimized by a kinematical cut which rejects asymmetric decays. Finally, to be independent of the % difference in the energy spectra of the two beams, the analysis is performed in 5 GeV wide energy bins. The result of this procedure is an acceptance correction of , where most of the uncertainty is due to Monte Carlo statistics.
The effects of accidental activity are minimized by taking data simultaneously in the four channels. The rate of accidentals is measured to be equal for and events within the error of 1 %.

A small correction to is computed using a sample of events overlayed with data selected by random triggers, hence obtaining a sample with artificially higher accidental activity. Another small correction is due to beam scattering in the collimators of the beam.
Particular care is taken in the definition of the accepted decay range. For decays, the upstream end of the fiducial volume is defined by a veto–counter placed across the beam. The absolute energy scale of the e.m. calorimeter is tuned by checking the distribution of the reconstructed events against the position of the veto–counter (figure 5). For decays, the definition of the boundaries relies on an accurate knowledge of the energy scale, and of the linearity of the calorimeter response. Linearity and uniformity are studied with electrons from events continuously recorded, and with auxiliary data. The task is facilitated by the intrinsic high stability of the detector (the absolute energy scale was stable within throughout the entire run). The total contribution to the systematic error in is . In the charged mode, the fit to the veto–counter provides a check on length scales and alignment, quantified in a small systematic uncertainty.
Table 2 lists all the corrections applied to the double ratio. The uncertainties in the first four lines are dominated by the statistics of the control sample used in each study.
| Tagging errors | 18 | 11 | ||
| trigger efficiency | 9 | 23 | ||
| Acceptance | 29 | 12 | ||
| Accidental effects | 2 | 14 | ||
| background | 8 | 2 | ||
| background | 23 | 4 | ||
| Beam scattering | 12 | 3 | ||
| Energy scale and linearity | 12 | |||
| Charged vertex | 5 | |||
| Total correction | 57 | 35 |
5 Result
Figure 6 shows the result for in the different energy bins. Corrections for trigger efficiency, tagging, background and acceptance are included in each bin. The overall average is , where the first error is from the statistical fluctuation in the event samples, and the second is from the uncertainties in table 2. The three blank points at the extremes were studied as an additional check on systematic effects, and including them would not modify significantly the average value. The corresponding result for the parameter describing direct CP violation is:
or, combining the errors in quadrature, .


In figure 7 this new result is compared with some predictions based on the Standard Model [6] and other measurements [2, 3, 4]. The existence of direct CP violation in the neutral kaons is confirmed at the level of .
A more accurate knowledge of will be possible with data collected by NA48 in 1998, 1999, and 2000. An increase of the statistical samples by a factor is expected, together with a significant reduction in the systematic uncertainties.
References
- [1] J.H. Christenson et al. 1964 Phys. Rev. Lett. 13 138.
- [2] H. Burkhardt et al. 1988 Phys. Lett. B 206 169; G. Barr et al. 1993 Phys. Lett. B 317 233.
- [3] L.K. Gibbons et al. 1993 Phys. Rev. Lett. 70 1203.
- [4] H. Nguyen, these proceedings; A. Alavi-Harati et al. 1999 Phys. Rev. Lett. 83 22.
- [5] For a review, see G. Buchalla, these proceedings.
-
[6]
M. Ciuchini et al. 1995 Z. Phys. C 68 239;
A. Buras et al. 1996 Phys. Lett. B 389 749;
S. Bertolini et al. 1998 Nucl. Phys. B514 93.
See also T. Hambye et al. 1998 Phys. Rev. D 58 14017; and A. Soni, these proceedings. - [7] For more details on the detector and the analysis see V. Fanti et al. 1999 to appear on Phys. Lett. B (preprint CERN–EP/99–114, hep–ex/9909022).