We present a combined measurement of and the semileptonic branching ratio of b quarks in Z decays, , using double-tag methods. Two analyses are performed on one million hadronic Z decays collected in 1994 and 1995. The first analysis exploits the capabilities of the silicon microvertex detector. The tagging of b-events is based on the large impact parameter of tracks from weak b-decays with respect to the collision point. In the second analysis, a high- lepton tag is used to enhance the b-component in the sample and its momentum spectrum is used to constrain the model dependent uncertainties in the semileptonic b-decay. The analyses are combined in order to provide precise determinations of and :
Submitted to European Physics Journal
1 Introduction
The Z partial width into b-quark pairs is a relevant parameter for precision studies of the Standard Model (SM) [1]. Due to the high mass of the top quark and the large top-bottom weak coupling, the process receives sizable contributions from vertex corrections in the SM. The partial width is usually measured as its relative contribution to the hadronic width, , since many experimental and theoretical uncertainties cancel when forming this ratio. A deviation from the predicted SM value [2] would point to the existence of additional vertex corrections and therefore would be a signal for new physics.
The semileptonic branching ratio of b-hadrons, , can be expressed as:
| (1) |
where is the semileptonic decay width, being an electron or a muon, is the semileptonic component involving tau production and is the partial width from purely hadronic decays. Present measurements of at LEP [3] are in slight disagreement with model-independent measurements performed at the [4]. Z decays into b-quarks allow for the presence of b-baryons, which have a lower semileptonic branching fraction [5]. Measurements of the average number of charmed hadrons in b-decays, , provide an indirect estimate of the component. The measured values in the plane show that a discrepancy is still present between the and LEP results, as well as between the results and theoretical predictions [6].
In this paper, we present a combined measurement of and obtained with the L3 detector [7] at LEP. Features that distinguish the production of pairs from lighter quark production are: the long lifetime and hard fragmentation of b-flavoured hadrons, the large lepton momentum in semileptonic decays and the broad event shape caused by the large b-quark mass. The b-tagging method using lifetime information relies on data taken with the L3 Silicon Microvertex Detector (SMD) [8] in 1994-1995. The method using the characteristic semileptonic decays of b-hadrons relies on the good lepton identification and lepton energy resolution of the L3 detector. It requires lepton candidates with high momentum along and transverse to the direction of the associated jet, caused by the hard fragmentation and high mass of the decaying hadron.
2 Hadronic Event Selection
Hadronic events are selected with criteria similar to the ones used for the measurement of the total hadronic cross section [9]. The basic requirements used there select 99.15% of all hadronic Z decays with a background of 0.15% from other processes. A few additional requirements ensure a good performance of the b-tagging techniques on the events. These are:
-
•
The number of reconstructed tracks must be larger than four.
-
•
The polar angle of the thrust axis, , reconstructed from calorimetric information, must be within a fiducial region delimited by the barrel part of the detector, .
With these additional criteria, 970k hadronic events are selected from data, corresponding to an integrated luminosity of 71 pb-1.
3 Double-Tag Methods
An event is first split into two hemispheres defined by the plane normal to the thrust axis. Separately for each hemisphere, a set of criteria is applied in order to significantly enhance the purity of b-events. A hemisphere satisfying those criteria is declared to be “tagged”. The number of tagged hemispheres, , is related to the total number of hadronic events, , by the following equation:
| (2) |
where , and are the tagging efficiencies for b, c and light quark hemispheres. The parameter represents the ratio of cross sections . It is related to by . The correction takes into account the contribution from photon exchange [2]. The shift is also present for , but its effect on the measurement can be ignored for samples of reasonable b-purity. Therefore we will assume in the following. The number of events with both hemispheres tagged, , is given by:
| (3) |
where the additional factors , and , called hemisphere correlation factors, quantify residual correlations between the two hemispheres, which lead to a deviation from the simple power law reduction of the efficiencies.
Two parameters can be determined directly from data using the two experimentally measured ratios: and ; we choose to extract the parameters and . The relative rate of c production, , is constrained to its experimental value [12]. The efficiencies for quarks lighter than the b-quark, as well as the hemisphere correlation factors, are taken from the Monte Carlo (MC) simulation. However, only the factor is relevant to the analysis for samples of good b purity (). Typical values of the MC parameters for high purity tags are , and .
If a different b-tagging algorithm is applied, three additional equations can be derived:
| (4) | |||||
| (5) | |||||
| (6) |
where the new efficiencies and correlations have similar meanings to the efficiencies and correlations defined for the tag . The measurement can be performed by a global fit in which the values of the five ratios: , , , , are used to determine the values of , and , while , , , , , , are constrained to the values obtained from the MC simulation with their statistical and systematic errors.
The two tagging methods applied in this analysis are an impact parameter tag whose efficiency is denoted by and a leptonic tag with efficiency .
4 Impact Parameter Analysis
4.1 Track and Primary Vertex Reconstruction
The inner tracker of L3 reconstructs particle trajectories from hits in the two layers of double-sided silicon sensors of the SMD, up to 62 measurements in the central tracking chamber and two measurements in the Z chamber. These measurements are combined to obtain the five parameters characterising the trajectory, i.e. its curvature in the plane, its transverse distance of closest approach (DCA) to the vertex, its azimuthal angle at the DCA, its polar angle and the Z coordinate at the DCA. Their covariance matrix is determined from the estimated single-point resolution function. The most important parameters for this analysis are the DCA and its error, . Small biases in the DCA itself are removed by recalibrating the mean DCA value as a function of the azimuthal angle of the track and as a function of the track position inside a sector of the central tracking chamber [13]. The DCA error is recalibrated using tracks with a high probability of coming from the primary vertex. For these, the width of the DCA distribution for tracks with high momentum, where multiple scattering is negligible, is used to determine a factor that multiplies the calculated DCA error from the track fit. The factor is found to be close to one, in agreement with an analysis performed using high momentum tracks from , and events. Typical values for are m and m for tracks with and without SMD information, respectively. In addition, the contribution from multiple scattering, not included in the error calculated in the track fit, is estimated from the dependence of the distribution width on transverse momentum. It is found that the additional multiple scattering error is m for tracks with a hit in the inner SMD layer and m for tracks without such hits, with measured in GeV.
The average position of the LEP luminous region inside L3 is reconstructed using tracks collected in hadronic events. The position and its error are averaged over 200 consecutive hadronic events, in order to follow drifts in the beam position. The result, called the beam-spot position, is used as a constraint in the reconstruction of the primary vertex in each event, weighted by the r.m.s. width of the luminous region in the horizontal (m) and vertical (m) directions.
For the reconstruction of primary vertices, tracks are selected using the following criteria:
-
•
A track must consist of at least 20 hits in the central tracking chamber.
-
•
At least one hit in the inner layer of the SMD must be included in the track fit.
-
•
The DCA to the primary vertex has to be less than 1 mm.
-
•
The significance of the DCA, defined by the ratio of the DCA and its error, has to be less than five.
-
•
The transverse momentum of the track has to be greater than .
The procedure uses an iterative method which starts from the beam-spot position as an initial estimate of the primary vertex position. At each step of the iteration, the vertex is calculated with all tracks selected for that step. If the probability of the vertex is less than 0.05, the track with the largest contribution to the is removed and the vertex is recalculated with the remaining tracks. This procedure is repeated until the probability of the vertex is at least 0.05 or only three tracks are left. At each step, the beam-spot position is used as a constraint. With this procedure, a primary vertex is reconstructed in 99.5% of the selected events. This efficiency is found to be independent of the quark flavour within one per mill, using MC simulation.
The uncertainty on the vertex position depends on the azimuthal angle of the event thrust axis and on the number and quality of the tracks retained for its determination. The average uncertainty in the horizontal direction is m for light-quark events and m for b-events. The worse resolution for b-events is due to the unavoidable inclusion of b-decay tracks in the vertex determination. The vertical position of the primary vertex is known with high precision (m) due to the small vertical width of the beam spot.
4.2 Heavy Quark Tagging Using Impact Parameters
The information from all tracks in a hemisphere is combined to form a discriminating variable, , which describes the likelihood that all tracks come from the primary vertex. The sensitive single-track quantity used for constructing is the impact parameter, defined as the absolute value of the track’s DCA with a sign that is positive if the track intersects the direction of the associated jet in the direction of the jet’s total momentum, negative if it intersects opposite to that direction. The angular resolution for the jet direction is 40 mrad.
Tracks retained for the determination of have to fulfil the following quality criteria:
-
•
The angle, , between the track and its associated jet axis must satisfy .
-
•
The track should have at least 30 hits spanning over a distance of at least 40 wires in the central tracking chamber.
-
•
The DCA to the primary vertex has to be less than 1.5 mm for tracks with SMD information. This cut is increased to 3 mm for tracks without SMD hits.
-
•
The angular separation of the track from the anode and cathode planes of the central tracking chamber, where the resolution is worse, must be more than 11 mrad.
-
•
If a track uses no hits from the SMD, at least 2 out of 8 hits from the inner portion of the central tracking chamber should be used in the track fit.
The retained tracks are then grouped into different classes according to the pattern of the associated SMD hits. Each class corresponds to a different resolution function for the impact parameter measurement. The repartition among classes obtained in data is compared to the MC simulation. The proportions agree in absolute value to within a percent.
The significance, , is defined as the ratio of the impact parameter to its error. The total impact parameter error is composed of the error from the track fit, the multiple scattering contribution and the contribution of the primary vertex error, all determined according to the procedure described in Section 4.1.
The discriminant variable is constructed on the basis of a resolution function, , which describes the probability that a track which comes from the primary vertex is measured to have an apparent impact parameter significance . The probability, , of finding a significance greater than the measured one, , is given by:
| (7) |
The combined probability for the tracks in the hemisphere is . The probability, , of measuring a value greater than is:
| (8) |
We define the discriminant variable as . A tagged hemisphere must have a value of above some minimum value. This definition of the discriminant cut ensures that the amount of background from hemispheres which have tracks consistent with the primary vertex is , independent of .
The resolution function is determined for each class by a fit to the significance distribution of all tracks with negative significance in data. The r.m.s. width of the significance distribution in each class is compatible with 1.0, but the distributions have substantial tails. Therefore, a model of the resolution function is constructed as a sum of two Gaussian functions and an exponential tail. The same resolution functions are used for data and MC. Special care is taken to ensure that the simulation takes into account the multiple scattering and the time dependence of tracking chamber wire inefficiencies and wire resolutions as a function of the drift distance, SMD noise and SMD strip inefficiencies. Only small final adjustments are needed in order to reflect the behaviour of the data. The uncertainty on the adjustment will be used later for the determination of the systematic error due to resolution effects. Figure 1 shows the significance distribution for all tracks. For negative values of the significance, the good agreement between data and MC shows that the resolution effects are well understood. The positive part of the significance distribution is sensitive to the value of . The data shows agreement with the MC distribution, which corresponds to a value of .
The resolution function determined from data is used to calculate the track probability . The distribution of the hemisphere discriminant is shown in Figure 2, together with the MC expectation and its components, in terms of primary quark flavours. The agreement is satisfactory for the bulk, as well as the tail of the distribution, and the tagging power of the discriminant is clearly exhibited.
The efficiency for b-tagging and the purity of the obtained sample can be varied by changing the cut on the discriminant variable. We obtain a b-tagging efficiency as a function of the sample purity as shown in Figure 3 for data and for the MC simulation. There is a residual difference between the efficiency observed in data with respect to the one predicted by MC, which never exceeds 2.5%. It is independent of the discriminant cut value over a wide range and it is consistent with the estimated statistical and systematic errors. For the discriminant cut used in the double-tag analysis () we obtain , whereas the MC estimate is , where the systematic error is dominated by the b-physics modelling uncertainties. These uncertainties do not propagate to an error in since the MC efficiency is not used in its determination.
4.3 Systematic Errors
4.3.1 Tracking Resolution
The tracking resolution function is determined from data alone. Its statistical accuracy is such that it causes a negligible uncertainty on the measurement, but a wrong description in the MC simulation influences the values of auxiliary parameters like the efficiencies for lighter quarks and the hemisphere correlation factors. In order to estimate the systematic error due to uncertainties in tracking resolution, two MC samples are used, one with the final adjustment, , and the other corresponding to the 1-sigma resolution uncertainty, . The sample is found to produce a stable value of as a function of the discriminant cut within statistical and systematic errors. is defined by the change in the final adjustment that leads to a behaviour of which is inconsistent with a constant value by one standard deviation of the observed fluctuations. The differences in , and predicted by the two MC samples are propagated as an estimate of the error due to tracking resolution uncertainties.
4.3.2 Systematic Error from Background Modelling
MC simulation is needed to determine , , and . For the charm efficiencies an accurate knowledge of production and decay properties of the charmed hadrons is important, since the different species, , , and , have lifetimes varying in the range of 0.2 to 1.1 ps. Modelling uncertainties in arise from the residual contamination by light hadrons with long lifetime, and , as well as the probabilities for gluon splitting into and pairs. Modelling uncertainties of the b-hadron properties only influence the correlation factor . They are estimated by varying the mean value of the B energy fraction , the charged decay multiplicity and the average lifetime of b-hadrons.
The variation of the parameters is performed following the suggestions of References [14, 15, 16]. The parameter ranges are listed in Table 1. Tables 2 and 3 show the complete list of systematic uncertainties on and due to the propagation of these modelling uncertainties. The uncertainties on are discussed in more detail in the following Section.
| Error source | Variation |
|---|---|
| [12] | |
| Bottom fragmentation parameter: | |
| [17] | |
| Bottom decay parameters: | |
| B lifetimes | ps [15] |
| B decay multiplicity | [16] |
| Fractions in events: | |
| [16] | |
| [16] | |
| [16] | |
| Gluon splitting in events: | |
| [16] | |
| [16] | |
| Charm decay parameters: | |
| lifetime | ps [12] |
| lifetime | ps [12] |
| lifetime | ps [12] |
| lifetime | ps [12] |
| D decay multiplicity: | |
| 0 prong | [16] |
| 4 prong | [16] |
| 6 prong | [16] |
| 1 prong | [16] |
| 5 prong | [16] |
| 1 prong | [16] |
| 5 prong | [16] |
| multiplicity | [18, 12] |
| Charm fragmentation parameter: | |
| [16] | |
| Fractions in events: | |
| and | JETSET 10% |
| Gluon splitting in events: | |
| [16] | |
| [16] |
4.3.3 Systematics from Hemisphere Correlations
Systematic errors on are due to uncertainties in the MC simulation. In addition to resolution and modelling effects, taken into account as described in Sections 4.3.1 and 4.3.2, reconstruction algorithms and detector inhomogeneities may create correlations between the tagging efficiencies of both hemispheres.
A possible source of correlation can be quantified by choosing a variable for each hemisphere which could be influenced by tagging the opposite hemisphere. For a particular cut on the hemisphere discriminant we then define three distributions:
-
•
The normalised distribution of for all hemispheres, .
-
•
The single-hemisphere tagging efficiency as a function of , .
-
•
The normalised distribution of in a co-tagged hemisphere, . A co-tagged hemisphere is the one opposite to a tagged hemisphere, regardless of whether it is itself tagged.
We then form a coefficient, , reflecting the correlation characterised by for a particular discriminant cut:
| (9) |
The value implies that there is no correlation between hemispheres from effects characterised by . A value indicates a positive correlation, an anti-correlation.
The analysis is performed on several candidate variables . For a MC sample, the sum of the separate components is then compared to the total correlation factor . A reasonable agreement between them means that the relevant sources of correlation have been identified. The following sources are found to be relevant:
-
•
Angular effects: Inefficient regions of the detector can lead to correlations due to the back-to-back nature of hadronic events. This is estimated using and , where and are the polar and azimuthal angles of the most energetic jet in each hemisphere.
-
•
Vertex effects: Both hemispheres use the same primary vertex, which is determined as explained in Section 4.1. The main effect arises because the primary vertex fit may also include tracks coming from b-hadron decays (negative correlation). To quantify the effect, two independent primary vertices are constructed separately using the tracks assigned to each hemisphere. The variable is taken to be the distance in the plane between the vertex in each hemisphere and the overall event vertex. Its sign is given according to how far each hemisphere vertex moves when the beam-spot position constraint is removed: a positive sign is assigned to the hemisphere with the larger movement.
-
•
QCD effects: The presence of hard gluons in the event can influence the tagging efficiency of both hemispheres by taking energy away from the primary quarks (positive correlation) or, in an extreme case, by pushing both quarks into the same hemisphere (negative correlation). This effect is modified by reconstruction and detector resolution effects. The signed event thrust, , is used as a probe. A positive sign is assigned to the hemisphere with the higher energy jet.
The dominant components are those due to gluon radiation and vertex bias. There is a remaining discrepancy between the linear sum of the correlation components due to the above three sources and the total observed correlation factor. That is expected, due to the interference between the sources considered and to additional sources of less relevance. For instance, and vertex effects are intrinsically correlated, since the primary vertex uncertainty is affected by the -dependent beam spot size.
To test the quality of the MC correlation simulation, a 70% b-purity sample is selected in data by requiring the event discriminant to be greater than 1.5. The same cut is applied to the MC sample. The correlation coefficients are calculated for each of the three sources in data and MC. The differences are taken as the systematic uncertainties on the correlation term and propagated through to a systematic error on . The complete list of systematic uncertainties on is shown in Table 4.
| Error source | |
|---|---|
| MC Statistics | |
| Track Resolution | |
| fraction | |
| fraction | |
| fraction | |
| lifetime | |
| lifetime | |
| lifetime | |
| lifetime | |
| Decay multiplicities: | |
| 1-prong | |
| 5-prong | |
| 0-prong | |
| 4-prong | |
| 6-prong | |
| 1-prong | |
| 5-prong | |
| multiplicity | |
| Total |
| Error source | |
|---|---|
| MC Statistics | |
| Track Resolution | |
| K0 and Hyperons | |
| Total |
| Error source | |
|---|---|
| MC Statistics | |
| Track Resolution | |
| Vertex bias | |
| correlations | |
| correlations | |
| Hard gluon emission | |
| B fragmentation | |
| B lifetimes | |
| B decay multiplicity | |
| Total |
4.4 Results
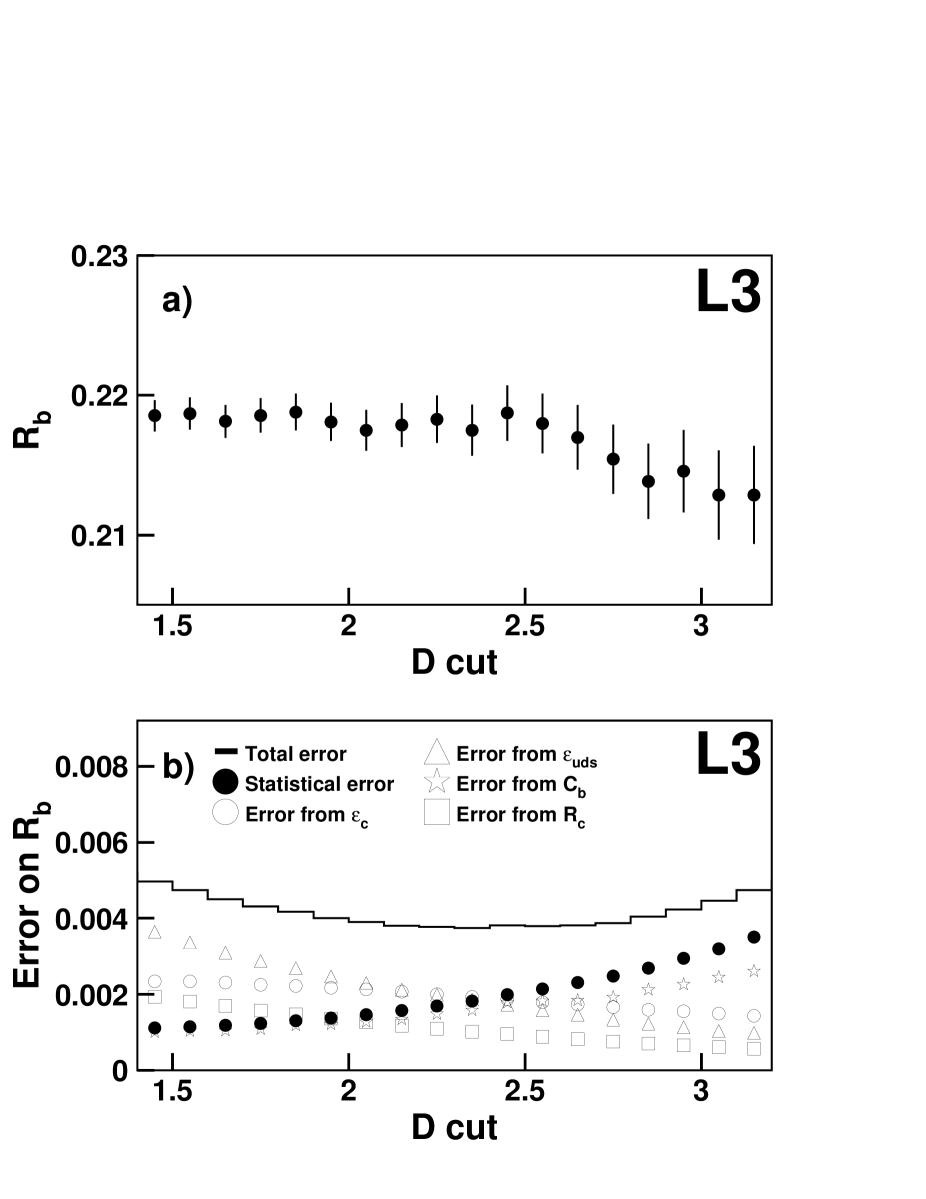
Systematic errors on , and , are propagated into the double-tag measurement. Figure 4a) shows the measured value of as a function of the discriminant cut in the region around the minimum of the total uncertainty. The value is stable within the estimated statistical and systematic errors. Figure 4b) shows the statistical and systematic errors on in the same range. The minimum of the total error occurs at , which defines the central value of our measurement. For this cut, 118817 tagged hemispheres and 11705 double-tagged events are selected from a sample of 968964 hadronic events.
The value of is estimated by MC to be . A breakdown of the error is shown in Table 2. Since the individual charm lifetimes are measured very accurately, the fractions of the different species are the major error contributions. Among all the charmed hadrons the properties lead to the dominant errors because it has the longest lifetime.
The value of is estimated to be . The different error contributions are shown in Table 3. The systematic error is dominated by the uncertainty in the rate of light-flavoured hadrons with long lifetime.
The value of the correlation coefficient is . The different error contributions are listed in Table 4. Primary vertex effects are the dominant source of uncertainty.
The measured values of and are:
| (10) | |||||
| (11) |
The detailed list of contributions to the error on is given in Table 5. The sources internal to L3 are separated from the ones in common with other experiments.
| from Internal Error Sources | |
|---|---|
| MC statistics | |
| Resolution | |
| Vertex effects on | |
| effects on | |
| effects on | |
| Total Internal | |
| from External Error Sources | |
| uncertainty | |
| fraction | |
| fraction | |
| fraction | |
| lifetime | |
| lifetime | |
| lifetime | |
| lifetime | |
| 1-prong decay multiplicity | |
| 5-prong decay multiplicity | |
| 0-prong decay multiplicity | |
| 4-prong decay multiplicity | |
| 6-prong decay multiplicity | |
| 1-prong decay multiplicity | |
| 5-prong decay multiplicity | |
| multiplicity | |
| in events | |
| in events | |
| and production | |
| in events | |
| in events | |
| B fragmentation | |
| B lifetimes | |
| B decay multiplicity | |
| Hard gluon fragmentation | |
| Total External | |
5 Lepton Analysis
The selection of leptons with high momentum and high transverse momentum with respect to the closest jet is applied to the set of events passing the hadronic selection. It requires a good performance of the central tracking detectors and a restriction to the angular region: .
5.1 Lepton Identification
An electron is identified as a cluster in the electromagnetic calorimeter matched to a track in the central tracking chamber. The requirements are:
-
•
The cluster in the electromagnetic calorimeter must have more than 5 crystals with signal, more than 90% of the energy contained in a matrix and a shower shape consistent with the deposit of an electromagnetic particle.
-
•
The cluster energy must be greater than .
-
•
The cluster must be matched in azimuthal angle (5 mrad) and in energy (within 4 standard deviations) to a track in the central tracking chamber.
-
•
The energy deposited in the hadron calorimeter in a cone of half opening angle of around the cluster direction must be less than .
A muon is identified as a track in the muon chambers which satisfies the following requirements:
-
•
The muon track is required to have track segments in at least two of the three layers of the chambers which measure the trajectory in the plane transverse to the beam. In addition, it must have at least one of the two hit segments in the muon chambers which measure longitudinal coordinates.
-
•
The measured muon momentum must be greater than .
-
•
The track must point back to the interaction vertex region within 3 standard deviations of the uncertainty in the extrapolation. This uncertainty takes into account multiple scattering and energy losses in the calorimeters.
-
•
The muon track must be matched to a track in the central tracking chamber.
5.2 Heavy-Quark Tagging Using High- Leptons
Hemispheres containing high-energy leptons are selected as b-candidates. Due to the hard b-fragmentation and the large b-mass, a higher b-purity sample is obtained as the transverse momentum of the lepton with respect to the b-jet, , increases. The distribution of this variable is shown in Figure 5. Very good agreement between data and simulation is observed. A cut of is used for the double-tag measurement.
5.3 Systematic Errors
5.3.1 Lepton Selection Uncertainties
Uncertainties in the lepton selection are expected if electromagnetic clusters, punch-through and tracking resolutions are not well reproduced in the simulation. Since the MC simulation takes into account the behaviour of the detector as a function of time, only a small uncertainty is expected. It is estimated by studying the statistical consistency of the measured values as a function of the cut.
5.3.2 Systematics from Background Modelling
The charm efficiencies depend on the assumptions for the overall rate and properties of semileptonic c-decays. The uncertainty on these assumptions is taken into account by varying the semileptonic branching fraction, , the charm fragmentation, , and the semileptonic decay model within the ranges suggested in Reference [16]. The parameter ranges are summarised in Table 6. The uncertainty on is estimated by selecting a sample enriched in light quarks. Both hemispheres in the event must satisfy a cut on the discriminant variable . In this sample a maximum discrepancy of is found between data and MC for the number of leptons with momentum below . This discrepancy is translated into a relative error in .
5.3.3 Systematics from Hemisphere Correlations
The correlation between the semileptonic decay properties of the two hemispheres is expected to be very small. The value obtained for from the MC simulation is , consistent with no correlation.
Evidence of non-negligible correlation effects have been looked for. The following quantity is defined:
| (12) |
where and are values of physical variables in the two hemispheres of the event. We have used the lepton momentum and transverse momentum, since they are the relevant variables of the analysis. The values obtained for are consistent with unity within the statistical errors, independent of the cut applied and of restrictions in the detector acceptance. Since no evidence of correlation is found, only the MC statistical uncertainty is assigned as a systematic error.
5.4 Results
For a cut of , 49308 hemispheres are tagged and 1927 events are double-tagged on a sample of 968964 hadronic events.
The value of is found to be . The error is dominated by the background modelling of semileptonic charm decays. The value of is determined to be , and the value of the correlation coefficient is .
Taking into account statistical and systematic errors we obtain:
| (13) | |||||
| (14) |
The different contributions to the systematic error on are shown in Table 7.
| Sources of systematics | Error on |
|---|---|
| MC statistics | |
| Lepton Identification | |
| Semileptonic Decay Model | |
| Light quark uncertainties | |
| Total | 0.0045 |
| from Internal Error Sources | |
|---|---|
| MC statistics | 0.00081 |
| Tracking Resolution | 0.00042 |
| Vertex effects on | 0.00079 |
| effects on | 0.00003 |
| effects on | 0.00013 |
| Lepton identification | 0.00010 |
| Correlation between tags | 0.00079 |
| Total Internal | 0.00145 |
| from External Error Sources | |
| fraction | |
| fraction | |
| fraction | |
| lifetime | |
| lifetime | |
| lifetime | |
| lifetime | |
| 1-prong decay multiplicity | |
| 5-prong decay multiplicity | |
| 0-prong decay multiplicity | |
| 4-prong decay multiplicity | |
| 6-prong decay multiplicity | |
| 1-prong decay multiplicity | |
| 5-prong decay multiplicity | |
| multiplicity | |
| Semileptonic Decay Model | |
| in events | |
| in events | |
| and in uds events | |
| Light quark uncertainties | |
| in events | |
| in events | |
| B fragmentation | |
| B lifetimes | |
| B decay multiplicity | |
| Hard gluon fragmentation | |
| Total External | 0.00244 |
6 Measurement of
For an impact parameter discriminant cut of and a lepton cut of , 9368 events are selected with a lepton tag and an impact parameter tag in opposite hemispheres. The correlation factor between the tags is , where the systematic error takes into account detector and reconstruction effects.
A combined fit using Equations 2-6 for the impact parameter and lepton tags is performed. The MC input efficiencies and correlation factors with their uncertainties are included as constraints in the fit. The final results are:
| (15) | |||||
| (16) | |||||
| (17) |
The statistical error of the measurement is determined by fixing the MC efficiencies and correlations to their fitted values. The systematic uncertainties are propagated according to the covariance matrix of the fit. Charm, light-quark and b-quark systematics are uncorrelated, except for the case of the charm fragmentation, which correlates the impact parameter and lepton tags. All systematic error contributions to the measurement are shown in Table 8.
7 Measurement of
The efficiency , given by Equation 17, quantifies the fraction of high leptons in b-jets. Therefore, it is sensitive to the value of the semileptonic branching ratio of b-hadrons at LEP. In the reference MC with we find:
| (18) |
The systematic error on is almost independent of b-quark model assumptions, since double-tag methods are used. The dependence on is experimental, due to the simultaneous determination of both parameters (the statistical correlation is ). The central value and the systematic uncertainty are determined for the set of parameters and variations shown in Table 9. The dominant systematic errors in are those due to detector inefficiencies and to semileptonic decay modelling uncertainties. They will be discussed in the next subsections.
For different values of the branching ratio we find a linear dependence of :
| (19) |
7.1 Detector Inefficiencies
Time-dependent inefficiencies of the L3 detector are expected to be reproduced in the simulation within a few percent accuracy. In order to estimate possible extra sources of uncertainty not taken into account in the MC, we have used large data samples of and . The samples are selected by requiring at least one lepton with high energy () and applying the same cuts used for the sample described in Section 5, except for the transverse momentum cut. The ratio of the number of one-lepton events to the number of two-lepton events is determined for both data and MC including backgrounds. The comparison suggests extra inefficiencies of and for the electron and muon samples, respectively. The errors are only statistical. These numbers are determined under the assumption that inefficiencies in both hemispheres of the event are uncorrelated. This is confirmed by the agreement at the percent level between the total cross sections measured in data and MC, which can be largely affected by simultaneous losses of the two leptons in an event.
Additional checks at lower lepton energy (, ) confirm the extra inefficiencies observed at high energy. Since the discrepancy is larger for muons, an additional cross check is performed. A sample is selected on the basis of the expected deposition in the hadron calorimeter for minimum ionising particles. The percentage of muons found in this sample is compared to MC, leading to an estimated extra inefficiency of . When restricted to muons of low energy, we obtain .
As a consequence of this study the following relative losses have been added in the simulation: for electrons and for muons. The reference value in Equation 18 already takes into account these acceptance corrections.
| Parameter | Variation | Change in (%) |
| Detector efficiency | ||
| Detector efficiency | ||
| Decay parameters in | ||
| Decay scheme in | ||
| [17] | ||
| [15] | ||
| [16] | ||
| b-lifetime | ps [15] | |
| [16] | ||
| [16] | ||
| Total | 0.11 |
7.2 Modelling Uncertainties
The largest source of systematic error comes from the uncertainties in the modelling of the decay. The MC simulation uses a model which can be approximately described by the ACCMM [20] parametrisation with a c-quark mass , a Fermi momentum inside the B meson , and a mass of the spectator quark . In order to study the sensitivity to modelling assumptions, a sample enriched in b-quarks is selected from data by applying an impact parameter discriminant cut of on both event hemispheres and requiring the presence of at least one lepton with . The estimated b-purity of the 14929 selected events is 97.5%.
Lepton hemispheres are classified in bins of () in the plane. The decay spectra in the context of the ACCMM model are generated as a function of and , and the MC distributions are modified accordingly. A binned likelihood function is defined:
| (20) |
where and are the number of events in the th bin for data and MC, respectively. Only the shape is considered, that is, the total number of events in MC is normalised in order to agree with the total number in data. The data itself has no sensitivity for a simultaneous determination of and . On the other hand, different values of and are found to reproduce the data with similar quality. Fixing the value of the c-quark mass to leads to a minimum value of , where the error is only statistical. Fixing the mass to moves the central value to , but leads to the same value of . The quantity , where is the value of the likelihood in MC at the minimum, should behave as a function. Its value is 1159.2 for 1274 degrees of freedom. The previous fit is repeated without a cut on , with the result and a of 1235.7 for 1340 degrees of freedom. A subsample with a harder lepton spectrum, , gives , with a similar fit quality. If no impact parameter discriminant cut is applied, the value obtained is still statistically consistent: .
Several systematic effects are studied. A 1% scale shift in the b-fragmentation parameter changes the value of by . A deterioration of the jet angular resolution by 20 mrad (half of the estimated resolution) leads to a shift of . Uncertainties in the momentum resolution give a smaller effect. We estimate a total systematic uncertainty of , yielding:
| (21) |
Alternatively, the fit is performed in the context of the ISGW∗∗ model [21]. Using the D∗∗ fraction as a free parameter, we obtain:
| (22) |
with a value for 1274 degrees of freedom. The ISGW∗∗ model with this central value leads to a slightly different value of . The difference is propagated as a systematic error due to the uncertainties in the modelling scheme.
Finally, we perform a direct unfolding of the semileptonic decay momentum spectrum in the centre-of-mass frame of the b-hadron. For b-quarks, the original MC spectrum in the range is divided into 12 bins. The relative contents of these bins are adjusted in order to make the simulated and the observed spectra agree. The results are shown in Figure 6. There is good agreement with the optimal ACCMM, ISGW∗∗ spectra favoured by our data.
7.3 Results
We use Equation 19 for the determination of . Taking into account all the statistical and systematic errors on and , we obtain:
| (23) |
Separate analyses, using only electron or muon tags, give consistent results within their statistical errors. The full breakdown of systematic errors is shown in Table 10. The total systematic error due to modelling uncertainties on is . This error would increase to if the range of to is used [14]. However, this larger variation is excluded by our data at the confidence level. The result represents an improvement on our previously published value [22] and is consistent within errors, taking into account the different data samples, the different central values used in modelling and the fact that some systematic uncertainties are largely uncorrelated between the two measurements.
| Parameter | (%) |
|---|---|
| MC statistics | |
| detector efficiency | |
| detector efficiency | |
| Decay parameters in | |
| Decay scheme in | |
| b-lifetime | |
| Uncertainty on | 0.04 |
| Uncertainty on | 0.09 |
| Uncertainty on | 0.10 |
| Uncertainty in () | 0.06 |
| Uncertainty in ( in uds) | 0.01 |
| Uncertainties on | 0.08 |
| Total | 0.30 |
The semileptonic branching ratio for mesons containing a b-quark is extracted as follows:
where is the fraction of b-baryons in Z decays and is the semileptonic branching ratio in b-baryon decays. Assuming that all B-mesons have the same semileptonic branching ratio, our result is:
| (25) |
8 Conclusion
Using double-tag methods on one million hadronic Z events collected in 1994 and 1995, we determine the values of and of the semileptonic branching ratio of b-quarks, . Two methods of tagging the presence of b-quarks are used. The first method exploits the capabilities of the silicon microvertex detector and is based on the large impact parameter of tracks from weak b-decays with respect to the collision point. In the second method, a high- lepton tag is used to enrich the b-content of the sample and its spectrum is used to constrain the model dependent uncertainties in the semileptonic b-decay. We measure:
| (26) | |||||
| (27) |
Acknowledgments
We wish to express our gratitude to the CERN accelerator divisions for the excellent performance of the LEP machine. We acknowledge the contributions of the engineers and technicians who have participated in the construction and maintenance of this experiment.
References
- [1] S.L. Glashow, \NP22 (1961) 579; S. Weinberg, \PRL19 (1967) 1264; A. Salam, “Elementary Particle Theory”, Ed. N. Svartholm, Stockholm, Almqvist and Wiksell (1968), 367.
- [2] D. Bardin \etal, ”A Semianalytical Program for Fermion-Pair Production in Annihilation”, Preprint DESY 99-070; D. Bardin \etal, \ZfPC 44 (1989) 493; D. Bardin \etal, \NPB 351 (1991) 1; D. Bardin \etal, \PLB 255 (1991) 290.
- [3] The LEP Collaborations: ALEPH, DELPHI, L3, OPAL, the LEP Electroweak Working Group and the SLD Heavy Flavour and Electroweak Groups, “A Combination of Preliminary Electroweak Measurements and Constraints on the Standard Model”, CERN-EP/99-15, 8 February 1999.
- [4] ARGUS Collaboration, H. Albrecht \etal, Phys. Lett. B 318 (1993) 397; CLEO Collaboration, B. Barish \etal, Phys. Rev. Lett. 76 (1996) 1570.
- [5] OPAL Collaboration, K. Ackerstaff \etal, Z. Phys C 74 (1997) 423; ALEPH Collaboration, R. Barate \etal, Eur. Phys. J. C 5 (1998) 205; P. Gagnon, Proceedings of the XXIX International Conference on High Energy Physics, 23-29 July 1998, UBC, Vancouver, B.C., Canada.
- [6] M. Neubert, Proceedings of the International Europhysics Conference on High Energy Physics, 19-25 August 1997, Jerusalem, Israel.
-
[7]
L3 Collaboration, B. Adeva \etal, Nucl. Inst. and Meth. A 289 (1990) 35;
L3 Collaboration, O. Adriani \etal, Phys. Rep. 236 (1993) 1. - [8] M. Acciarri \etal, Nucl. Inst. and Meth. A 351 (1994) 300.
- [9] L3 Collaboration, M. Acciarri \etal, Z. Phys. C 62 (1994) 551.
-
[10]
T. Sjöstrand, Comp. Phys. Comm. 39 (1986) 347;
T. Sjöstrand and M. Bengtsson, Comp. Phys. Comm. 43 (1987) 367. - [11] The L3 detector simulation is based on GEANT Version 3.14; see R. Brun \etal, GEANT 3, CERN DD/EE/84-1 (Revised), September 1987 and the GHEISHA program (H. Fesefeld, RWTH Aachen Report PITHA85/02, 1985) for the simulation of hadronic interactions.
- [12] C. Caso \etal, “Review of Particle Physics”, Eur. Phys. J. C 3, (1998) 1.
- [13] L3 Collaboration, O. Adriani \etal, Phys. Lett. B 317 (1993) 474.
- [14] The LEP Experiments: ALEPH, DELPHI, L3, OPAL, Nucl. Inst. Meth. A 378 (1996) 101.
- [15] The LEP Heavy Flavour Working Group: “Presentation of LEP Electroweak Heavy Flavour Results for Summer 1996 Conferences”, LEPHF/96-01, ALEPHF Note 96-099, DELPHI 96-67 PHYS 627, L3 Note 1969, OPAL Technical Note TN391, July 26, 1996.
- [16] The LEP Heavy Flavour Working Group: “Input Parameters for the LEP/SLD Electroweak Heavy Flavour Results for Summer 1998 Conferences”, LEPHF/98-01, ALEPHF Note 98-062 PHYSIC 98-027, DELPHI 98-118 PHYS 789, L3 Note 2320, OPAL Technical Note TN557, September 2, 1998.
- [17] L3 Collaboration, M. Acciarri \etal, Phys. Lett. B 416 (1997) 220.
- [18] Mark III Collaboration, D. Coffman \etal, Phys. Lett. B 263 (1991) 135.
-
[19]
ALEPH Collaboration, R. Barate \etal, Phys. Lett. B 401 (1997) 163;
DELPHI Collaboration, P. Abreu \etal, CERN-EP/98-180;
OPAL Collaboration, G. Abbiendi \etal, Eur. Phys. J. C 8 (1999) 217;
SLD Collaboration, K. Abe \etal, Phys. Rev. Lett. 80 (1998) 660. - [20] G. Altarelli \etal, Nucl. Phys. B 208 (1982) 365.
- [21] M. Isgur \etal, Phys. Rev. D 39 (1989) 799.
- [22] L3 Collaboration, M. Acciarri \etal, Z. Phys. C 71 (1996) 379.
The L3 Collaboration:
M.Acciarri,26 P.Achard,19 O.Adriani,16 M.Aguilar-Benitez,25 J.Alcaraz,25 G.Alemanni,22 J.Allaby,17 A.Aloisio,28 M.G.Alviggi,28 G.Ambrosi,19 H.Anderhub,47 V.P.Andreev,6,36 T.Angelescu,12 F.Anselmo,9 A.Arefiev,27 T.Azemoon,3 T.Aziz,10 P.Bagnaia,35 L.Baksay,42 A.Balandras,4 R.C.Ball,3 S.Banerjee,10 Sw.Banerjee,10 A.Barczyk,47,45 R.Barillère,17 L.Barone,35 P.Bartalini,22 M.Basile,9 R.Battiston,32 A.Bay,22 F.Becattini,16 U.Becker,14 F.Behner,47 L.Bellucci,16 J.Berdugo,25 P.Berges,14 B.Bertucci,32 B.L.Betev,47 S.Bhattacharya,10 M.Biasini,32 A.Biland,47 J.J.Blaising,4 S.C.Blyth,33 G.J.Bobbink,2 A.Böhm,1 L.Boldizsar,13 B.Borgia,35 D.Bourilkov,47 M.Bourquin,19 S.Braccini,19 J.G.Branson,38 V.Brigljevic,47 F.Brochu,4 A.Buffini,16 A.Buijs,43 J.D.Burger,14 W.J.Burger,32 J.Busenitz,42 A.Button,3 X.D.Cai,14 M.Campanelli,47 M.Capell,14 G.Cara Romeo,9 G.Carlino,28 A.M.Cartacci,16 J.Casaus,25 G.Castellini,16 F.Cavallari,35 N.Cavallo,28 C.Cecchi,19 M.Cerrada,25 F.Cesaroni,23 M.Chamizo,19 Y.H.Chang,49 U.K.Chaturvedi,18 M.Chemarin,24 A.Chen,49 G.Chen,7 G.M.Chen,7 H.F.Chen,20 H.S.Chen,7 X.Chereau,4 G.Chiefari,28 L.Cifarelli,37 F.Cindolo,9 C.Civinini,16 I.Clare,14 R.Clare,14 G.Coignet,4 A.P.Colijn,2 N.Colino,25 S.Costantini,8 F.Cotorobai,12 B.Cozzoni,9 B.de la Cruz,25 A.Csilling,13 S.Cucciarelli,32 T.S.Dai,14 J.A.van Dalen,30 R.D’Alessandro,16 R.de Asmundis,28 P.Déglon,19 A.Degré,4 K.Deiters,45 D.della Volpe,28 P.Denes,34 F.DeNotaristefani,35 A.De Salvo,47 M.Diemoz,35 D.van Dierendonck,2 F.Di Lodovico,47 C.Dionisi,35 M.Dittmar,47 A.Dominguez,38 A.Doria,28 M.T.Dova,18,♯ D.Duchesneau,4 D.Dufournaud,4 P.Duinker,2 I.Duran,39 H.El Mamouni,24 A.Engler,33 F.J.Eppling,14 F.C.Erné,2 P.Extermann,19 M.Fabre,45 R.Faccini,35 M.A.Falagan,25 S.Falciano,35,17 A.Favara,17 J.Fay,24 O.Fedin,36 M.Felcini,47 T.Ferguson,33 F.Ferroni,35 H.Fesefeldt,1 E.Fiandrini,32 J.H.Field,19 F.Filthaut,17 P.H.Fisher,14 I.Fisk,38 G.Forconi,14 L.Fredj,19 K.Freudenreich,47 C.Furetta,26 Yu.Galaktionov,27,14 S.N.Ganguli,10 P.Garcia-Abia,5 M.Gataullin,31 S.S.Gau,11 S.Gentile,35,17 N.Gheordanescu,12 S.Giagu,35 Z.F.Gong,20 G.Grenier,24 O.Grimm,47 M.W.Gruenewald,8 M.Guida,37 R.van Gulik,2 V.K.Gupta,34 A.Gurtu,10 L.J.Gutay,44 D.Haas,5 A.Hasan,29 D.Hatzifotiadou,9 T.Hebbeker,8 A.Hervé,17 P.Hidas,13 J.Hirschfelder,33 H.Hofer,47 G. Holzner,47 H.Hoorani,33 S.R.Hou,49 I.Iashvili,46 B.N.Jin,7 L.W.Jones,3 P.de Jong,2 I.Josa-Mutuberría,25 R.A.Khan,18 D.Kamrad,46 M.Kaur,18,♢ M.N.Kienzle-Focacci,19 D.Kim,35 D.H.Kim,41 J.K.Kim,41 S.C.Kim,41 J.Kirkby,17 D.Kiss,13 W.Kittel,30 A.Klimentov,14,27 A.C.König,30 A.Kopp,46 I.Korolko,27 V.Koutsenko,14,27 M.Kräber,47 R.W.Kraemer,33 W.Krenz,1 A.Kunin,14,27 P.Ladron de Guevara,25 I.Laktineh,24 G.Landi,16 K.Lassila-Perini,47 P.Laurikainen,21 A.Lavorato,37 M.Lebeau,17 A.Lebedev,14 P.Lebrun,24 P.Lecomte,47 P.Lecoq,17 P.Le Coultre,47 H.J.Lee,8 J.M.Le Goff,17 R.Leiste,46 E.Leonardi,35 P.Levtchenko,36 C.Li,20 C.H.Lin,49 W.T.Lin,49 F.L.Linde,2 L.Lista,28 Z.A.Liu,7 W.Lohmann,46 E.Longo,35 Y.S.Lu,7 K.Lübelsmeyer,1 C.Luci,17,35 D.Luckey,14 L.Lugnier,24 L.Luminari,35 W.Lustermann,47 W.G.Ma,20 M.Maity,10 L.Malgeri,17 A.Malinin,27,17 C.Maña,25 D.Mangeol,30 P.Marchesini,47 G.Marian,15 J.P.Martin,24 F.Marzano,35 G.G.G.Massaro,2 K.Mazumdar,10 R.R.McNeil,6 S.Mele,17 L.Merola,28 M.Meschini,16 W.J.Metzger,30 M.von der Mey,1 A.Mihul,12 H.Milcent,17 G.Mirabelli,35 J.Mnich,17 G.B.Mohanty,10 P.Molnar,8 B.Monteleoni,16,† T.Moulik,10 G.S.Muanza,24 F.Muheim,19 A.J.M.Muijs,2 M.Musy,35 M.Napolitano,28 F.Nessi-Tedaldi,47 H.Newman,31 T.Niessen,1 A.Nisati,35 H.Nowak,46 Y.D.Oh,41 G.Organtini,35 R.Ostonen,21 C.Palomares,25 D.Pandoulas,1 S.Paoletti,35,17 P.Paolucci,28 R.Paramatti,35 H.K.Park,33 I.H.Park,41 G.Pascale,35 G.Passaleva,17 S.Patricelli,28 T.Paul,11 M.Pauluzzi,32 C.Paus,17 F.Pauss,47 D.Peach,17 M.Pedace,35 S.Pensotti,26 D.Perret-Gallix,4 B.Petersen,30 D.Piccolo,28 F.Pierella,9 M.Pieri,16 P.A.Piroué,34 E.Pistolesi,26 V.Plyaskin,27 M.Pohl,47 V.Pojidaev,27,16 H.Postema,14 J.Pothier,17 N.Produit,19 D.O.Prokofiev,44 D.Prokofiev,36 J.Quartieri,37 G.Rahal-Callot,47,17 M.A.Rahaman,10 P.Raics,15 N.Raja,10 R.Ramelli,47 P.G.Rancoita,26 G.Raven,38 P.Razis,29D.Ren,47 M.Rescigno,35 S.Reucroft,11 T.van Rhee,43 S.Riemann,46 K.Riles,3 A.Robohm,47 J.Rodin,42 B.P.Roe,3 L.Romero,25 A.Rosca,8 S.Rosier-Lees,4 J.A.Rubio,17 D.Ruschmeier,8 H.Rykaczewski,47 S.Sarkar,35 J.Salicio,17 E.Sanchez,17 M.P.Sanders,30 M.E.Sarakinos,21 C.Schäfer,1 V.Schegelsky,36 S.Schmidt-Kaerst,1 D.Schmitz,1 H.Schopper,48 D.J.Schotanus,30 G.Schwering,1 C.Sciacca,28 D.Sciarrino,19 A.Seganti,9 L.Servoli,32 S.Shevchenko,31 N.Shivarov,40 V.Shoutko,27 E.Shumilov,27 A.Shvorob,31 T.Siedenburg,1 D.Son,41 B.Smith,33 P.Spillantini,16 M.Steuer,14 D.P.Stickland,34 A.Stone,6 H.Stone,34,† B.Stoyanov,40 A.Straessner,1 K.Sudhakar,10 G.Sultanov,18 L.Z.Sun,20 H.Suter,47 J.D.Swain,18 Z.Szillasi,42,¶ T.Sztaricskai,42,¶ X.W.Tang,7 L.Tauscher,5 L.Taylor,11 C.Timmermans,30 Samuel C.C.Ting,14 S.M.Ting,14 S.C.Tonwar,10 J.Tóth,13 C.Tully,34 K.L.Tung,7Y.Uchida,14 J.Ulbricht,47 E.Valente,35 G.Vesztergombi,13 I.Vetlitsky,27 D.Vicinanza,37 G.Viertel,47 S.Villa,11 M.Vivargent,4 S.Vlachos,5 I.Vodopianov,36 H.Vogel,33 H.Vogt,46 I.Vorobiev,27 A.A.Vorobyov,36 A.Vorvolakos,29 M.Wadhwa,5 W.Wallraff,1 M.Wang,14 X.L.Wang,20 Z.M.Wang,20 A.Weber,1 M.Weber,1 P.Wienemann,1 H.Wilkens,30 S.X.Wu,14 S.Wynhoff,1 L.Xia,31 Z.Z.Xu,20 B.Z.Yang,20 C.G.Yang,7 H.J.Yang,7 M.Yang,7 J.B.Ye,20 S.C.Yeh,50 An.Zalite,36 Yu.Zalite,36 Z.P.Zhang,20 G.Y.Zhu,7 R.Y.Zhu,31 A.Zichichi,9,17,18 F.Ziegler,46 G.Zilizi,42,¶ M.Zöller.1
-
1
I. Physikalisches Institut, RWTH, D-52056 Aachen, FRG§ III. Physikalisches Institut, RWTH, D-52056 Aachen, FRG§
-
2
National Institute for High Energy Physics, NIKHEF, and University of Amsterdam, NL-1009 DB Amsterdam, The Netherlands
-
3
University of Michigan, Ann Arbor, MI 48109, USA
-
4
Laboratoire d’Annecy-le-Vieux de Physique des Particules, LAPP,IN2P3-CNRS, BP 110, F-74941 Annecy-le-Vieux CEDEX, France
-
5
Institute of Physics, University of Basel, CH-4056 Basel, Switzerland
-
6
Louisiana State University, Baton Rouge, LA 70803, USA
-
7
Institute of High Energy Physics, IHEP, 100039 Beijing, China△
-
8
Humboldt University, D-10099 Berlin, FRG§
-
9
University of Bologna and INFN-Sezione di Bologna, I-40126 Bologna, Italy
-
10
Tata Institute of Fundamental Research, Bombay 400 005, India
-
11
Northeastern University, Boston, MA 02115, USA
-
12
Institute of Atomic Physics and University of Bucharest, R-76900 Bucharest, Romania
-
13
Central Research Institute for Physics of the Hungarian Academy of Sciences, H-1525 Budapest 114, Hungary‡
-
14
Massachusetts Institute of Technology, Cambridge, MA 02139, USA
-
15
Lajos Kossuth University-ATOMKI, H-4010 Debrecen, Hungary¶
-
16
INFN Sezione di Firenze and University of Florence, I-50125 Florence, Italy
-
17
European Laboratory for Particle Physics, CERN, CH-1211 Geneva 23, Switzerland
-
18
World Laboratory, FBLJA Project, CH-1211 Geneva 23, Switzerland
-
19
University of Geneva, CH-1211 Geneva 4, Switzerland
-
20
Chinese University of Science and Technology, USTC, Hefei, Anhui 230 029, China△
-
21
SEFT, Research Institute for High Energy Physics, P.O. Box 9, SF-00014 Helsinki, Finland
-
22
University of Lausanne, CH-1015 Lausanne, Switzerland
-
23
INFN-Sezione di Lecce and Universitá Degli Studi di Lecce, I-73100 Lecce, Italy
-
24
Institut de Physique Nucléaire de Lyon, IN2P3-CNRS,Université Claude Bernard, F-69622 Villeurbanne, France
-
25
Centro de Investigaciones Energéticas, Medioambientales y Tecnologícas, CIEMAT, E-28040 Madrid, Spain
-
26
INFN-Sezione di Milano, I-20133 Milan, Italy
-
27
Institute of Theoretical and Experimental Physics, ITEP, Moscow, Russia
-
28
INFN-Sezione di Napoli and University of Naples, I-80125 Naples, Italy
-
29
Department of Natural Sciences, University of Cyprus, Nicosia, Cyprus
-
30
University of Nijmegen and NIKHEF, NL-6525 ED Nijmegen, The Netherlands
-
31
California Institute of Technology, Pasadena, CA 91125, USA
-
32
INFN-Sezione di Perugia and Universitá Degli Studi di Perugia, I-06100 Perugia, Italy
-
33
Carnegie Mellon University, Pittsburgh, PA 15213, USA
-
34
Princeton University, Princeton, NJ 08544, USA
-
35
INFN-Sezione di Roma and University of Rome, “La Sapienza”, I-00185 Rome, Italy
-
36
Nuclear Physics Institute, St. Petersburg, Russia
-
37
University and INFN, Salerno, I-84100 Salerno, Italy
-
38
University of California, San Diego, CA 92093, USA
-
39
Dept. de Fisica de Particulas Elementales, Univ. de Santiago, E-15706 Santiago de Compostela, Spain
-
40
Bulgarian Academy of Sciences, Central Lab. of Mechatronics and Instrumentation, BU-1113 Sofia, Bulgaria
-
41
Center for High Energy Physics, Adv. Inst. of Sciences and Technology, 305-701 Taejon, Republic of Korea
-
42
University of Alabama, Tuscaloosa, AL 35486, USA
-
43
Utrecht University and NIKHEF, NL-3584 CB Utrecht, The Netherlands
-
44
Purdue University, West Lafayette, IN 47907, USA
-
45
Paul Scherrer Institut, PSI, CH-5232 Villigen, Switzerland
-
46
DESY, D-15738 Zeuthen, FRG
-
47
Eidgenössische Technische Hochschule, ETH Zürich, CH-8093 Zürich, Switzerland
-
48
University of Hamburg, D-22761 Hamburg, FRG
-
49
National Central University, Chung-Li, Taiwan, China
-
50
Department of Physics, National Tsing Hua University, Taiwan, China
-
§
Supported by the German Bundesministerium für Bildung, Wissenschaft, Forschung und Technologie
-
‡
Supported by the Hungarian OTKA fund under contract numbers T019181, F023259 and T024011.
-
¶
Also supported by the Hungarian OTKA fund under contract numbers T22238 and T026178.
-
Supported also by the Comisión Interministerial de Ciencia y Tecnología.
-
Also supported by CONICET and Universidad Nacional de La Plata, CC 67, 1900 La Plata, Argentina.
-
Also supported by Panjab University, Chandigarh-160014, India.
-
Supported by the National Natural Science Foundation of China.
-
†
Deceased.