FERMILAB-CONF-99/246-E
September 1, 1999
SINGLE TOP PRODUCTION AND TOP PROPERTIES AT THE TEVATRON
Angela Barbaro-Galtieri
Lawrence Berkeley National Laboratory
For the CDF and Collaborations
Abstract
We summarize recent measurements made at the Tevatron Collider using top event candidates. Cross section and mass measurements are discussed in a separate contribution to these Proceedings. Here we report on studies of the top PT distribution in production and studies of single top production. Properties of top decays examined are: BF()/BF(), helicity amplitudes of W’s from top decays and correlations of decay products. Searches for new physics in rare top decays and a search for a state X are also reported.
1 Introduction
The top quark is produced in collision mostly via pair production. At =1.8 TeV top pairs are produced 90% of the time via diagrams, the remainder via gg diagrams. Within the Standard Model (SM) top decays into W+b 100% of the time. The W decays are as follows:
| Br | 1/9 | 1/9 | 1/9 | 3/9 | 3/9 |
For production the event topologies are:
-
•
Dilepton channel (): events for which both W’s decay into . This is expected to occur in a fraction of 4/81 events, i.e., % of the final states. Also plus is expected to occur in % of the events.
-
•
Lepton+jets channel (): events in which one W decays into , the other into a quark pair. This occurs with a fraction 24/81, i.e. in % of the events.
-
•
All-hadronic channel (), events in which both W’s decay into quark pairs. This occurs with a fraction 36/81, i.e. in % of the events.
About one hundred top events have been detected so far at the Fermilab Tevatron ( = 1.8 TeV) in the and CDF experiments in Run I.
| Sample | CDF | |||||
| Events | Background | Events | Background | |||
| 1 | Dileptons(ee,e,) | 0.0074 | 9 | 2.4 0.5 | 5 | 1.4 0.4 |
| 2 | Dileptons() | 0.0013 | 4 | 2.5 0.4 | n.a. | n.a. |
| 3 | n.a. | n.a. | n.a. | 4 | 1.2 0.4 | |
| 4 | + 3jets (SVX tag) | 0.037 | 34 | 9.2 1.5 | n.a. | n.a. |
| 5 | + 3jets (SLT tag) | 0.017 | 40 | 22.6 2.8 | 11 | 2.4 0.5 |
| 6 | + 4jets(no-tag) | n.a. | 46 | 25.9 6.5 | n.a. | n.a |
| 7 | + 4jets(loose jet4) | n.a. | 163 | 108 13 | n.a. | n.a |
| 8 | + jets (topological) | n.a. | n.a. | n.a. | 19 | 8.7 1.7 |
| 9 | All-hadr (1 SVX) | 0.044 | 187 | 142 12 | n.a. | n.a |
| 10 | All jets | n.a. | n.a. | n.a. | 41 | 24.8 2.4 |
Details of the CDF events are as follows. = acceptance efficiency. ET(lepton) is required to be 20 GeV and the missing transverse energy is required to be 20 GeV. A jet is defined as a calorimeter cluster with E 15 GeV in a cone of radius R=0.4. Events in the lepton ()+jets channel are divided into sub-samples depending upon whether they include or not a jet tagged as jet. Tags are established by the presence of a displaced vertex (SVX) or of a soft lepton from a semileptonic decay (SLT). The SLT sample includes many events with an SVX tag. The + 4jets (loose jet4) sample allows a fourth cluster with E 8 GeV in the event. This sample includes samples 4-6. For CDF the All-hadronic sample requires one of the 6 jets to be tagged as a jet by the SVX algorithm. The sample selection is somewhat different and can be found in the many references given below.
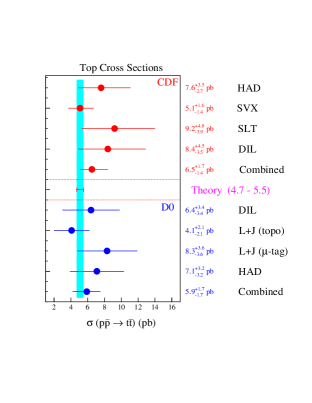
Cross section measurements by both CDF [1] and [2] have been made and are shown in Figure 1. has presented an updated cross section at this Conference [3, 4]. CDF has updated its cross section measurements since this Conference. At this writing the combined cross sections for each experiment are:
| (1) | |||
| (2) |
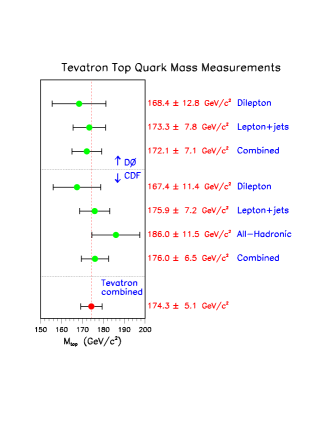
The top mass value is specified, because the acceptance is a weakly dependent function of mass. Direct top mass measurements were also made by CDF [5] and [6] in several channels and are shown in Figure 1. The combined mass from the CDF and experiments is [3]:
| (3) |
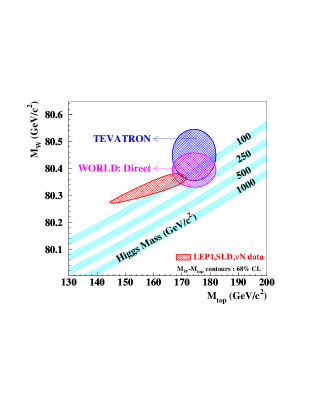
Measurements of the top mass and the W mass test the Standard Model beyond tree level. The W mass values from the Tevatron [7] and LEP II [8] are:
CDF + average MW = 80.450 0.063 GeV/c2
LEP II average MW = 80.375 0.078 GeV/c2
World average MW = 80.420 0.049 GeV/c2
Figure 2 shows the relation between MW and Mtop for a constant value of MHiggs as expected by the Standard Model (SM). Within the SM precise measurements of MW and Mtop impose a constraint on the Higgs mass. The allowed region from present Tevatron measurements is shown as well as that obtained by using the world average for MW. The allowed region obtained from an overall fit of many measurements by LEP experiments, the SLD detector at the SLC and by neutrino experiments, is shown as the narrow oval region on the left. The contours are one standard deviation uncertainties and are in good agreement with each other.
In Run II (2 fb-1 of integrated luminosity, 2 TeV collisions and upgraded detectors) the Tevatron experiments expect up to a factor 40 more data in most channels, hence better determination of the top and W masses. These measurements will be dominated by systematic uncertainties.
Here we report on other studies done at the Tevatron to investigate agreement between top production measurements and SM expectation, as well as preliminary searches for new physics. In Section 2 we describe a study of the PT distribution of top quarks in production. In Section 3 we investigate single top production. In Section 4 we report on decay properties of the top quark. Finally, in Section 5 we investigate beyond the SM phenomena, i.e., rare top decays and a search for a Topcolor state X . All of these studies can benefit from more statistics and are really done in preparation for Run II data.
2 Top Pair Production
At the Tevatron ( = 1.8 TeV) the production cross section from QCD calculations [9] is expected to be in the range 4.75 to 5.5 for Mtop = 175 GeV/c2. As shown earlier, measurements done by CDF and are in reasonable agreement with this prediction within the measurement errors. Are the features of the events compatible with what is predicted by QCD top pair production? Comparisons of the lepton+jets data samples with Monte Carlo predictions for production have been made. CDF has used many variables in the comparison and very good agreement between data and expectations has been found [10]. Similar studies were done by with the same conclusions [11].
2.1 Top PT in Production (CDF)
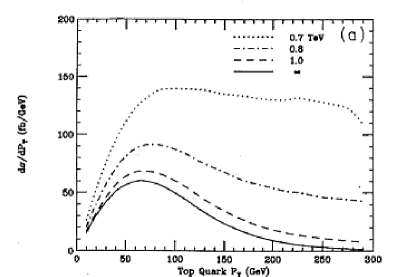
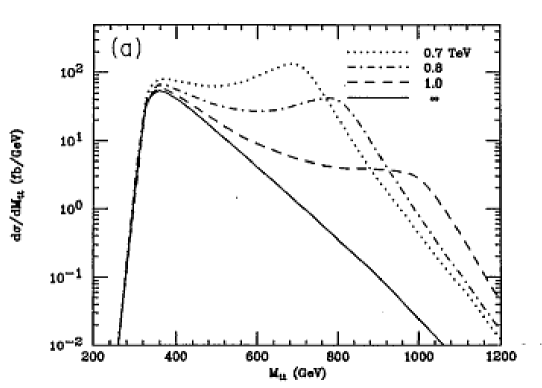
A detailed study of the top PT distribution has been done by CDF. This variable has been chosen because in some models it is more sensitive to new physics than the total cross section and large deviation from QCD are expected. For example, the Topcolor model of Hill and Park predicts color octet (and/or singlet) vectors associated with top condensation that enhance or depress the top production cross section [12]. A particular case within this model predicts a narrow Z’ that decays into a pair. It predicts the top PT distributions shown in Figure 3 for different values of the new scale .
CDF uses the lepton + jet sample to which the top mass kinematic fitting for reconstructing the event is applied [13], with Mtop fixed at 175 GeV/. After the requirement of a good fit, 61 events remain with a background of 24.6 5.8 events. The distribution in PT for these events is shown in Figure 4 (left plot), along with the estimated background distribution.
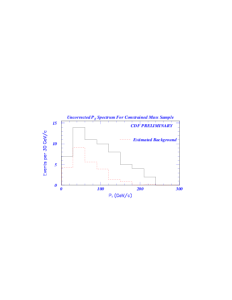
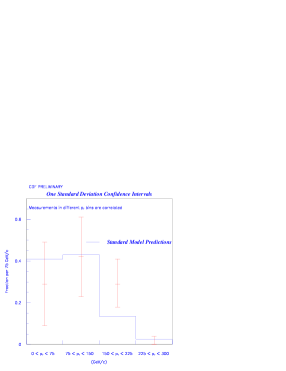
To extract the PT spectrum of produced top quarks, CDF unfolds for resolution smearing and corrects for acceptance as a function of top PT. This is done in four bins of “true” top PT. An unbinned likelihood estimator, which uses the response functions for and background, is then employed to find the top contribution. Response functions for the four bins are obtained from the HERWIG top Monte Carlo plus detector simulation. The VECBOS Monte Carlo [14] is used for background. An iterative technique is used to minimize the assumptions made about the shape of the PT spectrum within each bin. The final “true” top PT distribution at production is shown in Figure 4 (right plot). The error bars in each bin include statistical and systematic uncertainties. The different sources of systematics are: Mtop value, jet ET scale, gluon radiation, background shape, acceptance. The results for each bin are shown in Table 1.
| PT bin | Measured Fraction of Top quarks |
|---|---|
| 0 75 GeV/c | 0.29 (stat) (syst) |
| 75 150 GeV/c | 0.42 (stat) (syst) |
| 150 225 GeV/c | 0.29 (stat) (syst) |
| 225 300 GeV/c | 0.000 (stat) (syst) |
The unfolded distribution is in good agreement with QCD production expectation, i.e., with the standard model prediction. The upper limit for R4, i.e., fraction of events with top PT in the 225-300 GeV/c bin, is calculated to be R 0.114 at 95% CL. It seems in disagreement with a flat top PT distribution, like the one shown in Figure 3 with a scale = 0.7 TeV. Clearly more statistics is needed to exclude or prove any new model. This is a study that can be carried out with Run II data.
3 Single top production (CDF)
Top quarks can be produced along with a quark through electro-weak interactions. Although the cross section is smaller than that for top pair production, it is important to pursue this study because single top production can be used to measure the CKM matrix element Vtb. The process is sensitive to new physics at the t-W-b vertex, like contributions from a W’ or flavor changing neutral currents (FCNC). At the Tevatron two different diagrams are expected to contribute (Figure 5). They have different cross sections and require different methods of analysis.
We report here on analyses being done by the CDF Collaboration.

For W-g fusion = 1.7 0.3 (See [15]). The q’ jet is expected to be energetic, whereas the jet at the lower vertex is soft. Since top pair production contributes appreciably in W+3jet events (), only W+ 2 jets events are used (E15 GeV), and only one tagged jet is allowed. The sample used is then + 2jets (1 SVX tag). For the W∗ channel = 0.73 0.10 (See [16]). Here the jet at the lower vertex is energetic and two jets are expected in the event. The sample used is then +2jets with 1 SVX tag. Backgrounds come from QCD processes with tagged jets (W, W, W, W+2jets mistags, and ).
3.1 W-gluon fusion process
Backgrounds for this process are the same as for the W* process. The requirement that the jet at the lower vertex be soft, reduces the acceptance by a factor 2, while reducing the background by 85%. To reduce the QCD background from other sources, CDF requires 145 M() 205 GeV/c2. Expected and observed number of events are shown below.
| Source | QCD | W* | W-g | Found | |
|---|---|---|---|---|---|
| Events | 10.21.9 | 0.50.1 | 2.20.6 | 1.20.3 | 15 |
Monte Carlo studies find that the charge of the top quark, hence of the lepton (Q), is correlated with the pseudorapidity, , of the untagged jet ( has a jet with positive , has a jet with negative ). Therefore, the variable Q is used to extract an estimate of the signal because signal events tend to be asymmetric whereas the background is symmetric. The distributions obtained from the data and those expected from background and background+signal are shown in Figure 6.


A likelihood method is used to estimate the single top fraction. It uses templates for W, W + jets, , and the other processes. The major systematic uncertainties included are from: Monte Carlo signal generator, initial and final state radiation, jet energy scale, luminosity and -tagging efficiency. The results of this procedure is = 1.9 , which results in the limit:
| (4) |
3.2 W∗ process
Only events with 1 SVX -tagged jets are included in this study. The expected and observed number of events are shown below.
| Source | QCD | W-glu | W∗ | Found | |
|---|---|---|---|---|---|
| Events | 24.04.5 | 5.71.3 | 1.60.3 | 1.00.3 | 42 |
To study the signal the variable of choice is M(), calculated with the assumption that the with larger is associated with in W+ production (the opposite for W-). Monte Carlo studies show this choice to be correct 64% of the time. Figure 6 shows this distribution (right hand plot).
A maximum likelihood method is used to estimate individual contribution to the sample. Both statistical and systematic uncertainties are taken into account. With fixed and W-g fusion cross sections, the analysis gives = 4.9. This gives an upper limit:
| (5) |
3.3 Run II expectation
Limits obtained in Run I are an order of magnitude larger than the expected cross sections. Is there a chance to obtain a measurement in Run II ( 2 fb-1 of data)? Improvements expected are as follows:
-
•
Factor 20 in luminosity, Tevatron energy up to 2.0 TeV. At this energy the top cross sections are larger by 40%, whereas the rest of the QCD background increases only by 12%.
-
•
Detector improvements expected are: 1.) lepton acceptance increases, by 33%, by 12% and 2.) SVX tagging efficiency increases by about 50%.
The expected number of events are:
| Source | QCD | W-glu | W∗ | |
|---|---|---|---|---|
| Events | 170 | 80 | 50 | 15 |
Additional handles (total event transverse energy and different ET threshold for jet 1) can be used to reduce backgrounds. It is likely that more than 2 fb-1 of data will be needed.
4 Top Decay Studies
Assuming that the top quark has isospin 1/2 and that it forms an SU(2) doublet with the bottom quark, the Standard Model has a definite prediction on the allowed decay modes: BF() 100%. Also this decay should exhibit the behavior expected by the V-A weak interaction, and precise predictions about the subsequent decays of the W can be made. In this section we present three studies on details of the top decay products.
4.1 Branching Fraction for and (CDF)
The branching fraction for is in the Standard Model. A value significantly different from this could signal new physics. The expectation for decays into quarks other then is very low. The BF() depends upon the value of , which is constrained by the other elements of the CKM matrix to be 0.9991 0.9994 when the assumptions of three generations and unitarity are made [17].
CDF, using good tagging capabilities due to the presence of a silicon detector close to the beam pipe, measures the ratio
| (6) |
In the Standard Model the CKM matrix (3 generations and unitarity) makes a prediction of the value of via the following relation:
| (7) |
The above value of Vtb suggests that Rb is very close to one.
CDF uses a few independent data samples to measure Rb. Events with:
-
•
0, 1 or 2 -tagged jets in the +4jets(loose jet4) sample.
-
•
0, 1 or 2 -tagged jets in the Dilepton sample.
The number of events in each category depends upon the fraction of ’s present in top decays. The observed events are:
| Sample, Tags | 0 | 1-SLT | 1-SVX | 2-SVX | |
|---|---|---|---|---|---|
| +4jets(loose jet4) | observed | 126 | 14 | 18 | 5 |
| +4jets(loose jet4) | backgr. | 10710 | 7.21.6 | 2.9 | 0.20.1 |
| Dileptons | observed | 6 | n.a. | 3 | 0 |
| Dileptons | backgr. | 2.30.5 | n.a. | 0.10 0.04 | n.a. |
Backgrounds for each of these categories are estimated and included in a maximum likelihood estimator used to measure Rb. The result is:
| (8) |
Assuming unitarity CDF calculates Vtb:
| (9) |
Note that if the SM with three generations were not correct, the measurement of could not be used to calculate . The calculation of done here provides a check of the SM. The single top production discussed in Section 3 would be a model independent way to measure .
4.2 W Boson Helicity in Top Decays (CDF)
The Standard Model has an exact prediction (in leading order) of the W helicity states in the top rest frame. Since the top quark decays before it hadronizes the spin information at production is preserved. Because of the large top mass we expect:
| (10) |
For Mtop = 175 GeV/c2 F0 = 0.70. Also F+ = 0.0. Here F0 is the fraction of longitudinal W bosons (HW =0) and F+ is the fraction of right handed W bosons (HW = +1). Large deviations from these predictions would indicate that top has non-SM couplings.
To test this prediction the relevant information can be obtained from decay angular distributions of leptons in the top rest frame. This requires full reconstruction of the event, with its uncertainties due to combinatorics. CDF uses the observed lepton PT distribution, which also carries this information and does not require event reconstruction. This allows the use of all leptons from top decay candidates even if the kinematic fit did not succeed, thus providing a larger statistical sample. This method, however, is more sensitive to the Monte Carlo model used, especially the background model.
CDF uses events from the Dilepton (only ) and the lepton+jets (SVX and SLT tags and no-tag) samples to perform this analysis (see Figure 7).

| Sample | SVX tags | SLT tags | No-tag | Dilepton |
|---|---|---|---|---|
| Events | 34 | 14 | 46 | 7 |
| Background | 9.21.2 | 6.01.2 | 25.96.5 | 0.76 0.21 |
Each lepton in a dilepton event is used, thus the total sample has 108 leptons. The background in each momentum bin has different composition: b-mistag (non-top QCD), non-W background, W, etc. Background rates and background shapes are obtained from data and Monte Carlo.
A maximum likelihood method is used to estimate F0. The likelihood uses the response functions for the different W helicity states and the background, and constrains the background rate to the expected value. The input curves, the estimated background plus signal and the data are shown in Figure 7. The result of the likelihood gives:
| (11) |
where F0 = 0.70 is expected. The systematic error includes uncertainties from: Mtop, acceptance at low PT, non-W background shape, gluon radiation in Monte Carlo and other small contributions. The measurement is clearly dominated by the statistical uncertainty.
To evaluate a possible F+ contribution, the F0 value is fixed in the likelihood to the SM prediction and a new maximization is performed. The result is:
| (12) |
or F 0.28 at 95% CL, assuming F0 = 0.70. CDF concludes that with the present statistics no deviation from the SM is observed.
4.3 Studies of spin correlations ()
The SM predicts a width of 1.6 GeV for the top quark, this means that it decays before hadronization and depolarization. At the Tevatron pairs are produced via pairs 90% of the times, i.e. via a spin 1 gluon. Top quarks are not individually polarized but as a pair their spins are correlated. In the top quark rest frame the angular distributions of the decay products with respect to the top quark spin vector, are as follows:
| (13) |
where we expect:
| particle | |
|---|---|
| e+ or d quark | 1 |
| or u quark | -0.31 |
| W+ | 0.41 |
| b | -0.41 |
Charged leptons carry most of the information about the top spin. For dilepton events, i.e. , the correlations between the two leptons can be written as:
| (14) |
where all the spin correlation information is now in . Here is the angle with respect to the so called “off diagonal axis”, defined in the off-diagonal basis introduced by Mahon and Parke [18]. This choice enhances the correlation by a factor 2. At the Tevatron the expectation is 0.84 [19].
uses the top dilepton sample of Run I, consisting of six events, to check this correlation. Event reconstruction is needed to allow moving from one reference frame to another. Because of missing constraints in the fitting of dilepton events (two are missing) the sensitivity is somewhat diminished. Also combinatorics, due to multiple and assignments, and backgrounds will dilute the expected effect. A binned 2-dimensional likelihood is used to estimate the value of . Templates, obtained from Monte Carlo for and for the background, are used for values of = -1.0 and 1.0. A total of 9 bins are used in Figure 8.
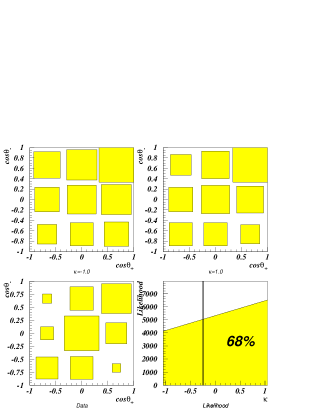
’s preliminary result is:
| (15) |
Run II data will allow a good measurement of this correlation.
5 Beyond the Standard Model
CDF has performed searches for rare top decays and a search for a state X that could indicate new strong dynamics. We summarize these studies here.
5.1 Search for rare Top Decays (CDF)
The large mass of the top quark suggests a strong connection with the electroweak symmetry breaking sector. Any indication of unusual top quark decays could shed some light on the mechanism for EWSB. CDF has investigated two FCNC (Flavor Changing Neutral Currents) top decays: and [20]. Both are expected by the SM to have branching ratios in the 10-10 range.
Search for Assuming FCNC the SM predicts BR() 0.001 [21]. CDF has searched in the channels ( = or )
| (16) |
with jet E 20 GeV. They find one Z event. The background (from WZ, ZZ, ZZ pair production) is expected to be B = 0.6 0.2 events. Assuming that the observed event is signal and including all systematic uncertainties, CDF sets a limit:
| (18) |
Search for CDF search for uses the production channel:
| (19) |
The two relevant topologies are:
-
1.
for W they search for 2 jets
-
2.
for W they search for 4 jets and a -tag
One event of type 1.) is observed. The expected background consists of 0.5 events from W and of 0.5 events from W . After inclusion of systematic uncertainties CDF sets a limit:
| (20) |
5.2 Study of the Mass (CDF)
New strong dynamics can be at the origin of a state. A number of models can be found in the literature on this subject. In some models the state provides an explanation for the large value of Mtop, in others top itself helps explain the origin of mass.
As mentioned in Section 2.1 the Topcolor model of Hill and Parke [12] or Topcolor assisted Technicolor model of Hill [22] , predict a process like:
| (21) |
where are color-octet (and/or singlet) Vector bosons.
The multiscale Technicolor model of Eichten and Lane [23] predicts the process:
| (22) |
where the techni-eta is a scalar. In some part of the parameter space these states are narrow and can be detected.
CDF is looking at Run I data for possible hints of a state and to establish cross section limits for these models. Event selection is similar to that used for the top mass analysis:
-
•
ET(lepton) 20 GeV; 20 GeV
-
•
Raw ET(jet 1-3) 15 GeV
-
•
Jet4: either tagged as or E 15 GeV
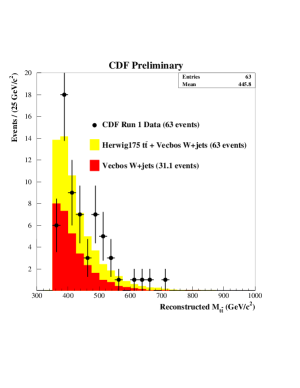
The strategy used follows the mass analysis, i.e., the mass fitting kinematic constraint for event reconstruction is used with Mtop fixed at 175 GeV/c2 (3C fit). The goodness of fit, cut, is loosened to 50 (usually 10 is required for a 2C fit). To reduce effects due to wrong jet combinations they require that the 3-body masses in each event (for the same combination that gave the best fit) be in the interval 150-200 GeV/c2 when computed using the measured quantities (rather than the result of the fit).
A total of 63 events remain with a background of 31 events. The expected M distributions for background and background + signal are shown in Figure 9 and compared with the data. No excess over the expectation is observed. Using the Topcolor assisted Technicolor model of Hill [22], and including systematic uncertainties on the measurement, CDF evaluates limits on cross sections for production of a colored vector boson, a Z’, as a function of its mass. The mass limit for a Topcolor Z’ with = 0.012 is found to be M(Z’) 630 GeV/c2.
This is physics to be pursued in Run II.
6 Summary and Conclusions
A number of studies have been done at the Tevatron by CDF and to verify that top quark production is in agreement with expectations of the Standard model. No deviations from the SM have been found in studies of top PT in production or in studies of top decay products and spin correlations. In preparation for the next data taking period, Run II, studies of single top production, search for rare top decays and for a state X are being done. No new phenomena have been observed.
References
- [1] F. Abe et al., CDF Collaboration, Phys. Rev. Lett. 80, 273 (1998)
- [2] S. Abachi et al., Collaboration, Phys. Rev. Lett. 79,1203 (1997).
- [3] S. Wimpenny, “Refined Measurement of the Top Quark Mass”, These Proceedings.
- [4] B. Abbott et al., Collaboration, hep-ex 9901023, to be published in Phys. Rev. Lett., January 1999.
- [5] F. Abe et al., CDF Collaboration, Phys. Rev. Lett. 82, 271 (1999)and references therein.
- [6] B. Abbott et al., Collaboration, Phys. Rev. D60, 052003 (1999), and references therein.
- [7] Y. K. Kim, “The W mass at the Tevatron Collider”. These Proceedings.
- [8] N. Kjaer, “The W mass at LEP II”. These Proceedings.
- [9] E. Berger and H. Contopaganos, Phys. Rev. D54, 3085 (1996); S. Catani et al., Phys. Lett. B378, 329 (1996); E. Laenen et al., Phys. Lett. B321, 254 (1994); Nason et al., Nucl. Phys. B303, 607 (1988).
- [10] F. Abe et al., CDF Collaboration, Phys. Rev. D59, 92001 (1999).
- [11] B. Abbott et al., Collaboration, Phys. Rev., D58, 052001 (1998).
- [12] C. T. Hill and S. Parke, Phys. Rev. D49 (1994).
- [13] F. Abe et al, CDF Collaboration, Phys. Rev. Lett. 80, 2767 (1998).
- [14] The program VECBOS is based on the paper by F.A. Berends, W.T. Giele, H. Kuijf and B. Tausk, Nucl. Phys. B357, 32 (1991).
- [15] T. Stelzer, Z. Sullivan, and S. Willenbrock, Phys. Rev. D56, 5919 (1997).
- [16] M.C. Smith, S. Willenbrock, Phys. Rev. D54, 6696 (1996).
- [17] C. Caso et al., Review of Particle Physics, The European Physical Journal C3, 1 (1998).
- [18] G. Mahlon and S. Parke, Phys. Lett. B411, 173 (1997).
- [19] G. Mahlon, “Spin Issues in Production and Decay”, hep-ph/9811281, presented at the “Thinkshop on Top Quark Physics for Run II”, FNAL Oct.16-18, 1998.
- [20] F. Abe et al., CDF Collaboration, Phys. Rev. Lett. 80, 2525 (1998).
- [21] H. Fritzsch, Phys. Lett.B224, 423, (1989).
- [22] C. T. Hill, Phys. Lett. B345 (1995); E. Eichten and K. Lane , Phys. Lett. B352, 385 (1995).
- [23] E. Eichten and K. Lane , Phys. Lett. B327, 129 (1994).