FERMILAB-CONF-99/239-E
UPR–0239–E
CP Violation in B Decays at the Tevatron
I. Joseph Kroll
The University of Pennsylvania
David Rittenhouse Laboratory
209 South 33rd Street
Philadelphia, PA 19104
Abstract
Between 1992 to 1996, the CDF and D0 detectors each collected data samples exceeding 100 pb-1 of collisions at TeV at the Fermilab Tevatron. These data sets led to a large number of precision measurements of the properties of hadrons including lifetimes, masses, neutral meson flavor oscillations, and relative branching fractions, and to the discovery of the meson. Perhaps the most exciting result was the first look at the violation parameter using the world’s largest sample of fully reconstructed decays. A summary of this result is presented here. In the year 2000, the Tevatron will recommence collisions with an over order of magnitude expected increase in integrated luminosity (1 fb-1 per year). The CDF and D0 detectors will have undergone substantial upgrades, particularly in the tracking detectors and the triggers. With these enhancements, the Tevatron physics program will include precision measurements of and flavor oscillations, as well as studies of rare decays that are sensitive to new physics. The studies of mesons will be particularly interesting as this physics will be unique to the Tevatron during the first half of the next decade.
presented at Kaon ’99, Chicago, Illinois, 23 June 1999
1 Introduction
In this paper, we review results on violation in decays from the Fermilab Tevatron and discuss prospects in the near future. The results are based on the analysis of 110 pb-1 of collisions at TeV, collected between August 1992 to February 1996, which we refer to as Tevatron Run I. At present, only the CDF Collaboration has presented results on violation in decays from these data.
The Tevatron will recommence collisions in the Spring 2000 at TeV. This future data taking period is referred to as Run II. The new crucial accelerator component, the main injector, has been commissioned successfully and will increase the rate of production of antiprotons by a factor of three above previous rates. The expected data rate is 2 fb-1 in the first two years of operation. This corresponds to approximately pairs per year.
The Tevatron will continue to operate beyond these first two years. Ultimately a data sample of more than 20 fb-1 may be collected prior to the turn-on of the LHC. At that time, Fermilab may continue operation of the Tevatron with an experiment dedicated to the study of physics. The physics motivation and capabilities of such a detector are not discussed here, but an excellent discussion can be found in [1].
As has been discussed in numerous other talks at this conference, the study of hadron decays plays a unique role in the test of the Standard Model of electroweak interactions and the study of the Cabibbo Kobayashi Maskawa Matrix . Measurements of the decays of hadrons determine the magnitudes of five of the nine elements of as well as the phase.
The unitarity of leads to nine unitarity relationships, one of which is of particular interest:
| (1) |
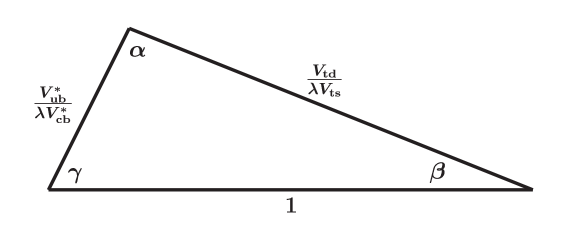
This sum of three complex numbers forms a triangle in the complex plane, commonly referred to as the Unitarity Triangle. Measurements of the weak decays of hadrons and the already known CKM matrix elements determine the magnitudes of the three sides of the Unitarity Triangle, and asymmetries in meson decays determine the three angles. The primary goal of physics in the next decade is to measure precisely both the sides and angles of this triangle and test consistency within the Standard Model.
We can use several approximations to express Eq. 1 in a more convenient form. The elements and , where is the Cabibbo angle, are well measured. Although the elements and are not well measured, the theoretical expectations are that and . With these assumptions, Eq. 1 becomes
| (2) |
A pictorial representation of this equation as a triangle in the complex plane is shown in Fig. 1; the vertical axis is the complex axis. In the Wolfenstein approximation [2, 3], the apex of this triangle is .
The next experimental steps in studying this triangle will be the measurement of the angle from the asymmetry in the decays , and the measurement of from the ratio of mass differences determined from and flavor oscillations. Since mesons are not produced on the resonance, the measurement of flavor oscillations as well as the study of decays will be unique to experiments operating at hadron machines.
In the system, the measurements of violation that are cleanly related (i.e., without large theoretical uncertainties) to angles in the Unitarity Triangle are from asymmetries in the decays of neutral mesons to eigenstates. The most popular mode is . It is lucky that at hadron colliders the leptonic decays and form the basis of a practical trigger for this decay mode and the means to reconstruct the decay mode with excellent signal to noise.
violation is observed as an asymmetry in decay rates:
| (3) |
where is the rate of observed given the particle produced was a . The asymmetry is produced by the interference of direct decays () and decays that occur after mixing (). The asymmetry oscillates as a function of proper decay time with a frequency , and the amplitude of the oscillation is :
| (4) |
Unlike experiments operating at the , the time integrated asymmetry of Eq. 3 (i.e. replace the rates in Eq. 3 with the total observed numbers) does not vanish in hadron collisions:
| (5) |
where [3]. The value of falls fortuitously close to , the value that maximizes the coefficient in front of . In contrast, the large value of ( at C.L. [3]) implies that even if there were large violation due to mixing, the asymmetry can not be observed using a time integrated asymmetry.
Even though the time integrated asymmetry can be used to extract , it is better to measure the asymmetry as a function of proper decay time (i.e. the time dependent asymmetry), if possible. The improvement comes from two sources. First, there is more statistical power in the time dependent asymmetry. Decays at low lifetime exhibit a small asymmetry because there has not been adequate time for mixing to occur to create the interference leading to violation. Second, a substantial fraction of the combinatoric background occurs at low values of , well below the value of (about 2.2 lifetimes) where is a maximum.
2 Current Results
So far at the Tevatron, only the CDF experiment has had the capability to measure violation in decays. This will change in Run II, when major upgrades of both the CDF and D0 detector will make both detectors capable of unique and important measurements of hadron decays.
The features of the Run I CDF detector [4] crucial for physics included a four-layer silicon microstrip detector, a large volume drift chamber, and excellent electron and muon identification. The silicon microstrip detector provided an impact parameter () resolution for charged tracks of m, where is the magnitude of the component of the momentum of the track transverse to the beam line in units of GeV/. This impact parameter resolution made the precise measurement of hadron proper decay times possible. The drift chamber was 1.4 m in radius and was immersed in a 1.4 T axial magnetic field. It provided excellent momentum resolution (where is in units of GeV/) and excellent track reconstruction efficiency making it possible to fully reconstruct hadron decays with excellent mass resolution and high signal to noise. Electron () and muon () detectors in the central rapidity region () made it possible to detect (and trigger on) hadrons using semileptonic decays () or using .
The measurement of of Eq. 3 has three crucial experimental components: (1) reconstructing the decay mode with good signal to noise; (2) measuring the proper decay time ; and (3) determining whether the meson that was produced was a (i.e., ) or a (i.e., ). This last component is known as “ flavor tagging,” and it is the most challenging of the above three requirements. The CDF experiment has demonstrated that the first two are possible by extracting large-statistics, low-background signals of fully reconstructed decays using and partially reconstructed semileptonic decays (e.g., and charge conjugate). With these signals, CDF has made some of the most precise species specific measurements of hadron lifetimes [3] to date.
The performance of the flavor tags may be quantified conveniently by their efficiency and dilution . The efficiency is the fraction of candidates to which the flavor tag can be applied (). The dilution is related to the probability that the tag is correct: , so a perfect tag has , and a random tag has .
The experimentally measured amplitude of the asymmetry in Eq. 4 is reduced by the dilution of the tag:
| (6) |
The statistical error on the true asymmetry is approximately (for )
| (7) |
where is the total number of candidates (signal and background) before applying the flavor tag. The statistical power of the data sample scales with . At a hadron collider, a flavor tag with is respectable.
To extract from the measured asymmetry, the value of the dilution of the flavor tag(s) must be determined quantitatively. The most reliable means of determining is from the data themselves. Measurements of neutral meson flavor oscillations requires flavor tagging as well. In this case, the measured asymmetry is given by
| (8) |
where [] are the number of candidates observed to have decayed with the same [opposite] flavor as they were produced with. CDF has used measurements of flavor oscillations to determine for three different flavor tagging methods.
The methods of flavor tagging fall into two categories: (1) opposite-side flavor tags (OST) and (2) same-side flavor tags (SST). The dominant production mechanisms of quarks in hadron collisions produce pairs. Opposite-side flavor tags exploit this fact: to identify the production flavor of the hadron of interest (e.g. the one that eventually leads to a ), we identify the flavor of the second hadron in the event and infer the flavor at production of the first . Since the Run I CDF central drift chamber was fully efficient only for the central rapidity region (, where is pseudorapidity), full reconstruction of decays and flavor tagging were usually restricted to this central region. If a candidate is detected in this region, then the second is in this central region as well only about of the time. This means that opposite-side flavor tags at CDF have a maximum efficiency of .
So far, two opposite-side flavor tags have been used: (1) a lepton tag and (2) a jet-charge tag. The lepton tag is based on semileptonic decay: , but , where . The charge of the lepton identifies the flavor of the . The low semileptonic branching fraction ( per lepton flavor) limits the efficiency of this tag, although the flavor tag dilution is high. Of course leptons can originate from the decays of secondary decay products in decay, e.g. , and this will cause the wrong production flavor to be assigned, reducing the dilution. The jet-charge tag is based on the momentum weighted charge average of the charged particles produced in the fragmentation of a quark and in the subsequent decay of the hadron. On average, a quark will produce a jet charge less than zero (), but a quark will produce a jet charge larger than zero (. The jet-charge tag is more efficient, but has a smaller dilution, than the lepton-tag. The jet-charge tag was especially effective in measurements of neutral meson flavor oscillations performed at colliders operating on the resonance, but it is much more challenging to apply this method in the environment of hadronic collisions. Both the lepton flavor tag and the jet-charge flavor tag were used in a precise measurement of [5] by CDF.
The same-side flavor tag exploits the correlation between the flavor and the charge of the particles produced by the quark fragmentation, as illustrated in Fig. 2.
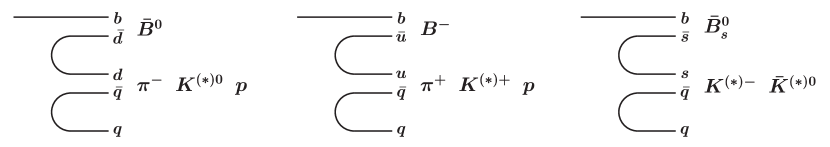
A tags a , but a tags a . If a charged hadron is produced, the correlation between pion charge and flavor is the opposite to the correlation in the case of the . This has important consequences when utilizing fully reconstructed charged hadron decays (e.g., ) to quantify the performance of the SST when applied to . The idea of the SST was originally proposed by Gronau, Nippe, and Rosner [6]. The decays of wave mesons produce the same flavor-pion charge correlations. Since the SST is based on particles produced with the of interest, if this is in the experimental acceptance, then it is likely that these fragmentation particles are in the acceptance as well. As a result, the efficiency of the SST is potentially larger than the efficiency of the opposite-side tags. The SST was used successfully [7] as a flavor tag in a precise measurement of by CDF using approximately 6 000 partially reconstructed semileptonic decays in the decay modes . The mixing signal is shown in Fig. 3.

This figure depicts the experimental asymmetry described by Eq. 8. The points with error bars are the measured asymmetry plotted as a function of proper decay length . The upper plot is for decays and the lower two plots are for decays. The dashed curves are the expected asymmetry fit to the data. The two lower curves show the expected behavior from mixing. The intercept on the vertical axis at is the dilution , where the subscript indicates this is the dilution for neutral . Charged do not oscillate, so the curve in the upper-most plot is a straight line (the small oscillation is due to a contamination of in this sample). The intercept determines the dilution for the same-side tag for . The charged dilution is larger than the neutral dilution . Monte Carlo studies [7] confirm that this is due to charged kaons, which increase , but decrease , as illustrated in Fig. 2.
Using this same-side flavor tag, and a signal of decays, CDF published [8] a first look at from the Run I data. The final state is reconstructed using the decays (this is also the basis of the trigger) and . The measured asymmetry as a function of proper decay length is shown in Fig. 4.

The points with error bars are the experimental asymmetries; the curves are fits of these points to the expected form given in Eq. 6. The resulting amplitude is , where the largest contributions to the systematic error are the error on world average value of and the ability to constrain potential detector biases that could produce false asymmetries. If the error on this measurement were small enough to establish that this amplitude is not zero, then this would be sufficient to establish violation in the system. In this case, knowledge of the dilution is necessary only to determine the corresponding value of . Using the value of the dilution determined mainly with the mixing measurement discussed previously, the value of is . The uncertainty on the dilution is contained in the systematic error on . The non-physical value is possible with low statistics; the corresponding limit is at C.L.
As this first result was limited by statistics, the CDF collaboration has continued to analyze the Run I data set with the aim of improving the statistical precision on as much as possible. An updated measurement, which supersedes the published one has been submitted recently for publication [9]. The statistical power of the first published result has been improved in two ways: (1) the signal of has been doubled, and (2) two opposite-side flavor tags (lepton tag and jet-charge tag) have been added. The published analysis used only candidates reconstructed in the silicon microstrip detector, to ensure a precise measurement of the proper decay time . Due to the large length (r.m.s. of 30 cm) of the distribution of collisions along the beam line, only about of the interactions are contained the acceptance of the 50 cm long silicon detector. The new analysis adds candidates that are not reconstructed in the silicon microstrip detector. The total signal of is . The normalized mass111 By normalized mass we mean the difference of the measured mass from the world average mass divided by the estimated error on the measured mass: []. distributions of the candidates reconstructed both inside and outside of the acceptance of the silicon microstrip detector are shown in Fig. 5. The mass resolution is approximately MeV/.

Candidates fully reconstructed in the silicon microstrip detector have a proper decay time resolution of m, where as the candidates not fully contained in this detector have m.
Three methods of flavor tagging are applied to this sample: the same-side tag described previously, a lepton tag and a jet-charge tag. The lepton tag is identical to the tag used in a published mixing analysis [5]. The jet-charge tag is based on the jet-charge tag from the published mixing analysis [5], except that the method of associating charged particles to the jet was modified to increase the tag efficiency. Any candidate track for the same-side tag is explicitly removed from the jet-charge determination. If a lepton tag exists, then the jet-charge tag is ignored, since the dilution of the lepton tag is much larger than the dilution of the jet-charge tag. These two requirements reduce the effect of correlations between the tags and simplify the analysis.
The performance of the two opposite-side tags is quantified using a signal of decays. This data sample has similar kinematics to the sample. As mentioned previously, the same-side tag is expected to perform differently for than for , so this fully reconstructed charged sample cannot be used to quantify the same-side tag. Instead the performance is determined as described in the published analysis [8]. The resulting flavor tag performance is summarized in Table 1.
| Flavor tag | efficiency () | dilution () | |
|---|---|---|---|
| Lepton | |||
| Jet charge | |||
| Same side (in Silicon) | |||
| Same side (not in Silicon) |
The performances of the individual tags are comparable; the combined tagging effectiveness of all three flavor tags is . The efficiency for tagging a with at least one tag is .
The value of is determined from the data using the method of maximum likelihood. The likelihood probability density includes the possibility of detector biases (e.g., differences in reconstruction efficiency for positive and negative tracks) that may create false asymmetries. There are also terms that account for the behavior of backgrounds to the signal. These backgrounds are dominated by two sources: (1) short-lived prompt background from prompt production with a random , and (2) long-lived backgrounds from with a random . A plot showing the data and the result of the fit is shown in Fig. 6. The result is , where the error includes contributions from both the statistics and systematic effects (discussed below).

The left-hand side of the figure shows the data for which the candidates are contained in the silicon microstrip detector; the points are the data corrected by the dilution so that they represent the true asymmetry (this is in contrast to Fig. 4). The right-hand side of the figure shows the value of for the data not fully contained in the silicon microstrip detector. The two curves are the results of the fit to both the left-hand and right-hand data combined. The amplitude of the solid curve is the value of quoted above. The dashed curve is the same fit except that the value of is included as a fit parameter. The result of this fit is and . For comparison, a time-integrated determination of from these same data yields ; the resulting error is about larger, which gives an indication of the statistical improvement made possible by making a time-dependent determination of .
The statistics of the sample contribute to the total error. The main systematic contribution to the error is , which comes from the uncertainty in the dilutions of the flavor tags. This uncertainty is due to the limited statistics of the data used to calibrate the performance of the tags. As more data are accumulated in Run II, the sizes of both the sample and the calibration samples will increase so that the statistics of the signal will continue to dominate the error on .
The variation of the negative logarithm of the likelihood with follows a parabola near the minimum, so a confidence limit on may be derived in a straightforward manner. The Bayesian limit is at C.L. If the true value of were zero, then the probability of observing is . This result is the first compelling evidence that there is violation in hadron decays.
3 Future Expectations
At present, the CDF and D0 experiments are undergoing upgrades to improve the performance of the detectors for the upcoming data taking period that should begin in the year 2000. The new accelerator component, the main injector, will increase the production rate of antiprotons by approximately a factor of three over Run I rates. This increased rate will allow a substantial increase in instantaneous luminosity. The number of proton and antiproton bunches will be increased from six each in Run I, with bunches colliding every s, to thirty six each in Run II, with bunches colliding every ns. Eventually the machine will incorporate about 100 bunches each with collisions every ns. The term “upgrade” is inappropriate as the changes to the detectors are so substantial that much of the original components will be replaced. For example, both CDF and D0 are replacing their entire charged-particle tracking systems, and D0 is adding a 2 T superconducting solenoid. The electronics for components that were not upgraded have to be replaced to accommodate the shorter time between bunch crossings. Below we highlight the changes that are crucial for physics.
At CDF the important changes [10] are to the tracking system, the trigger, and to particle identification capabilities. There will be a new eight layer silicon system that extends from a radius of cm from the beam line to cm. This system will include and information to allow reconstruction in three dimensions. It will cover out to a pseudorapidity of , which will double the acceptance as compared to the Run I detector. A new central drift chamber has been constructed. The drift cell size has been reduced by a factor of four, and ultimately with use of a fast gas, the drift time will be reduced by a factor of eight from Run I. The goal is to maintain the excellent reconstruction efficiency and momentum resolution of the Run I drift chamber. The trigger system is pipelined to allow “deadtimeless” operation. In particular, fast tracking is now possible at level one, and information from the silicon detectors will be available at level two, making it possible to trigger on the presence of tracks originating from the decay of long-lived hadrons. This should allow triggering on all hadronic decays of hadrons such as , with , which is important for mixing, and , which is important for violation. Finally a time-of-flight detector will make kaon identification possible in a momentum range that is especially interesting for flavor identification.
The D0 detector is undergoing an even more radical change [11] than CDF. A superconducting solenoid (2 T) has been installed to allow momentum measurements. The main tracking device will be an eight-layer scintillating fiber detector with full coverage out to . A silicon microstrip tracker will be installed. It will consist of six barrel detectors, each with four layers, with both and read out, and sixteen disks extending out to m along the beam line. With this new spectrometer and tracking system, D0 will tag decays using displaced vertices. Finally, with improvements to the muon system and trigger, as well as the existing liquid argon calorimeter, D0 should be competitive with CDF for physics in Run II.
CDF and D0 will address many important questions in physics in Run II. Many of the relevant measurements have already been investigated using the Run I data. Among the more important goals are (1) the precise measurement of from flavor oscillations () (or from a measurement of ) or from radiative decays, e. g., the rate of compared to (); (2) the observation of violation in and the precise measurement of ; (3) the observation of violation in and a precise measurement of the asymmetry, which is related to ; (4) the search for large violation in (); (a large asymmetry would be an unambiguous signal of physics beyond the Standard Model); (5) the observation of decay modes related to angle : () and ; (6) the observation of rare decays such as , , and (); (7) the study of the meson () and baryons () . As long as the factories remain on the resonance, the topics marked by a dagger () will be unique to hadron colliders.
Many studies of these future topics have been performed. Here we summarize expectations for two more important measurements: (1) and (2) . A more complete discussion can be found in [12]. These projections (e.g., flavor tag performance) are based on Run I data from CDF as much as possible, and assume an integrated luminosity of 2 fb-1 collected during the first two years of operation. Although the expectations are specific to CDF, similar sensitivity should be possible with the D0 detector.
For the measurement of , the signal size should increase to 10 000 decays, where and . The flavor tags will be calibrated with samples of 40 000 (and charge conjugate) decays and 20 000 (and charge conjugate) decays. The expected combined flavor tag effectiveness of the same-side, lepton, and jet-charge tags discussed earlier is . The resulting estimate of the error on is . This uncertainty includes the systematic uncertainties in the dilutions due to the statistics of the calibration samples. The time-of-flight detector will make it possible to use a new opposite-side flavor tag based on kaons: the decays of hadrons containing () quarks usually produce (). With this additional flavor tag, the total flavor tag effectiveness could increase to [13].
Based on current experimental measurements and theoretical predictions, it is possible to predict the value of . For example, S. Mele [14] predicts (not including the latest measurement of from CDF). This current projection rivals the expected precision of the measurement in Run II, therefore, to really test our predictions and consistency within the Standard Model, even more precise measurements of will be necessary. This motivates the need for future experiments such as BTeV [1] at the Tevatron.
The other crucial measurement, which is attainable only at hadron colliders, is the measurement of . The upgraded CDF trigger will make it possible to trigger on fully reconstructed hadronic decays. A large sample of 20 000 fully reconstructed decays in the modes , with is expected. The time-of-flight detector will double the expected flavor tagging efficiency to by exploiting kaon identification in the same-side tag of mesons (see Fig. 2). The CDF silicon system will have excellent impact parameter resolution, and the expected proper lifetime resolution is fs. With all these improvements combined, a better than five-sigma measurement of is possible for ps-1 [13].
4 Summary
In Run I many important measurements of hadron decay properties were made at the Tevatron, despite severe trigger restrictions. Many of these measurements are similar or better in precision to measurements from colliders; some are unique to the Tevatron. In particular, a first indication of violation in the system was found yielding .
In Run II, improved detectors will increase the scope of physics at the Tevatron. The precision on should be competitive (and complementary) with measurements at the factories. Studies of violation in decays and the measurement of will be unique to hadron colliders. The Tevatron will play a crucial, unique role in our test of the CKM matrix.
5 Acknowledgements
I would like to thank the organizers of this conference for an enjoyable informative, and well organized meeting. This work is supported by DOE grant number DE-FGO2-95ER40893.
References
- [1] The BTeV Preliminary Technical Design Report, see www-btev.fnal.gov/btev.html.
- [2] L. Wolfenstein, Phys. Rev. Lett. 51, 1945 (1983).
- [3] C. Caso et al., Eur. Jour. Phys. C3, 1 (1998).
-
[4]
CDF Collaboration, F. Abe et al.,
Nucl. Instrum. Methods A271, 387 (1988);
CDF Collaboration, F. Abe et al., Phys. Rev. D50 (1994) 2966;
D. Amidei et al., Nucl. Instr. Methods A350, 73, (1994);
P. Azzi et al., Nucl. Instr. Methods A360, 137 (1995). - [5] CDF Collaboration, F. Abe et al., hep-ex/9903011, FERMILAB-PUB-99/019-E, accepted by Physical Review D.
-
[6]
M. Gronau, A. Nippe, and J. Rosner, Phys. Rev. D47, 1988 (1993);
M. Gronau and J. Rosner, Phys. Rev. D49, 254 (1994). - [7] CDF Collaboration, F. Abe et. al., Phys. Rev. Lett. 80, 2057 (1998) and Phys. Rev. D59, 032001 (1999).
- [8] CDF Collaboration, F. Abe et al., Phys. Rev. Lett. 81, 5513 (1998)
- [9] CDF Collaboration, T. Affolder et al., A measurement of from with the CDF detector, FERMILAB-PUB-99/225-E, submitted to Physical Review D.
-
[10]
CDF II Collaboration, The CDF II Detector Technical Design Report;
see also www-cdf.fnal.gov/upgrades/upgrades.html. - [11] see www-d0.fnal.gov/hardware/upgrade/upgrade.html.
- [12] M. Paulini, Int. J. Mod. Phys. A14, 2791 (1999).
- [13] Proposal for Enhancement of the CDF II Detector an Inner Silicon Layer and Time of Flight Detector (P-909), and Update to Proposal P-909: Physics Performance of the CDF II with an Inner Silicon Layer and a Time of Flight Detector. Both of these documents may be obtained at www-cdf.fnal.gov/upgrades/upgrades.html.
- [14] S. Mele, Phys. Rev. D59,113011 (1999).