Determination of the Total Production Cross Section in 340 -Nucleus Interactions
Abstract
The production of charmed particles by of momentum was studied in the hyperon beam experiment WA89 at the CERN-SPS, using the -spectrometer. In two data-taking periods in 1993 and 1994 an integrated luminosity of on copper and carbon targets was recorded. From the reconstruction of charm particle decays in 10 decay channels production cross sections for , , and were determined in the region . Assuming an dependence of the cross section on the nucleon number, we calculate a total production cross section of per nucleon. The last term is an upper limit on the unknown contribution from charmed-strange baryon production.
1 Introduction
Nearly 25 years after the discovery of the charm quark, charm hadron physics is still a major field of research. This results from the difficult identification of charm particle decays due to low production cross sections, short lifetimes and branching ratios of only a few percent in the principal decay modes. Not only the properties of the charmed hadrons themselves are the object of intense experimental studies. Charm quark production is also of interest, since it can be used for tests of QCD calculations. As the lightest of the “heavy” quarks, the charm quark is of special interest as its production can be described using perturbative methods and it is experimentally accessible with reasonable statistics.
Usually charm particle production is modeled as a two-step process involving different energy scales: one hard part, which describes the production of the charm quark pair itself, and the soft process of subsequent hadronization.
The elementary charm quark production process, dominated at typical fixed target energies by gluon-gluon fusion, has been calculated in the framework of perturbative QCD in leading and next to leading order, the NLO contributions exceeding the leading ones by a factor of three (see, for instance, nason89 ).
Because of the relatively small charm quark mass, NLO calculations still contain considerable uncertainties coming from uncertainties in the renormalization and factorization scales, unprecise parton density functions as well as the unknown charm quark mass. At present these uncertainties are much larger than the experimental errors. Therefore measurements of charm production in different beams and at different energies provide a data set on which many further developments of QCD-based calculations can be tested rigorously.
In fixed target experiments charm particle production has so far been studied mainly with pion and proton beams, with beam momenta ranging from 200 to 600 and 200 to 800 , respectively. Only few data on charm production by a kaon beam exist so far. All measured cross sections lie within the wide margins of the NLO calculations. Many of these experiments measured / production cross sections only, and the total charm production cross sections have to be extrapolated from these measurements.
In this paper we report on the first measurement of the total cross section in - nucleus interactions at , based on observed samples of , , , , and . Results on the charge asymmetries in the production of , , , and their antiparticles have already been published asym .

2 Experimental setup
Experiment WA89 at the CERN-SPS used a secondary beam of created in p-Be interactions. The detector was designed as a typical forward spectrometer, set up in the CERN West area around the -magnet, and consisted of a target region, a decay region, the -spectrometer, a ring imaging Cherenkov counter and an electromagnetic and a hadronic calorimeter. Figure 1 shows the setup in 1993 – the setup in 1994 differed only marginally.
The hyperon beam was produced from protons from the CERN-SPS impinging on a beryllium rod of length and diameter positioned upstream of the experimental target. A magnetic channel selected negative particles with a mean momentum of 345 GeV/c and a momentum spread of . A beam of protons per 2.1 seconds spill in a machine cycle of 14.5 seconds yielded about and at the experimental target. A transition radiation detector was used to suppress on the trigger level trad . A detailed description of the hyperon beam setup and parameters can be found in beam .
The experimental target consisted of one thick copper plate and three thick carbon plates spaced at intervals along the beam. For the carbon targets industrial diamond with a density of was used instead of graphite since it allows for thinner targets at the same interaction length, thus reducing the decay probability inside the target. The total interaction length of all targets was 4.95%. The spacing of ensured that most charm decays occurred in the gaps between the targets and hence had a lower background from secondary interactions.
A total of 23 silicon microstrip detectors with a pitch of 25 and , assembled closely downstream of the targets, was used for the reconstruction of the charm production and decay vertices. Another set of 14 planes upstream of the targets was used for beam track reconstruction micro .
The vertex area was followed by a long decay zone for short-living strange particles, equipped with 38 drift chamber planes with a wire spacing of , a sensitive area of and a spatial resolution of . The mean efficiency was 88%. To increase the tracking efficiency in the central region with its high track density the drift chambers were interleaved with 5 sets of MWPCs of 4 planes each. These MWPCs had a wire spacing of , a sensitive region of and an efficiency of 99%.
To improve the track connection between the target and decay regions three sets of 4 MWPCs with a wire spacing of were installed downstream of the target.
Particle momenta were measured in the -spectrometer, a super-conducting magnet with an integrated field of . A total of 45 MPWCs inside the magnet and 8 driftchamber planes and 4 MWPCs at the magnet exit allowed a momentum resolution of .
Charged particle identification was accomplished by a ring imaging Cherenkov counter with a long radiator volume filled with nitrogen at atmospheric pressure. The Cherenkov threshold was at . UV photons were detected in driftchambers filled with TMAE-saturated ethylene. A resolution of and a mean number of photoelectrons per ring, equivalent to a quality factor of , allowed pion/kaon and pion/proton separation up to a momentum of and , resp. with a rejection factor of 10 rich .
An electro-magnetic lead glass calorimeter and a hadronic lead/scintillator “spaghetti” calorimeter were located downstream of the RICH. Both were not used in the analysis presented here.
The trigger was relatively open and had an average efficiency of 60-70% for the charm decays discussed here. It required a minimum track multiplicity in the target region, derived from two scintillators placed after the first 12 microstrip planes. Also two high-momentum particles were required with their momenta estimated from hit correlations in scintillators and wire chambers inside and behind the magnet.
The experiment had two main data taking periods in 1993 and 1994 during which a total of 350 million interaction triggers were recorded, corresponding to an integrated luminosity of on copper and on carbon.
3 Data Analysis
Since there were only minor differences in the detector setups of 1993 and 1994, both data sets could be handled identically. The reconstruction of charm particle decays followed a candidate-driven approach: for each track combination in the target area whose charges matched the decay considered, reconstruction of the decay vertex was attempted. If the reconstruction was successful, the production vertex was reconstructed from the remaining tracks rejecting those which contributed most to the of the vertex fit until fell below a given limit.
| Decay mode | branching ratio | events/background | n | b [] | ||
|---|---|---|---|---|---|---|
Opposed to the total analysed sample which contains about 350 million events, the final charm samples show a total of only a few 100 entries per histogram. The reduction factor of more than was accomplished in three passes by cuts on (values in brackets give typical cut values and resolutions):
-
•
the separation between production and decay vertex ,
-
•
the impact parameter of the reconstructed charm candidate track w.r.t. the production vertex ,
-
•
the impact parameters of the decay vertex tracks w.r.t. the production vertex
Additional requirements were:
-
•
a decay vertex location outside the targets
-
•
a soft RICH identification of protons and kaons
Table 1 lists the reconstructed decay modes, the number of reconstructed events and the respective branching ratios. Figure 2 shows the corresponding signals.

Acceptances and reconstruction efficiencies were determined using a detailed Monte Carlo simulation of the experiment. The charm events were simulated by an inclusive event generator which generated the charm (anti-charm) particle considered according to the measured kinematic distributions. The associated anti-charm (charm) particle was produced with the same kinematic distributions as the first particle, taking into account the azimuthal correlation and distribution measured in a pion beam experiment beatrice:corr . For the associated particles a mixture of 25% of charged D-mesons, 50 % of neutral D-mesons and 25 % of was taken, in accordance with average yields of charmed particles measured in various experiments. The efficiencies were not sensitive to these percentages. The decay channel of the first particle was chosen explicitly while the decay of the associated charm particle was generated according to the known branching ratios. The remaining multiplicity of the event was generated by simulating the interaction of one hadron carrying the remaining momentum, using the Fritiof 7.02 fritiof event generator for hadron-nucleus interactions. The detector response was generated using Geant 3.21. About 80000 events were simulated per channel with different distributions to ensure sufficient statistics at high .


The efficiencies obtained for the different decay channels analyzed show a similar behaviour. As an example, figure 3 shows the efficiencies for as functions of and . While the efficiencies are practically flat in over the whole relevant region, the dependence on shows a sharp rise at about and levels off above at a value of 10% – 20%, depending on the decay channel. At high , the charm identification cuts produce a decrease in efficiency because of the difficulty to reconstruct a production vertex from the few remaining low momentum tracks, which often are not seen in the detector.
After the TRD decision in the trigger only of the beam particles are . A large amount of contamination originates from pions from decays between the end of the beam collimator and the target. These were suppressed by a cut on the track position/angle correlation which is fulfilled for beam particles coming from the production target, but not for decay pions (see beam for details). Table 2 shows the beam composition after this cut for both data taking periods. The remaining contributions are fast pions, misidentified as in the TRD, and a few and which cannot be distinguished from .
| beam component | 1993 | 1994 |
|---|---|---|
To correct for the beam contamination, we have to make assumptions about the dependence of the charm production cross section on the beam projectile. In experiment E769 Alves96b the ratio of / production by to production by protons was measured to be at 250 . With a 360 beam and a 400 proton beam, the LEBC-EHS (NA27) collaboration measured this ratio to be na27 . For the total charm production, a ratio was obtained in NLO and NNLO QCD calculations frixione97 ; smith97 . We therefore correct for the pion and kaon contamination by using a value of , which amounts to a shift of . The possible effect from the contamination is negligible in this context.
4 Cross Section Results
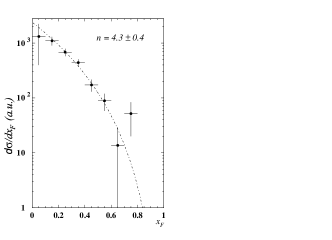
Since the detector acceptance drops sharply at small values of , the measured differential cross sections were extrapolated to using the usual ansatz where was obtained from a fit to the data above . As an example, the measured distribution for production is shown in figure 4 together with the fit results. The values of n obtained in the fits are included in table 1. The errors quoted are the statistical errors of the fits only. The values of n obtained are in agreement with values obtained in pion and proton beam experiments (beatrice ; Alves96b and earlier references therein). The errors preclude any conclusions about possible differences in n between the different charm particles produced in this experiment or between our beam result and the pion or proton beam results.
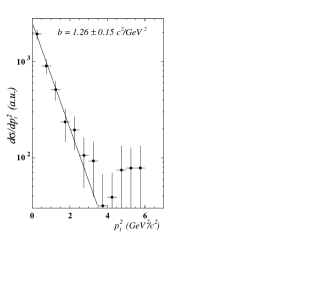
We also fitted the observed pt spectra with a form , assuming b to be independent of n. Figure 4 shows the spectrum and fit result for production, and the values of b obtained are listed in the last column of table 1. Again we observe agreement with the earlier experiments quoted above, but are unable to draw further conclusions.
The data from both targets were added and extrapolated from -nucleus to -nucleon cross sections assuming an dependence with =1. The same dependence was used in the analyses of the proton beam experiments listed in table 4. The most precise measurements of the exponent in charm production come from the pion beam experiments WA82 wa82alpha , E769 e769alpha and BEATRICE(WA92) beatrice . The averages from the three experiments are for both / and production, with no significant dependence of on the longitudinal or transverse momenta. Use of would increase the resulting -nucleon cross sections by a factor of 1.13 (1.23) for carbon (copper) targets.
| Decay | ||||
| 2.93 0.29 | 2.35 0.33 | |||
| 2.07 0.41 | 2.38 0.52 | |||
| mean | 2.64 0.24 | 2.36 0.28 | ||
| 1.30 0.14 | 1.13 0.16 | |||
| 1.60 0.42 | ||||
| 2.37 0.68 | ||||
| Sum | 5.54 0.51 | 5.86 0.75 | ||
The resulting integrated cross sections are listed in table 3. A first consistency check of the analysis can be obtained by comparing the results from the two-body and four-body decay modes of the , which are in good agreement.
The total production cross section is taken to be the mean of the sums of the observed charm and anticharm cross sections (using a weighted mean for the two cross sections) with the result: .
Extensive studies of possible systematic effects have been carried out. No considerable dependence of the result on the cut values or on reasonable variations of detector efficiencies was found. We assign an overall systematic error of to all cross sections due to the uncertainties of the Monte Carlo simulation, the extrapolation to =0 and the luminosity measurement.
Our cross section result is based on the observation of and mesons, to which all excited charm mesons will eventually decay, and of , to which all charmed non-strange baryons will decay. Therefore possible undetermined contributions from charm anti-baryons and from charmed-strange baryons remain, which will be discussed in the following.
A significant contribution to the total cross section by charm anti-baryons is not expected due to the observed strong asymmetry in / production asym . From the results of a direct search for charmed-strange baryon production, we cannot exclude production cross sections of theses . We therefore add a further systematic uncertainty of from production to our total production cross section. A contribution from should be small compared to the overall uncertainties.
The total production cross section for then is:
| Experiment | beam, | targets | xF range | for x | |
|---|---|---|---|---|---|
| mom. | |||||
| NA32 accmor | p, 200 | Si | 1.50.7 | 0 | 2.251.10 |
| E769 Alves96b | p, 250 | Be,Al,Cu,W | 9.01.5 | 0 | 13.52.9 |
| NA27 na27 | p, 400 | p | 30.22.9 | all | 22.63.8 |
| E653 e653 | p, 800 | emulsion | 7620 | all | 5717 |
| E743 e743 | p, 800 | p | 4812 | all | 3610 |
| WA89 | , 340 | C,Cu | 7.41.5 | 0 | 11.32.4+2.0 |

5 Discussion
In the hyperon beam experiment WA89 at CERN, close to 1000 charm particles were found in 340 -nucleus interactions. We determined production cross sections for , , , and in the region . While a clean signal could be observed, the could not be singled out. This suppression of antibaryon production in baryon beams is well known from non-charm baryon production. The cross sections for and / production are comparable. The suppression of production relative to is probably caused by the suppression of production relative to production, while the quark of the can be supplied by the beam particle. From this argument one would expect an enhancement of over production as well, but this enhancement is not so strong since light antiquarks are produced more copiously than the heavier quarks. Indeed, we observed a significant production asymmetry at larger asym , but the effect on the integrated cross section for is not observable within the errors of our measurements.
In figure 5 and in table 4 our result for the ( or ) production cross section is compared to measurements in proton beams Alves96b ; na27 ; accmor ; e653 ; e743 . Proton beam measurements valid for have been divided by 2 for this comparison. Our result is significantly lower than the proton beam values. It is not clear, however, whether for this comparison we should include all or part of our measured value for production, , since our beam projectile carries a strange quark.
Our measured value for the ratio of charged and neutral / production, , is compatible with the mean value from the proton beam experiments Alves96b ; na27 ; e653 ; e743 , . The corresponding ratio from pion beam experiments at beam energies between 200 and 600 is in good agreement with our result (for the pion beam results, see ref. beatrice and earlier references therein). For the ratio of and production we obtained . This ratio has not been measured in proton beams. In the pion beam experiments quoted above, the ratio of and production to production has been measured to be . Since both and are non-leading when produced in a pion beam, we can safely assume that in pion beams, which is markedly lower than our beam result. This is another clear manifestation of the leading particle effect.
Theoretical calculations exist only for the total charm production cross section, , for all xF. Therefore our result and the results of the proton beam experiments Alves96b ; accmor , obtained in the kinematic region x, were multiplied by a factor of 2. This factor of 2 holds for interactions with equal beam and target particles, but even in N interactions, no significant deviation from 2 is expected, since the production cross sections integrated over the range show only small differences between leading and non-leading charm hadrons as discussed above. Furthermore, the / production cross sections measured in the proton beam experiments have to be extrapolated to total charm production. Our value for the ratio of total charm production to / production is . The E769 collaboration Alves96b measured and in their proton beam, which is consistent with our ratio. In their pion beam they measured (particles and antiparticles added). In the photoproduction experiment NA14/2 this ratio was measured to be 0.360.11 na14/2 . These values indicate that the ratio does not depend strongly on the nature of the beam particle. We used a value to calculate from the proton beam results on . Finally, the production cross section for -pairs, , was obtained by dividing the above results for or by a factor of 2. The results are listed in the last column of table 4 and are compared in figure 6 with theoretical calculations. The dashed/solid/dotted bands were obtained by Frixione et al. in NLO QCD-calculations for charm quark mass values of 1.2/1.5/1.8 , respectively frixione97 . The width of the bands for fixed is given mainly by the uncertainties of the renormalization scales. The proton beam measurements prefer the upper range of the predictions, and seem to exclude a value of . This holds also for charm production measurements in pion beams, as discussed in frixione97 ; frixione94 . The thick dot-dashed line denotes the results of Smith and Vogt smith97 for a charm quark mass of 1.5 . These authors used resummation techniques and approximations for NNLO. At our beam energy, their results are larger by a factor 3 than the NLO calculations for the same charm quark mass.

Our experiment provides the first comparison of charm production by and by protons. Our result seems to be lower than the proton beam results, in line with the observation that the total N cross sections are smaller than the pp cross sections sigma-cross . However, in view of the problems encountered when comparing cross sections from different experiments, it may be premature to claim that or is smaller in than in proton beams. The forthcoming results from the hyperon beam experiment SELEX at FNAL will help to clarify this point selex .
References
- (1) P. Nason, S. Dawson, R.K. Ellis, Nucl. Phys. B 327, 49 (1989)
- (2) WA89 collaboration, M.I. Adamovich et al., Eur. Phys. J. C 8, 593 (1999)
- (3) W. Brückner et al., Nucl. Instr. Meth. A 378, 451 (1996)
- (4) Yu.A. Alexandrov et al., Nucl. Inst. Meth. A 408, 359 (1998)
- (5) W. Brückner et al., Nucl. Instr. Meth. A 348, 444 (1994), Nucl. Instr. Meth. A 357, 274 (1995)
- (6) W. Beusch et al., Nucl. Instr. Meth. A 323, 373 (1992); H.-W. Siebert et al., Nucl. Instr. Meth. A 343, 60 (1994); U. Müller et al., Nucl. Instr. Meth. A 371, 27 (1996)
- (7) The particle data group, Phys. Rev. D 54, 1 (1996)
- (8) BEATRICE collaboration, M.I. Adamovich et al., Phys. Lett. B 385, 487 (1996)
- (9) H. Pi, Comput. Phys. Comm. 71, 173 (1992)
- (10) E769 collaboration, G.A. Alves et al., Phys. Rev. Lett. 77, 2388 and 2392 (1996)
- (11) LEBC-EHS collaboration, M. Aguilar–Benitez et al., Z. Phys. C 40, 321 (1988)
- (12) S. Frixione et al., CERN-TH/97-16, hep-ph/9702287
- (13) J. Smith and R. Vogt, Z. Phys. C 75, 271 (1997)
- (14) WA82 collaboration, M.I. Adamovich et al., Phys. Lett. B 284, 453 (1992)
- (15) E769 collaboration, G.A. Alves et al., Phys. Rev. Lett. 70, 722 (1993)
- (16) BEATRICE collaboration, M.I. Adamovich et al., Nucl. Phys. B 495, 3 (1997)
- (17) C. Busch, thesis, Heidelberg 1998 (unpublished); H. Neeb, thesis, Heidelberg 1998 (unpublished)
- (18) ACCMOR collaboration, S. Barlag et al., Z. Phys. C 39, 451 (1988)
- (19) E653 collaboration, K. Kodama et al., Phys. Lett. B 263, 573 (1991)
- (20) LEBC-MPS collaboration, R. Ammar et al., Phys. Rev. Lett. 61, 2185 (1988)
- (21) M.P. Alvarez et al., Z. Phys. C 60, 53 (1991)
- (22) S. Frixione et al., Nucl. Phys. B 431, 453 (1994)
- (23) S.F. Biagi et al., Nucl.Phys. B 186, 1 (1981)
- (24) SELEX collaboration, J. Russ et al., CMU-HEP98-07 and hep-ex 9812031