Studies of Higher Twist and Higher Order Effects in NLO and NNLO QCD Analysis of Lepton-Nucleon Scattering Data on and
Abstract
We report on the extraction of the higher twist contributions to and from global NLO and NNLO QCD fits to lepton nucleon scattering data over a wide range of . The NLO fits require both target mass and higher twist contributions at low . However, in the NNLO analysis, the data are described by the NNLO QCD predictions (with target mass corrections) without the need for any significant contributions from higher twist effects. An estimate of the difference between NLO and NNLO parton distribution functions is obtained.
pacs:
13.60.Hb, 12.38.Qk, 24.85.+p, 25.30.Pt1 Introduction
Within the theory of Quantum Chromodynamics (QCD) Parton Distribution Functions (PDFs) are extracted from global fits to deep-inelastic (DIS) structure functions measured in lepton-nucleon scattering experiments. At present, PDFs are available from QCD fits MRSR2 ; CTEQ4M ; GRV94 (to various processes including the structure functions and ) performed to order (Next-to-Leading Order, NLO) in perturbation theory NLO . If the range of the fits is extended to low momentum transfer (), the data indicate dupaper that both target mass (TM) corrections GPtm and higher twist (HT) effects renormalon must be included. Understanding of the various contributions to the nucleon structure functions is important in view of the high precision data at low that is about to come out from HERMES, H1 and Zeus, and from experiments at the CEBAF facility at Jefferson Lab. In this communication we show that if the fits are performed with the inclusion of the higher order NNLO terms (Next-to-Next-to-Leading, NNLO), the extracted higher twist terms are small. The higher twist terms extracted in NLO analyses appear to originate from missing NNLO terms.
In all QCD calculations, physical observables for interactions with hadrons are calculated in terms of integrals of products of hard scattering coefficient functions and parton distribution functions. The coefficient function is a generalization of the Born elastic parton scattering cross section. All NLO QCD analyses of structure function use one-loop coefficient functions and two loop splitting functions (needed for the evolution of PDFs from low to high ). However, recent precise measurements of DIS sum rules, and of cross sections for the production of top quarks, and bosons in high energy proton-antiproton collisions pose a new challenge to theory and require better predictions from QCD. The calculations for these processes require both two-loop coefficient functions (which have been calculated) and NNLO PDFs. Unfortunately, NNLO PDFs are not yet available, because only the first few moments of the three-loop splitting functions have been calculated to date. Therefore, it has been the practice to use NLO PDFs as input to the NNLO expressions. In this communication we also obtain an estimate of the difference between NLO and NNLO PDFs in a phenomenological way. This difference may be used in estimating the uncertainty in the higher order NNLO QCD calculations from this source.
2 NLO QCD analysis
First, we perform an extraction of the higher twist contributions within a NLO analysis dupaper . All DIS proton and deuteron data (SLAC, BCDMS, and NMC) SLACF2 ; BCDMSF2 ; NMCF2 are used in this analysis. We also include very high SLAC proton data (between and ) SLACres that were not included in any previous analysis. Corrections for nuclear binding effects GOMEZ in the deuteron are applied as described in our previous communication dupaper . We use the MRS(R2) PDF (with a modified d quark distribution dupaper that fits the large deuteron data which are corrected for the nuclear binding effects). We use the Georgi-Politzer calculation GPtm for the target mass corrections. These involve using the scaling variable instead of . Higher twist effects originate when scattering from a single quark cannot be resolved at lower . Both the target mass and the higher twist effects are suppressed by powers of
We extract the magnitude of the higher twist terms from the data within the framework of the renormalon model renormalon . In the renormalon model approach, the model predicts the complete dependence of the higher twist contributions to , (and therefore ), and , with only two unknown parameters and which determine the overall level of the and terms. We extract the and parameters, by fitting to the global data set for and . The values of and for the proton and deuteron are the same in this model. The dependence of non-single part of differs from that of , but is the same as that of within power correction.


The higher twist coefficients are extracted from a global fit to all DIS in the kinematic region (, GeV2) with the following form; . Here is a floating factor to investigate possible dependent corrections to the PDFs. If the PDFs provide a good representation of the data, should be close to 1.0. We allow a different floating factor for the proton and deuteron data. The floating factors for the proton and deuteron data are an indication on how well the standard PDFs describe the distribution of quarks and quarks, respectively. The normalization of BCDMS BCDMSF2 and NMC NMCF2 relative the SLAC SLACF2 data are allowed to float within the errors. In the case of the BCDMS data, a systematic error shift Virchaux (in standard deviation units) is allowed to account for the correlated point-to-point systematic errors. The higher twist fits with the modified NLO MRS(R2) pQCD prediction including TM effects are performed simultaneously on the proton and deuteron data with 7 free parameters (two relative normalizations per target, the two higher twist parameters and the BCDMS ). In addition, 10 floating factors for the deuteron (at values of 0.10, 0.14, 0.18, 0.225, 0.275, 0.35, 0.45, 0.55, 0.65, and 0.75) and 11 floating factors for the proton (with the addition of =0.85) are allowed to vary.
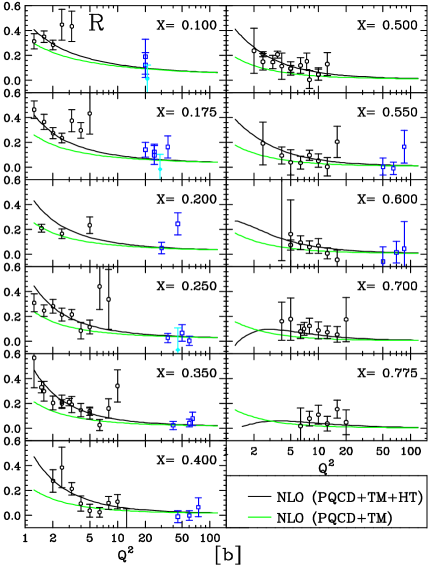
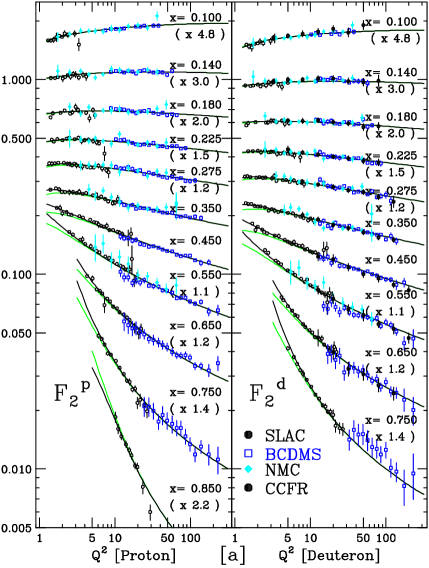
Figure 1 shows that the QCD NLO fit with TM effects and with the renormalon model higher twists contributions yields a reasonable description (, ) of the and dependence for and with just the two free higher twist parameters. The CCFR neutrino data CCFRF2 are shown for comparison though they are not used in the fit. The extracted values of and are and , respectively. The contribution of is found to be negligible in this NLO analysis. The relative normalization of the NMC and BCDMS data to the SLAC data, and major systematic error shift of the BCDMS data are shown in Table 1. Figure 2 shows the extracted floating factor as a function of for the proton and deuteron respectively. The fact that the extracted values are close to 1.0 indicates that the modified NLO MRS(R2) PDFs provide a good description of the quark distributions. At the highest value of (=0.85) the floating factor is higher. Note that because there are no data at very high at this value of , there may be a strong correlation between the floating factor and the higher twist contribution. It is also possible that the renormalon higher twist model does not account for all the physics beyond NLO in the very high region. Since our modifed MRS(R2) PDFs have an enhanced quark distribution at high than the standard MRS(R2) PDFs, we also investigate the sensitivity of the extracted higher twist terms to the choice of the high quark distribution. We obtain very similar values for the higher twist terms (=, =, and ) if we use the standard MRS(R2) PDFs in the fit (in this case, the nuclear corrections to the deuteron data are not applied). However, the floating factors for the deuteron at high are higher than the floating factors for the proton, as shown in Fig. 3. This indicates that the quark distribution in the standard MRS(R2) PDFs is indeed underestimated at high .
| NMC(%) p(d) | BCDMS(%) p(d) | BCDMS | |
|---|---|---|---|
| NLO | 1.0 ( 0.5 ) | -4.5 ( -2.5 ) | 1.8 |
| NNLO | 1.9 ( 1.3 ) | -2.7 ( -0.8 ) | 1.2 |

The magnitude of the higher twist terms extracted in this NLO analysis is almost half of the size from a previous NLO analysis of SLAC/BCDMS data Virchaux , because that analysis was based on () , while () in the MRS(R2) PDF, which is close to the current world average. Within the renormalon model, our fits can also be used to estimate the size of the higher twist effects in [e.g. the Gross-Llewellyn Smith (GLS) sum rule] in NLO, as the higher twist terms in and are related to the higher twist terms in . However, since the QCD predictions for the GLS sum rule have been calculated to higher order on QCD, it is important to understand if these significant higher twist contributions extracted in the NLO analysis originate from real and terms, or do they partly describe the missing higher order NNLO terms.

3 NNLO QCD analysis
We now proceed to repeat the analysis, but now include the NNLO contributions to and . Since the NNLO PDFs are not available, the approach taken in our analysis is that we input NLO PDFs into the NNLO expression for and . The NNLO theoretical predictions are compared to the data, and as was done in our previous NLO fit, we extract the higher twist coefficients and (from the dependence comparison) and the floating factor (from the dependence comparison). The higher twist coefficients and can be interpreted as representing both the higher twist terms and the difference in the dependence between the input NLO PDFs and the unknown NNLO PDFs. The ratio can be interpreted as the ratio of NNLO to NLO PDFs as a function of .
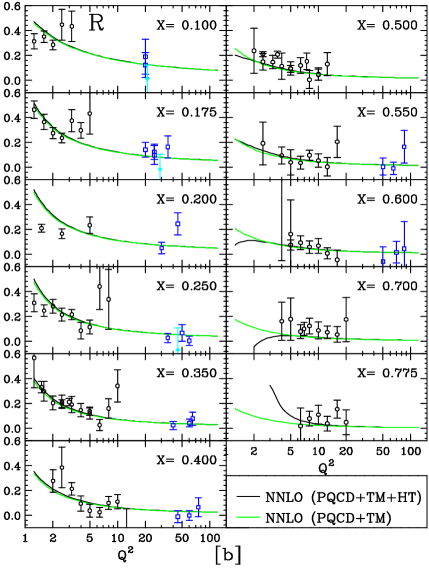
Figure 4 shows that the fit including the NNLO contributions yields a good (, ) description of the and dependence for and . The relative normalizations of the NMC and BCDMS data and major systematic error shift of the BCDMS data are also shown in Table 1. The extracted values of and are and , respectively. The contribution of is found to be negligible in this NNLO analysis, and the term is small but finite. These results indicate that most of the higher twist contributions extracted in the NLO fit at low appear to originate from the missing NNLO terms. We also achieve the same conclusion even if we adopt the empirical higher twist model dupaper by using only data. In fact, Fig. 5 shows that the dependence of the NNLO contributions to is similar to that of the higher twist terms extracted in the NLO analysis. The small contribution of the higher twist terms to and in the NNLO analysis also indicates that the higher twist contributions to the GLS sum rule are very small. The above values of and yield a fractional contribution to the pQCD GLS sum rule of . Similar conclusions for the GLS sum rule (from an global analysis of data on only) have been reported russian elsewhere.
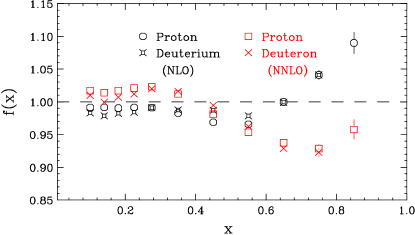
Since the dependence of the data is well described by the fit, the results also imply that the dependence of the NNLO and NLO PDFs are mostly the same. This conclusion is in agreement with most recent estimates of the three-loop splitting functions for the NNLO PDFs by van Neerven and Vogt nnlo_van . The ratio of NNLO to NLO PDFs as a function of can be obtained from the ratio . Figure 6 shows the floating factor as a function of for the proton and deuteron respectively. At low , the is few percent higher than , thus indicating that NNLO cross sections for the top quark, and production will be somewhat increased if our NNLO corrections to the NLO PDFs are used for the NNLO PDFs (instead of NLO PDFs). For example, in the case of production at the Tevatron, the total theoretical cross section would be about higher (which will bring the theory into closer agreement with the data Zprod ). At large the NNLO PDFs may be about lower than the NLO PDFs mainly due to the two-loop coefficient functions. The NNLO contributions to appear to account for most of the higher twist effects extracted in the NLO fit. Since the NNLO terms are important at small (especially for , in which the overall level of in NNLO cancels out), we also conclude that with the increasing precision of the data from HERA, these terms should no longer be neglected. Note that our conclusions are not sensitive to the choice of model that is used to describe the behaviour of the higher twist terms. The same conclusions are obtained if we use an empirical higher twist model dupaper to fit the data.
4 Conclusion
In conclusion we find that a next-to-next-to-leading order (NNLO) analysis of and shows that most of the higher twist contributions extracted in the NLO fit at low appear to originate from the missing NNLO terms. Within the renormalon model, the higher twist terms in and are related to the higher twist terms in . Therefore, the results imply that the higher twist contributions to the GLS sum rule for are very small. The analysis indicates that NNLO PDFs are a few percent higher than NLO PDFs at small ( near 0.1) which is the region that contributes the most to top quark, and production cross sections at the Tevatron. At higher the NNLO PDFs are about lower than the NLO PDFs. The estimated ratio of NNLO to NLO PDFs from our analysis may be used to estimate the additional uncertainty in NNLO calculations which originates from the fact that NNLO PDFs are not currently available. Our results are in agreement with most recent estimates of the three-loop splitting functions for the NNLO PDFs by van Neerven and Vogt nnlo_van .
References
- (1) A.D. Martin et al., Phys. Lett. B 387, 419 (1996).
- (2) H.L. Lai et al., Phys. Rev. D 55, 1280 (1997).
- (3) M. Gluck et al., Zeit. Phys. C67, 433 (1995).
- (4) G. Altarelli and G. Parisi, Nucl. Phys. B 126, 298 (1977); V. N. Gribov and L. N. Lipatov, Sov. J. Nucl. Phys. 15, 438 (1972); Yu L. Dokshitzer Sov. Phys. JETP 46, 641 (1977).
- (5) U. K. Yang and A. Bodek, Phys. Rev. Lett. 82, 2467 (1999).
- (6) H. Georgi and H.D. Politzer, Phys. Rev. D 14, 1829 (1976).
- (7) M. Dasgupta and B.R. Webber, Phys. Lett. B 382, 273 (1996).
- (8) E. B. Zijlstra and W. L. van Neerven, Nucl. Phys. B 383, 525 (1992); Phys. Lett. B 273, 476 (1991); B 272, 127 (1991); J. Sanchez Guillen et al., Nucl. Phys. B 353, 337 (1991); L. H. Orr and W. J. Stirling, Phys. Rev. Lett. 66, 1673 (1991).
- (9) L.W. Whitlow et al., Phys. Lett. B 282, 475 (1992).
- (10) A.C. Benvenuti et al., Phys. Lett. B 223, 485 (1989); A.C. Benvenuti et al., Phys. Lett. B 237, 592 (1990).
- (11) M. Arneodo et al., Nucl. Phys. B 483, 3 (1997).
- (12) P. Bosted et al., Phys. Rev. D 49, 3091 (1994).
- (13) J. Gomez et al., Phys. Rev. D 49, 4348 (1994).
- (14) W.G. Seligman et al., Phys. Rev. Lett. 79, 1213 (1997).
- (15) M. Virchaux and A. Milsztajn, Phys. Lett. B 274, 221 (1992).
- (16) S. I. Alekhin and A. L. Kataev, Phys.Lett. B452, 402 (1999).
- (17) W.L. van Neerven and A. Vogt, INLO-PUB 14/99, hep-ph/9907472 (July 1999).
- (18) T. Affolder et al., FERMILAB-PUB-99-220-E, submitted to Phys. Rev. Lett.