The Search for Neutrino Oscillations with KARMEN
KARMEN, the KArlsruhe Rutherford Medium Energy Neutrino experiment, is located at the pulsed spallation neutron source ISIS of the Rutherford Appleton Laboratory. In the ISIS beam stop , and are produced from the – decay chain at rest with energies up to 52.8 MeV. Besides a very low contamination, ISIS stands out for its unique time structure. This allows for a highly sensitive search for –oscillations with the KARMEN detector, a 56 t segmented liquid scintillation calorimeter with very good time, energy and position resolution. In 1996 an additional third veto counter was installed within the 7000 t steel blockhouse that shields the detector against cosmic induced background. Covering the detector from all sides it strongly reduces the background of cosmic induced high energy neutrons by a factor of 40. Here we present the data taken after this major upgrade from Feb. 1997 until Feb. 1999. Since there is no indication for any beam excess, an upper limit for the oscillation is deduced using the Unified Approach based on a maximum likelihood analysis. The result, as all the data presented before, questions the interpretation of the LSND beam excess as an indication for oscillation.
1 Introduction
The search for neutrino oscillations is one of the most fascinating topics of modern particle physics. The KArlsruhe Rutherford Medium Energy Neutrino experiment KARMEN searches for neutrino oscillations in different appearance ( [2] and ) and disappearance modes ([3]). The physics program of KARMEN also includes the investigation of –nucleus interactions [4] as well as the search for lepton number violating decays of pions and muons and a test of the V–A structure of the decay [5]. In the following we present the result of the search for oscillation on the basis of the data taken from February 1997 until February 1999 (KARMEN 2 data) after the experiment upgrade in 1996. The data taken before the upgrade from 1990 - 1995 (KARMEN 1 data) is not included in the analysis. Such a combined analysis would yield a much lower sensitivity due to the relatively high cosmic induced neutron background of the KARMEN 1 data. In the data set presented here we measure the expected number of background events. Therefore we used the Unified Approach [6] based on a maximum likelihood analysis to derive a 90 % confidence interval.
2 Neutrino Production and Detection
The KARMEN experiment utilizes the neutrinos produced by the neutron spallation source ISIS of the Rutherford Appleton Laboratory in Chilton, Oxon, UK. An intense beam (A) of protons is accelerated to an energy of 800 MeV by a rapid cycling synchrotron. The two parabolic proton pulses of 100 ns base width and a gap of 225 ns are produced with a repetition frequency of 50 Hz (duty cycle is ). The protons are stopped in the compact tantalum beam stop. Apart from spallation neutrons a large number of pions is produced and stopped immediatly within the target. While almost all undergo nuclear capture, the decay at rest (DAR) into and . The are also stopped within the target and decay at rest via . The minor fraction of that decays in flight ( relative to DAR) with an again suppressed subsequent decay leads to an extreme small contamination of [7]. The energy spectra of the neutrinos are well defined due to the DAR of both the and . The from -decay is monoenergetic with E()=29.8 MeV; the continuous energy distributions up to 52.8 MeV of the and can be calculated using the V-A theory and show the typical Michel shape. Therefore ISIS is a unique, isotropic source of , and from - DAR that stands out for its time structure, the small contamination and the well defined time and energy distribution of the produced neutrinos.
These neutrinos are detected with the KARMEN detector, a segmented calorimeter of 56 t of liquid scintillator. The matrix structure consists of 512 () optically independent modules with a cross section of and a length of 353 cm. The segmentation is made of thin double acrylic walls separated by a small air gap. Every module is read out by two 3 inch photo tubes at each end. The position of an event within one module is given by the time difference between the photo tubes at both ends. The optimized optical properties of the organic liquid scintillator and an active volume of 96% result in an energy resolution of . Gd2O3 coated paper within the module walls provides an efficient detection of thermal neutrons owing to the very high capture cross section of the Gd ( n, ) reaction ( barn). The KARMEN electronics is synchronized to the ISIS proton pulses to an accuracy of 2 ns to fully exploit the time structure of the neutrinos. The detector is well protected against beam correlated background as well as the hadronic component of the cosmic radiation by a blockhouse made of 7000 t of steel. Cosmic muons entering or stopping close to the detector are identified by the two inner veto counters. The innermost veto covers the calorimeter from four sides and consists of modules identical to those of the calorimeter but half their width. The second veto counter is made of 136 plastic scintillator modules that shield the detector from five sides. With this configuration (KARMEN 1), the dominant background for the search for oscillations were high energetic neutrons produced by cosmic muons within the steel blockhouse. To eliminate this background source an additional third veto counter made of 136 plastic szintillator modules with a total area of 300 m2 was installed in 1996 [8]. It was placed right inside the steel blockhouse such that every muon is detected that could produce a neutron within the blockhouse at a distance of up to 1 m from the detector. With this configuration (KARMEN 2) cosmic induced background is considerably reduced by a factor of 40.
3 oscillation signature
The probability for oscillations can be written in a simplified 2 flavor description as
| (1) |
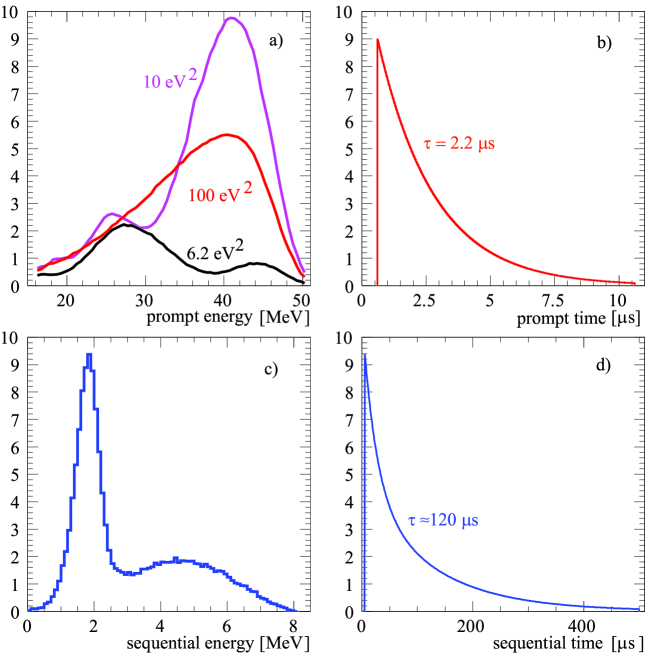
where L is given in meters, is the neutrino energy in MeV, and m2 denotes the difference of the squared mass eigenvalues in eV2/c4. The signature for the detection of a is a spatially correlated, delayed coincidence of a positron from p ( , e+ ) n with energies up to MeV followed by the emission of either of the two neutron capture processes p ( n, ) or Gd ( n, ). The p ( n, ) reaction leads to one with an energy of MeV whereas the Gd ( n, ) process leads to 3 in average with a sum energy of 8 MeV. The positrons are expected with a 2.2 s exponential decrease of to the decay after beam on target. The time difference between the positron and the capture is given by the thermalization and diffusion of the neutron.
To suppress cosmic induced background, a positron candidate is accepted
only if there is no activity in the central detector and in both inner veto
counters up to 24 s before. When only the outermost third veto counter
was hit, a dead time of 14 s is applied.
The unique signature of the p ( , e+ ) n reaction allows already for a strong
discrimination of cosmic and neutrino induced background.
The following cuts are introduced to maximize the sensitivity of the
experiment: The positron has to be detected in a time window from
s after beam on target with its energy in the range
from MeV. The sequential gamma must have an energy below 8 MeV
and has to be correlated in space (within 1.2 m3)
and time (s) to the positron. For these cuts the total
detection efficiency is – slightly depending on m2 –
approximately 20 %. The expected signature for oscillation sequences
in the KARMEN detector is shown in Fig. 1.
| Background reaction | events (E16MeV) | events (E36MeV) |
|---|---|---|
| 12C ( , e- ) 12Ng.s. reaction | ||
| induced random coincidences | ||
| contamination from ISIS | ||
| cosmic induced background | ||
| total expected background | ||
| measured sequences | 8 | 0 |
| p ( , e+ ) n reactions for sin |
4 Background Sources
One of the main advantages for the search of oscillations with the KARMEN experiment is that the expected background is not only very small but also known with a high percision because most of it can be independently measured by applying different cuts. There are only four different sources of background:
-
•
induced sequences caused by the charged current reaction 12C ( , e- ) 12Ng.s. where the subsequent decay of the 12Ng.s. ( ms) occurs within the first 300 s.
-
•
Neutrino reactions that have a random coincidence with a low energy event from the natural radioactivity inside the detector.
-
•
The small intrinsic contamination from the - decay chain in the ISIS target.
-
•
Undetected cosmic muons which enter the detector or produce high energy neutrons via deep inelastic scattering in the inner part of the steel blockhouse.
The only background source not accessible to direct measurement is the contamination. It is calculated using a detailed MC simulation of the ISIS target as well as all pion and muon production and decay or capture reactions [7]. Table 1 lists all background reactions and gives the number of expected events as well as their errors for the above defined cuts.
5 Maximum Likelihood Analysis
The maximum likelihood (ML) analysis is the most powerful method to infer the strength of a possible signal or to derive an upper limit if such a signal is not seen. Because of some advantages over other methods we use here the Unified Approach [6] recommended by the PDG [9] to derive a 90 % confidence interval from our ML analysis. For this ML analysis every background reaction and a possible oscillation signal are taken into account with their different probability density functions for the time and energy of the prompt event (the e+) as well as the energy, and the time and position difference of the sequential event (the neutron capture) relative to the prompt event. The relative contributions of the individual background sources to the total number of background sequences is fixed whereas the number of oscillation sequences is allowed to vary freely. As an additional information, the likelihood function (LF) is weighted with a factor that is the conditional poisson probability of the number of inferred background sequences given the expectation value of the total background. The resulting LF depends on m2 and sin only, and thus for a given m2 only on the number of oscillation sequences NO infered (or the number of background sequences NB , for NB=Ntotal-NO).
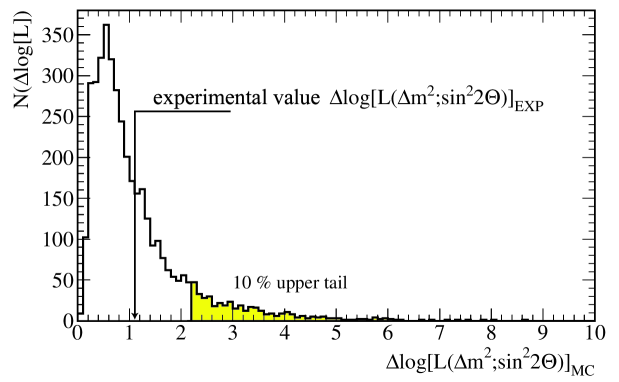
For the Unified Approach we divided the relevant [m2;sin] parameter space in the interval [] using a logarithmically equidistant grid of points [10]. At every point on the grid we generate 8000 MC data samples according to the expected background and the given values of m2 and sin for this point. To these data samples the same ML analysis as to the experimental sample is applied. For every MC sample of this specific point on the grid one calculates the logarithm of the likelihoodratio of the value of the LF at its global maximum in the [m2;sin] parameter space to the value of the LF at the given point on the grid for which the sample was generated. This procedure gives a characteristic MC generated distribution of for every point on the grid which is then compared to the value of the experimental data set (i.e. the logarithm of the ratio of the experimental LF at its global maximum to its value at a given point on the grid). The 90 % confidence interval (C.I.) is the set of points on the grid for which the experimental value is smaller than at least 10 % of all MC generated (see Fig. 2). If, on the other hand, for given parameters [m2;sin] lies in the upper 10 % tail of the MC distribution this point on the grid does not belong to the 90 % confidence interval. The upper 90 % confidence limit (C.L.) as shown in Fig. 4 is the upper limit of the 90 % C.I.. The interpretation of this C.L. is that for all parameter combinations m2 and sin on this curve 90 % of a large number of hypothetical KARMEN experiments would have seen a larger “signal” (i.e. smaller ) than the one actually observed if – and this is important – the true parameters of the oscillation were in this region of the parameter space.
6 Results and Conclusion
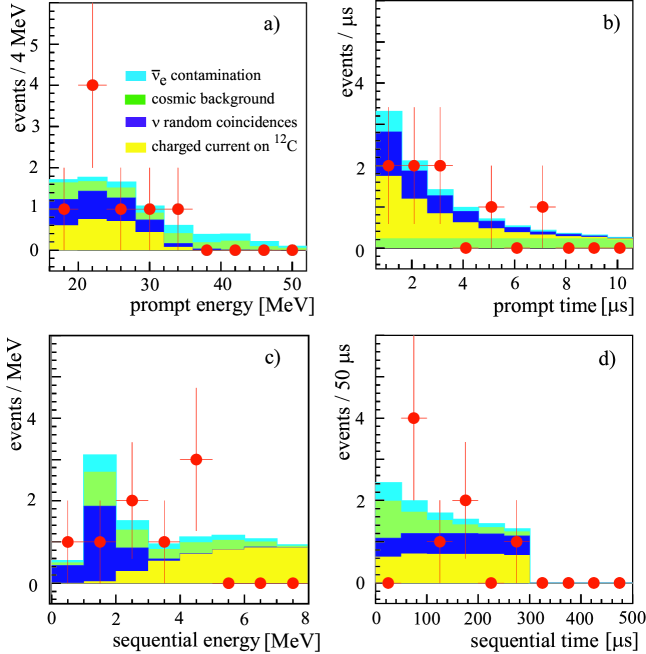
The results presented here are based on the data recorded in the measuring period from February 1997 to February 1999 which corresponds to 4670 C protons on target. Within the cuts defined in Sect. 3 we find 8 sequences as shown in Fig. 3. Since we expect a total background of sequences there is absolutely no indication for a beam excess.
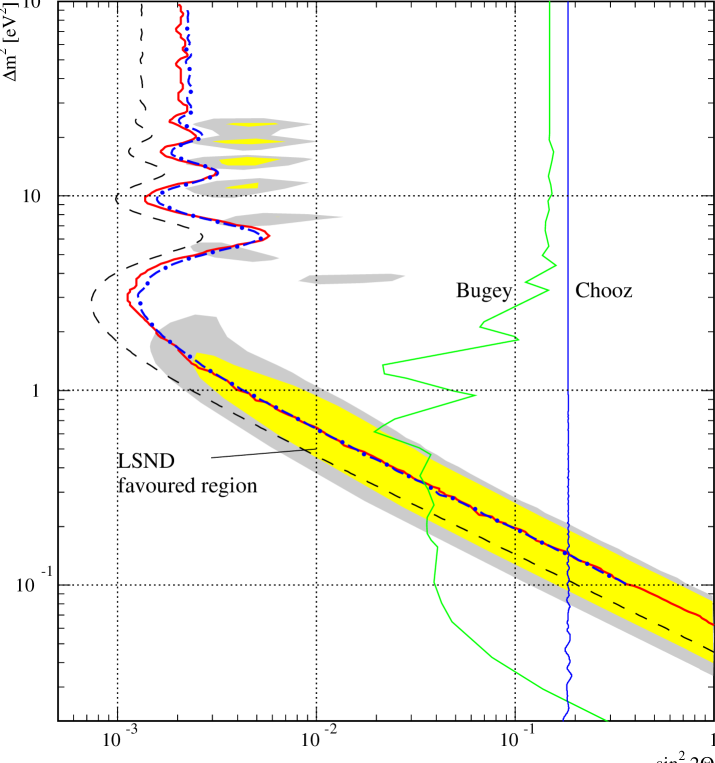
For this data set the above described analysis leads to a 90 % C.L. of sin= for large m2 (i.e. 100 eV2). The 90 % C.L. as a function of m2 can be seen in Fig.4. Also shown is the sensitivity of the KARMEN experiment. The sensitivity of an experiment is defined as the mean confidence limit a large number of identical experiments would yield if there was no oscillation. The actual limit is slightly “better” then the sensitivity with sin= for large m2. Navely one would expect that the sensitivity is at slightly lower sin than the exclusion curve and not vice versa because we measure more events (0.2) than the expected background. This apparent contradiction is explained by the fact that there are no events above 36 MeV where – depending on m2 – roughly half of all oscillation sequences should be and only background events are expected (see Tab.1). This leads also to an LF that has its global maximum in the region of small negative sin which - for a null result - is as possible as a global maximum in the region of positive sin. The 90 % C.L. from our ML analysis is compared in Fig. 4 to the LSND result [11]. It excludes most of the LSND favoured region and is thus – as is the fact that there is no event above 36 MeV – strongly questioning the interpretation that the LSND beam excess is an indication for oscillations. Furthermore one has to keep in mind that the KARMEN limit that was derived from the Feb.97 - Apr.98 data set and that is also shown in Fig. 4 puts an even stronger constraint on the LSND favoured region. In this data set (which had slightly different cuts) we expected background sequences and measured no event at all. This yields, using again the unified approach, a 90 % C.L. of for large m2 and a sensitivity of , respectively [12], [13]. Although this limit was criticized by some people, it is of course valid and correct: If one accepts the ansatz of the Unified Approach one must NOT argue that this (“lucky”) limit is not trustworthy for this would mean to reduce the Unified Approach to absurdity.
References
References
-
[1]
KARMEN collaboration:
B. Armbruster, G. Drexlin, K. Eitel, H. Gemmeke, T.E. Jannakos, M. Kleifges, J. Kleinfeller, C. Oehler, P. Plischke, J. Rapp, M. Steidl, J. Wolf, B. Zeitnitz: Forschungszentrum Karlsruhe, Institut für Kernphysik, Postfach 3640,D-76021 Karlsruhe, Germany;
B.A. Bodmann, E. Finckh, S. Haug, J. Hößl, P. Jünger, W. Kretschmer, I. Stucken: Physikalisches Institut, Universität Erlangen-Nürnberg, Erwin Rommel Straße 1, D-91058 Erlangen, Germany;
C. Eichner, R. Maschuw, C. Ruf: Institut für Strahlen- und Kernphysik, Universität Bonn, Nußallee 14-16, D-53115 Bonn, Germany;
I.M. Blair, J.A. Edgington: Physics Department, Queen Mary and Westfield College, Mile End Road, London E1 4NS, United Kingdom;
N.E. Booth: Department of Physics, University of Oxford, Keble Road, Oxford OX1 3RH, United Kingdom - [2] B. Zeitnitz et al., Prog. Part. Nucl. Physics 40, 169 (1998).
- [3] B. Armbruster et al., Phys. Rev. C 57, 3414 (1998).
- [4] R. Maschuw et al., Prog. Part. Nucl. Physics 40, 183 (1998).
- [5] B. Armbruster et al., Phys. Rev. Lett. 81, 520 (1998).
- [6] G.J. Feldman and R.D. Cousins, Phys. Rev. D 57, 3873 (1998).
- [7] R.L. Burman et al., Nucl. Instr. Meth. A 368, 416 (1996).
- [8] G. Drexlin et al., Prog. Part. Nucl. Physics 40, 193 (1998).
- [9] R.M. Barnett et al. (Particle Data Group), Phys. Rev. D 54 1 (1996).
- [10] M. Steidl, Thesis in preparation, Universität Karlsruhe 1999.
- [11] C. Athanassopoulos et al., Phys. Rev. C 54, 2685 (1996).
-
[12]
B. Zeitnitz et al., to be publ. in Nucle.
Phys. B Proceedings.
hep-ex/98 09 007. - [13] T.E. Jannakos, Thesis, Universität Karlsruhe 1998.
- [14] M. Appolonio et al., Phys. Lett. B 420, 397 (1998).
- [15] B. Achkar et al., Nucl. Phys. B 434, 503 (1995).