Rare Decays of the
Abstract
We have searched for the rare decays , , , and in hadronic events at the CLEO II detector. The search is conducted on 4.80 fb-1 of collisions at 10.6 GeV center-of-mass energy at the Cornell Electron Storage Ring (CESR). We find no signals in any of these modes, and set confidence level upper limits on their branching fractions: , , , and . We also investigated the Dalitz plot of the common decay mode . We fit the matrix element with the Particle Data Group parameterization MA, where is a linear function of the kinetic energy of the , and find Re.
R. A. Briere,1 B. H. Behrens,2 W. T. Ford,2 A. Gritsan,2 H. Krieg,2 J. Roy,2 J. G. Smith,2 J. P. Alexander,3 R. Baker,3 C. Bebek,3 B. E. Berger,3 K. Berkelman,3 F. Blanc,3 V. Boisvert,3 D. G. Cassel,3 M. Dickson,3 S. von Dombrowski,3 P. S. Drell,3 K. M. Ecklund,3 R. Ehrlich,3 A. D. Foland,3 P. Gaidarev,3 R. S. Galik,3 L. Gibbons,3 B. Gittelman,3 S. W. Gray,3 D. L. Hartill,3 B. K. Heltsley,3 P. I. Hopman,3 C. D. Jones,3 D. L. Kreinick,3 T. Lee,3 Y. Liu,3 T. O. Meyer,3 N. B. Mistry,3 C. R. Ng,3 E. Nordberg,3 J. R. Patterson,3 D. Peterson,3 D. Riley,3 J. G. Thayer,3 P. G. Thies,3 B. Valant-Spaight,3 A. Warburton,3 P. Avery,4 M. Lohner,4 C. Prescott,4 A. I. Rubiera,4 J. Yelton,4 J. Zheng,4 G. Brandenburg,5 A. Ershov,5 Y. S. Gao,5 D. Y.-J. Kim,5 R. Wilson,5 T. E. Browder,6 Y. Li,6 J. L. Rodriguez,6 H. Yamamoto,6 T. Bergfeld,7 B. I. Eisenstein,7 J. Ernst,7 G. E. Gladding,7 G. D. Gollin,7 R. M. Hans,7 E. Johnson,7 I. Karliner,7 M. A. Marsh,7 M. Palmer,7 C. Plager,7 C. Sedlack,7 M. Selen,7 J. J. Thaler,7 J. Williams,7 K. W. Edwards,8 R. Janicek,9 P. M. Patel,9 A. J. Sadoff,10 R. Ammar,11 P. Baringer,11 A. Bean,11 D. Besson,11 D. Coppage,11 R. Davis,11 S. Kotov,11 I. Kravchenko,11 N. Kwak,11 X. Zhao,11 S. Anderson,12 V. V. Frolov,12 Y. Kubota,12 S. J. Lee,12 R. Mahapatra,12 J. J. O’Neill,12 R. Poling,12 T. Riehle,12 A. Smith,12 S. Ahmed,13 M. S. Alam,13 S. B. Athar,13 L. Jian,13 L. Ling,13 A. H. Mahmood,13 M. Saleem,13 S. Timm,13 F. Wappler,13 A. Anastassov,14 J. E. Duboscq,14 K. K. Gan,14 C. Gwon,14 T. Hart,14 K. Honscheid,14 H. Kagan,14 R. Kass,14 J. Lorenc,14 H. Schwarthoff,14 M. B. Spencer,14 E. von Toerne,14 M. M. Zoeller,14 S. J. Richichi,15 H. Severini,15 P. Skubic,15 A. Undrus,15 M. Bishai,16 S. Chen,16 J. Fast,16 J. W. Hinson,16 J. Lee,16 N. Menon,16 D. H. Miller,16 E. I. Shibata,16 I. P. J. Shipsey,16 Y. Kwon,17,***Permanent address: Yonsei University, Seoul 120-749, Korea. A.L. Lyon,17 E. H. Thorndike,17 C. P. Jessop,18 K. Lingel,18 H. Marsiske,18 M. L. Perl,18 V. Savinov,18 D. Ugolini,18 X. Zhou,18 T. E. Coan,19 V. Fadeyev,19 I. Korolkov,19 Y. Maravin,19 I. Narsky,19 R. Stroynowski,19 J. Ye,19 T. Wlodek,19 M. Artuso,20 R. Ayad,20 E. Dambasuren,20 S. Kopp,20 G. Majumder,20 G. C. Moneti,20 R. Mountain,20 S. Schuh,20 T. Skwarnicki,20 S. Stone,20 A. Titov,20 G. Viehhauser,20 J.C. Wang,20 A. Wolf,20 J. Wu,20 S. E. Csorna,21 K. W. McLean,21 S. Marka,21 Z. Xu,21 R. Godang,22 K. Kinoshita,22,†††Permanent address: University of Cincinnati, Cincinnati OH 45221 I. C. Lai,22 P. Pomianowski,22 S. Schrenk,22 G. Bonvicini,23 D. Cinabro,23 R. Greene,23 L. P. Perera,23 G. J. Zhou,23 S. Chan,24 G. Eigen,24 E. Lipeles,24 M. Schmidtler,24 A. Shapiro,24 W. M. Sun,24 J. Urheim,24 A. J. Weinstein,24 F. Würthwein,24 D. E. Jaffe,25 G. Masek,25 H. P. Paar,25 E. M. Potter,25 S. Prell,25 V. Sharma,25 D. M. Asner,26 A. Eppich,26 J. Gronberg,26 T. S. Hill,26 D. J. Lange,26 R. J. Morrison,26 T. K. Nelson,26 J. D. Richman,26 and D. Roberts26
1Carnegie Mellon University, Pittsburgh, Pennsylvania 15213
2University of Colorado, Boulder, Colorado 80309-0390
3Cornell University, Ithaca, New York 14853
4University of Florida, Gainesville, Florida 32611
5Harvard University, Cambridge, Massachusetts 02138
6University of Hawaii at Manoa, Honolulu, Hawaii 96822
7University of Illinois, Urbana-Champaign, Illinois 61801
8Carleton University, Ottawa, Ontario, Canada K1S 5B6
and the Institute of Particle Physics, Canada
9McGill University, Montréal, Québec, Canada H3A 2T8
and the Institute of Particle Physics, Canada
10Ithaca College, Ithaca, New York 14850
11University of Kansas, Lawrence, Kansas 66045
12University of Minnesota, Minneapolis, Minnesota 55455
13State University of New York at Albany, Albany, New York 12222
14Ohio State University, Columbus, Ohio 43210
15University of Oklahoma, Norman, Oklahoma 73019
16Purdue University, West Lafayette, Indiana 47907
17University of Rochester, Rochester, New York 14627
18Stanford Linear Accelerator Center, Stanford University, Stanford, California 94309
19Southern Methodist University, Dallas, Texas 75275
20Syracuse University, Syracuse, New York 13244
21Vanderbilt University, Nashville, Tennessee 37235
22Virginia Polytechnic Institute and State University, Blacksburg, Virginia 24061
23Wayne State University, Detroit, Michigan 48202
24California Institute of Technology, Pasadena, California 91125
25University of California, San Diego, La Jolla, California 92093
26University of California, Santa Barbara, California 93106
The and mesons share the same quantum numbers, and can both be used to investigate C and CP violation, leptoquarks, lepton family violation, chiral perturbation theory, and other topics [1]. But while the has been the subject of several experiments, our experimental knowledge of the is limited; many measured upper limits for its decays are at the percent level [2]. In this Letter we present searches for the rare decays , , , and produced in collisions at 10.6 GeV center-of-mass energy. We have concentrated on decays involving at least one electron because combinatoric backgrounds in hadronic events are much larger for photons and charged pions than for leptons.
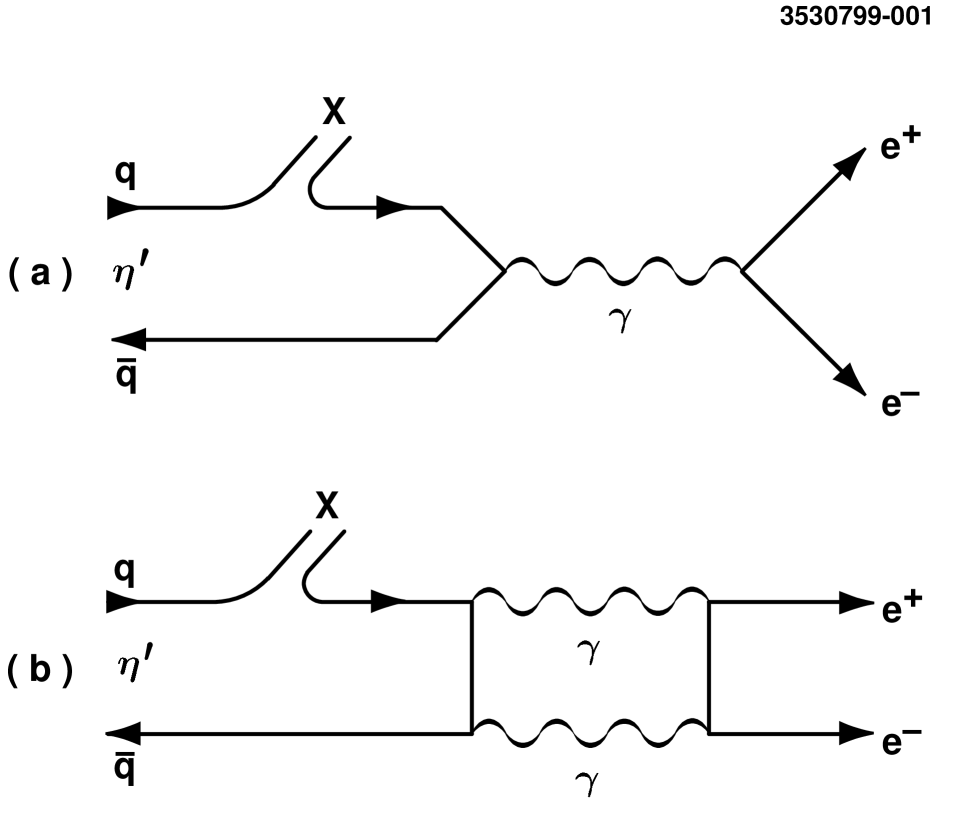
The decays and can occur with one or two intermediate virtual photons, as shown in Figure 1. The , , and are even eigenstates of C, while a photon is C-odd; thus the one-photon process will be C-violating and the two-photon process C-conserving. Because , and the rates for these decays should be orders of magnitude smaller [3], any signal at the 10-4 level or larger would signify a large C-violating contribution or other new physics. The current 90 confidence upper limits for these decays [2] are 1.1 for and 1.3 for .
The Dalitz decays of the and have both been measured, with branching fractions two orders of magnitude smaller than the decays of the two mesons. Because [2], we may expect the Dalitz decay at the 10-4 level. The decay with no accompanying neutrinos is an example of lepton number violation. The theoretical upper bound for this decay is on the order of 10-11, determined from experiments on conversion in heavy nuclei [4]. A host of intermediate particles, including massive neutrinos or leptoquarks [5], could manifest themselves through a larger branching fraction for this decay. No measured upper limit has been published for either or .
The common decay was used both as a normalization for our rare decay searches and to investigate the structure of the . Defining the Dalitz variables
| (1) |
in which represents kinetic energy in the rest frame and , we fit the matrix element with the Particle Data Group [2] parameterization, M. Of particular interest is the real component of the complex constant , which is a linear function of the kinetic energy of the . A non-zero value of may represent the contribution of a gluon component to the decay [6]. There are two published measurements of Re; for [7] and for [6]. Though these measurements are consistent, need not be the same for the two decays.
Data were collected using the CLEO II detector [8] at the Cornell Electron Storage Ring (CESR). We used 3.11 fb-1 at the resonance, 10.58 GeV, and 1.69 fb-1 at 10.52 GeV. Approximately of our sample comes from decays. Charged particle momenta are measured in a 67-layer tracking system immersed in a 1.5 T solenoidal magnetic field. The main drift chamber also determines a track’s specific ionization (), which aids in particle identification. A 7800-crystal CsI calorimeter detects photons and is the primary tool for electron identification. Muons are identified using proportional counters placed at various depths in the steel return yoke of the magnet.
Selection criteria for () were as follows. We restricted our search to hadronic events by requiring at least five charged tracks in the drift chamber. Photons from candidate decays were required to be in the region of best energy resolution in the calorimeter (80 of the solid angle), to have an energy of at least 200 MeV, and not to overlap any noisy crystals or the projections of charged tracks. We rejected both photons of pairs with an invariant mass within 12.5 MeV/ of the mass. Candidate pions must be well-tracked and must originate in the interaction region, within 3mm radially in the plane perpendicular to the beam and within 2cm in the beam direction. Because we intend to use these decays as normalization of our search for decays containing electrons, some requirements are designed to reduce systematic uncertainties in electron identification. We veto tracks which have a vertex with another track in the beam pipe or tracking chamber walls, because we will need to veto gamma conversions when seeking decays involving electrons. Similarly, tracks projecting to the calorimeter endcap are rejected, because electron identification degrades in this region.
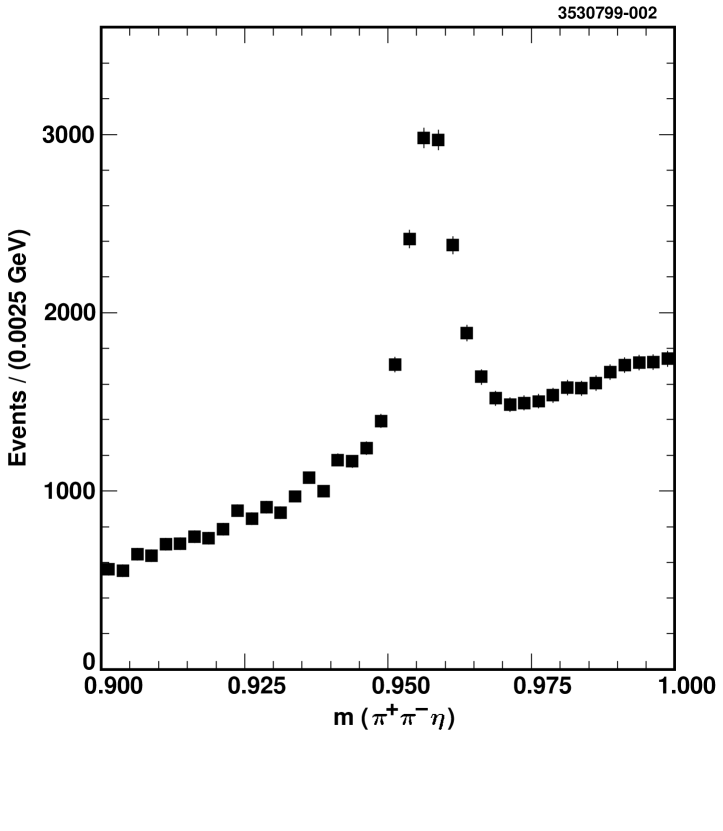
We kinematically fit each photon pair with invariant mass within 40 MeV/ of the mass. By requiring the and to have minimum momenta of 0.6 and 1.0 GeV/, respectively, we limit random combinations of real ’s and charged pions, which are our largest background. The final signal of roughly 6700 events is shown in Figure 2. From a Monte Carlo sample of events we calculate an efficiency of , indicating that about mesons were produced in our sample.
The searches for () and () use the same criteria as the normalizing mode, except that we now require the charged tracks to be positively identified as electrons. Our electron identification algorithm utilizes shower energy, track momentum, specific ionization loss, and shower shape to achieve an efficiency of roughly with a fake rate from charged pions of less than 0.5. Signal efficiency is estimated from Monte Carlo samples for each decay, fitting each with a Gaussian and defining the signal region to be to either side of the mean. Average background is determined by interpolating the data between 0.85 and 1.05 GeV/ in invariant mass, excluding the signal region.
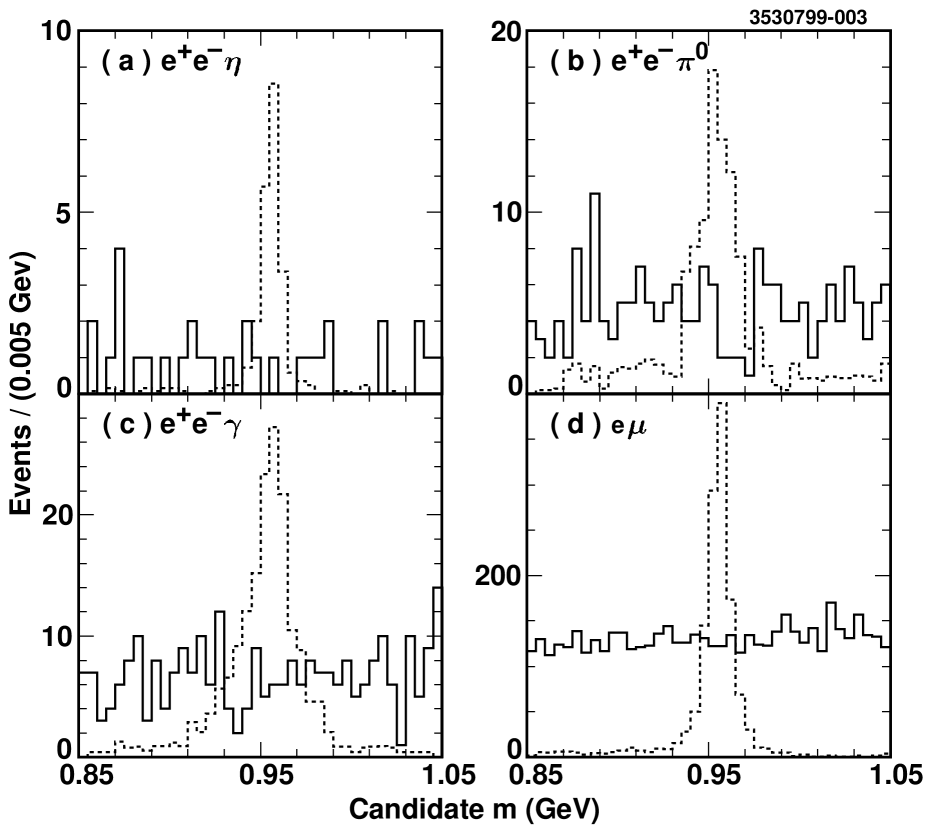
The data (solid) and Monte Carlo (dashed) results for and are shown in Figures 3a and 3b, respectively. Neither shows any statistically significant signal in data. The efficiency for the mode is estimated from Monte Carlo to be . There is one event in the signal region with an expected background of 3.0 events; Poisson statistics gives us a confidence upper limit of 2.8 events. The efficiency for the mode is . There are 23 signal-region events and an average background of 31.0 events for an upper limit of 6.2 events at confidence level. The background for this mode is larger due to the greater number of neutral pions available for random combinations.
The Monte Carlo samples used above distribute the decay products evenly over phase space. One might argue that this is not appropriate for the one-photon C-violating diagrams for these decays, and that we may be unknowingly cutting away a signal of new physics. To check this, we generated a second Monte Carlo sample for each decay, using the measured electron-pair mass distribution from the Dalitz decay of the [9]. These Monte Carlo samples give us estimated efficiencies of for and for . For each mode we will use the mean of the two Monte Carlo estimates as the efficiency and introduce half the difference as a systematic uncertainty.
For the search we require a minimum photon energy of 0.6 GeV to reduce combinatoric background. We also see a significant background from random photons combined with an electron pair from the Dalitz decays of a or . We reduce this background by vetoing any event with an combination with invariant mass within (21 MeV/) of the mass or within (26 MeV/) of the mass. The data (solid) and Monte Carlo results are shown in Figure 3c; the Monte Carlo sample again uses the electron-pair mass distribution from the Dalitz decay. The efficiency for this mode is estimated to be . There is again no significant signal, with 51 signal-region events and a background of 53.6 events, for a confidence upper limit of 11.7 events.
The criteria for muon identification in are identical to those for pions, with the additional requirement that the muon penetrate three interaction lengths of material outside the calorimeter (roughly a 1.0 GeV/ momentum requirement). The results of this search are shown in Figure 3d. The efficiency is found to be . There are 650 events with an average background of 672 events, for an upper limit of 30.1 events at confidence.
Table I shows all sources of systematic uncertainty in our analyses which do not cancel in the normalization to the mode. We used Poisson statistics to generate a confidence level distribution for the number of signal events in each mode. We then ran a simulation which assigned an error to each probability in the distribution, with the errors corresponding to a Gaussian with a width determined by the total uncertainty for that mode. This ’smearing’ of the distribution increased the number of signal events at the confidence level to the amount shown in Table II for each mode. Normalizing the signal limit and efficiency for each mode to that of allows us to calculate confidence upper limits on the rare decay branching fractions:
| (2) |
| (3) |
| (4) |
| (5) |
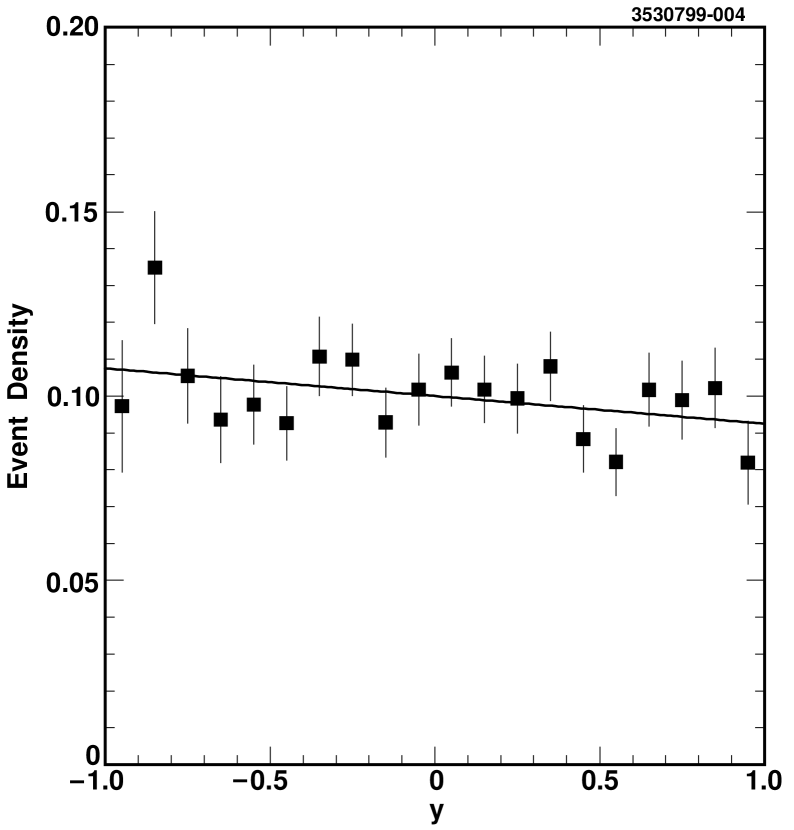
In measuring Re we use the selection criteria for () with the gamma conversion and calorimeter endcap requirements removed for greater efficiency. We fit the signal in data with a Gaussian and define the signal region as to either side of the mean. Background is removed by sideband subtraction; we use three different definitions of sideband (, , and from the mean). Our sensitivity to the coefficient of is small, so we plot the projection along the -axis for each choice of sideband. Because the requirement on the momentum may be biasing the distribution of , we also measure Re with minimum momenta of 0.4 GeV/ and 0.8 GeV/. Efficiency corrections are made by dividing our results by those from a Monte Carlo sample of decays. We fit the results with a line whose slope will be twice the real component of . One such plot is shown in Figure 4. The slope varies by with choice of sideband, with choice of momentum requirement, from the statistics of the Monte Carlo sample, and due to the statistical uncertainty of the fit. Adding these uncertainties in quadrature yields a result of Re . While consistent with previous measurements, this result is much smaller and is also consistent with zero.
In summary, we have searched for rare decays of the involving at least one electron in collisions at the CLEO II detector. We find no statistically significant signals, and have assigned confidence upper limits of , , , and . These measurements represent an order of magnitude improvement over previous limits, but are at least another order of magnitude short of discerning the Dalitz decay or suggesting a difficulty for the Standard Model. We have also examined the structure of the and measured Re, a value consistent with but much smaller than previous measurements.
We gratefully acknowledge the effort of the CESR staff in providing us with excellent luminosity and running conditions. This work was supported by the National Science Foundation, the U.S. Department of Energy, the Research Corporation, the Natural Sciences and Engineering Research Council of Canada, the A.P. Sloan Foundation, the Swiss National Science Foundation, and the Alexander von Humboldt Stiftung.
REFERENCES
- [1] B.M.K. Nefkens, Few Body Syst. Suppl. 9, 193-202 (1995).
- [2] Particle Data Group, C. Caso et al., Eur. Phys. J. C 3, 1 (1998).
- [3] T.P. Cheng, Phys. Rev. 162, 1734 (1967).
- [4] P. Herczeg, in Rare Decays of Light Mesons, edited by B. Mayer (Editions Frontieres, Gif-sur-Yvette, 1990).
- [5] D.B. White, Phys. Rev. D 53, 6658 (1996).
- [6] D. Alde et al., Phys. Lett. B 177, 115 (1986).
- [7] G.R. Kalbfleisch, Phys. Rev. D 10, 916 (1974).
- [8] Y. Kubota et al., Nucl. Instrum. Methods Phys. Res., Sect. A 320, 66 (1992).
- [9] M.R. Jane et al., Phys. Lett. B 59, 103 (1975).
| Source | ||||
|---|---|---|---|---|
| Photon detection efficiency | — | — | 3.0 | 6.0 |
| Electron ID efficiency | 6.0 | 6.0 | 6.0 | 3.0 |
| Muon ID efficiency | — | — | — | 0.5 |
| 0.7 | 0.7 | 0.7 | 0.7 | |
| — | 3.4 | 3.4 | 3.4 | |
| (fit to data) | 3.6 | 3.6 | 3.6 | 3.6 |
| (MC stat) | 2.5 | 2.5 | 2.5 | 2.5 |
| (rare decay) (MC stat) | 8.3 | 5.9 | 5.5 | 3.1 |
| Choice of MC model | 12.5 | 8.8 | — | — |
| contribution | 1.6 | 1.1 | 0.6 | 0.7 |
| Total | 16.8 | 13.4 | 10.3 | 9.3 |
| Rare | Limit without | Limit with |
|---|---|---|
| decay | systematics (events) | systematics (events) |
| 2.8 | 3.0 | |
| 6.2 | 6.4 | |
| 11.7 | 11.9 | |
| 30.1 | 30.4 |