A new measurement of the properties of the rare decay
Abstract
A large low-background sample of events (10300) has been collected for the rare decay of kaons in flight by experiment E865 at the Brookhaven AGS. The decay products were accepted by a broad band high-resolution charged particle spectrometer with particle identification. The branching ratio was determined normalizing to events from the decay chain . From the analysis of the decay distributions the vector nature of this decay is firmly established now, and limits on scalar and tensor contributions are deduced. From the invariant mass distribution the decay form factor () is determined with . Chiral QCD perturbation theory predictions for the form factor are also tested, and terms beyond leading order are found to be important.
pacs:
13.20.-v,13.20EbThe decay () proceeds via a flavor changing neutral current and is highly suppressed by the GIM-mechanism. The decay rate was first calculated [9] assuming a short-distance transition at the quark level. Later it was realized that the long-distance effects dominate the decay mechanism [10]. Several recent calculations, which study the rate and invariant electron-positron mass () distributions, were performed within the framework of chiral QCD perturbation theory (ChPT) [11, 12, 13], an approach which has been quite successful at modeling many decay modes of the light mesons [14].
The first few events for this decay were observed at CERN [15]. Two subsequent experiments at the Brookhaven AGS, E777 [16] and E851 [17], observed 500 and 800 events, and measured branching ratios of and (), respectively. We report here the results of a new measurement with larger acceptance and significantly increased statistics. Our data allow a detailed study of the decay form factor and a comparison with ChPT calculations and other models.
The experiment was performed at the Brookhaven National Laboratory’s AGS. The apparatus, a schematic drawing of which is shown in Fig. 1, was constructed to search for the decay K [18, 19, 20, 21]. It resided in a 6 GeV/c unseparated beam containing about K+ and and protons per 1.6 second AGS pulse.

Downstream of a 5m-long evacuated decay volume a dipole magnet separated the trajectories by charge, with negative particles going mainly to the left. This was followed by a spectrometer consisting of four proportional chambers surrounding a dipole magnet with a 0.833 Tm field integral, which determined the momenta and trajectories of the decay products. Particle identification was accomplished with Čerenkov counters filled with H2 on the left (C1L and C2L), and CH4 on the right (C1R and C2R) at atmospheric pressure; with an electromagnetic calorimeter of the Shashlik design[22], consisting of of 600 modules, each 11.4 cm by 11.4 cm by 15 radiation lengths in depth, arrayed 30 horizontally and 20 vertically; and with a muon range stack consisting of 24 planes of proportional tubes situated between iron plates. With these components, electrons were identified as having light in the appropriate Čerenkov counters and energy in the calorimeter consistent with the measured momentum of the trajectory. Pions were identified as having no light in the Čerenkov counters, and an energy loss in the calorimeter consistent with that of a minimum ionizing particle or a hadron shower. Compared to the most recent experiment [16, 17] the E865 spectrometer had improved particle identification capabilities, spectrometer resolution and larger, more uniform acceptance.
The first-level trigger for the experiment is based on three charged particle hits using hodoscopes D and A (arrays of 10 and 15 slats each on either side of the beam line, respectively), and the calorimeter. Most of the rate at this stage comes from accidentals, and () decays. For decays the next level trigger required Čerenkov counter signals on each side of the detector. This trigger was dominated by events from the decay chain () with low invariant mass . To enhance the fraction a high mass trigger was configured, in which events with small vertical separation of calorimeter hits were prescaled. This reduced the number of triggers, while keeping 85 % of the high events. Figure 2 shows the invariant mass spectra for the prescaled monitor events and those, which were accepted by this trigger and were used for normalisation.

In the analysis, the basis for the selection of both normalisation and signal events was the unambiguous identification of a positive pion and lepton pair with trajectories from a common vertex located within the decay volume. With a cut GeV we have a nearly pure sample of events with a three particle invariant mass , as shown in Fig. 3. The onset of the events can be seen for GeV and , the latter because of a missing photon. For events, the reconstructed was required to come from the production target within the limits inferred from studying decays. Our final signal sample contains 10300 candidates including 1.2 % background events. Our normalisation sample, after prescaling, contains 105 candidates including a 17 % contribution from two other decays giving -Dalitz pairs ( with the treated as a , and ). The insert in Fig. 3 exhibits a mass resolution of MeV, in good agreement with the Monte Carlo simulation. The calculated resolution is MeV nearly independent of .
The acceptance for and events was determined to be 0.73 % and 0.85 %, respectively, with a Monte Carlo simulation, which included the geometry of beam line and spectrometer, and the separately measured efficiencies and responses of scintillators, proportional chambers, Čerenkov and shower counters. The influence of the efficiencies on the acceptance nearly cancels in the normalisation, since and events contain the same final states, and their different spatial distributions produce only minor differences, and are taken into account. Figures 2 and 3 are examples of the many control plots which attest the excellent quality of the simulation. For events the matrix elements of [24] were used for , and the theoretical input to the simulation is discussed below. Figure 2 also demonstrates that the major difference between and events, the high-mass trigger, is correctly accounted for, in magnitude as well as in shape.

The essential distributions necessary for the interpretation of our data are shown in Fig. 4. Since the decay is supposed to proceed through one photon exchange, i.e. by a vector interaction (V) with a decay amplitude[13]
one expects an angular distribution proportional to , where is the angle between the positron and pion momentum vectors in the center of mass of the pair. The presence of other decay mechanisms, however, may produce small admixtures of scalar (S) or tensor (T) terms [25]. The corresponding decay amplitudes
lead to either a constant (S) angular distribution or one proportional to (T). Here is the Fermi constant, , , and the form factors are dimensionless functions of . Fitting a two-dimensional distribution whose projections are shown in Fig. 4, we find good agreement with a vector interaction. At 90 % confidence level at most 2 % of the branching ratio could result from either scalar or tensor interaction corresponding to constraints and .
Neglecting terms proportional to the mass distribution for a vector interaction can be described by
| (1) |
where . The form factor can be determined by fitting the observed spectrum in the experimentally accessible range . We have used two different parametrisations of the form factor, one model independent (Eq. 2) and the other derived from ChPT [13] (Eq. 3):
| (2) | |||||
| (3) |
are free parameters [26], and is the contribution from a pion loop graph given in [13].
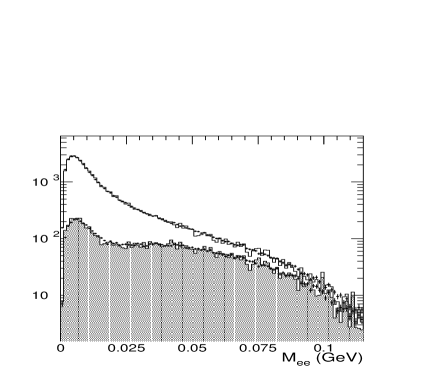
Figure 5 displays the form factor, which is extracted from the ratio of mass distributions for the measured events to events simulated with a constant form factor. The results of our fit to the linear and ChPT ansatz are superimposed. Figure 4 shows the spectrum itself. The parameters and branching ratios are given in Table II. The different contributions to the systematic uncertainty of our results are listed in in Table II. Radiative corrections have been included in the simulation following [23]. This increased the branching ratio by 5.5 % and the linear slope by 4 %.
| Source | (%) | (%) |
|---|---|---|
| Normalisation to | 2.8 | |
| Radiative corrections | 1.4 | 0.5 |
| Reconstruction | 3.0 | 6.5 |
| Background subtraction | 1.5 | 2.3 |
| Total | 4.5 | 6.9 |
The inclusion of the quadratic term in the model independent ansatz improves the quality of the fit. The values of and are however strongly correlated. Our result is in fair agreement with the less precise results of experiment E777 [16, 26] . The large value of is in contradiction with the meson dominance class of models [27, 28], in which the form factor slope is given in first approximation as .
The ChPT parametrisation of Eq. 3 includes the contribution from the pion loop graph. This term has a strong dependence, which has not been calculated explicitly in most earlier models. In fact, in the first, lowest non-trivial order ChPT calculation ([11]) this term was assumed to be the only significant source of dependence of the form factor (i.e. ). Our data show that this is a poor approximation. Significant dependence from other terms is expected in next-to-leading-order ChPT [12, 13]. The amplitude linear in (Eq. 3) is thought to represent all contributions other than the pion loop term, which ChPT cannot calculate [13]. The substantial reduction in the value of which is observed when the pion loop term is included provides direct experimental evidence for its small but important contribution.

Summarizing the results of our analysis we conclude: (i) the experimental data are consistent with a vector model for the interaction, (ii) the slope of the form factor is significantly larger than meson dominance or leading order ChPT models predict, and (iii) although a linear approximation of the form factor is reasonable, our data indicate a nonlinearity of the form factor which is fit well by the ChPT loop term. Our final result for the total branching ratio is . Here we include the model dependence of the extrapolation into the low mass region not covered by our detector by taking the average of the extreme values in Table II.
We gratefully acknowledge the contributions to the success of this experiment by Dave Phillips, the staff and management of the AGS at the Brookhaven National Laboratory, and the technical staffs of the participating institutions. This work was supported in part by the U. S. Department of Energy, the National Science Foundations of the USA, Russia and Switzerland, and the Research Corporation.
REFERENCES
- [1] Now at: Rutgers University, Piscataway, NJ 08855
- [2] Now at: University of Louisville, Louisville, KY 40292
- [3] Now at: University of Texas, Austin, TX 78712
- [4] Now at: Albert-Ludwigs-Universität, D-79104 Freiburg, Germany
- [5] Now at: GE Medical Systems, Milwaukee, WI 53201
- [6] Now at: University of Connecticut, Storrs, CT 06269
- [7] Now at: LIGO/Caltech, Pasadena, CA 91125
- [8] Now at: Universitätspital, CH-8091 Zürich, Switzerland
- [9] M.K. Gaillard, and B.W. Lee, Phys. Rev. D10, 897 (1974).
- [10] See [16] for list of older references.
- [11] G. Ecker, A. Pich, and E. de Rafael, Nucl. Phys. B291, 692 (1987).
- [12] J. Donoghue, and F. Gabbiani, Phys. Rev. D51, 2187 (1995).
- [13] G. D’Ambrosio et al, JHEP 8, 4 (1998).
- [14] See e. g. G. D’Ambrosio et al, in The second DAPHNE physics handbook, L. Maiani et al.(ed.), Frascati, Italy: INFN (1995), p. 265 - 313; J. Bijnens, G. Ecker, and J. Gasser, ibid. p. 125 - 144.
- [15] P. Bloch et al., Phys. Lett. 56B, 201 (1975).
- [16] C. Alliegro et al, Phys. Rev. Lett. 68, 278 (1992).
- [17] A. L. Deshpande, PhD thesis, Yale University (1995).
- [18] R. Appel et al., to be submitted to Nucl. Instr. Meth.
- [19] S. Pislak, PhD thesis, University of Zürich (1997).
- [20] D.R. Bergman,
- [21] S. Eilerts, PhD thesis, University of New Mexico (1998).
- [22] G.S. Atoyan et al., Nucl. Instr. Meth. A320, 144 (1992).
- [23] B.E. Lautrup, and J. Smith, Phys. Rev. D3, 1122 (1971).
- [24] K.O. Mikaelian, and J. Smith, Phys. Rev. D5, 1763 (1973).
- [25] S.W. MacDowell, Ann. Phys. 18, 171 (1962); D.S. Beder, and G.V. Dass, Phys. Lett. B59, 444 (1975).
- [26] The parameter used here relates to the parameter used in [16] as .
- [27] P. Lichard, Phys. Rev. D55, 5385 (1997); ibid. D60 (1999); hep-ph/9904265 (Pittsburgh University).
- [28] L. Bergström, and P. Singer, Phys. Rev. D 43, 1568 (1991); Phys. Rev. Lett. 55, 2633 (1985).