Medium energy calorimetry at SND: techniques and performances on physics
Abstract
SND (Spherical Neutral Detector) is a general purpose nonmagnetic detector, successfully operating at Novosibirsk VEPP-2M collider during last four years in the center of mass energy range from 400 MeV up to 1400 MeV. Its crucial part is a 3-layer, fine grained, spherical NaI(Tl) electromagnetic calorimeter consisted of 1632 individual counters. Here we present a detailed description of the calorimeter and its performance, including such topics as calorimeter design, electronics, calibration, energy and spatial resolutions, particle identification. The calorimeter performance is illustrated by examples from the current studies of different physical processes.
1 Introduction
Nowadays the Standard Model is triumphant – the net result of high-energy physics experiments in the last two decades. The fact that for these stringent Standard Model checking experiments high energies are crucial is a natural consequence of the W- and Z-boson high masses on one side, and of the asymptotic freedom of QCD on another. It is also true that the most part of the elementary particle physics community relates today further progress in the field to future experiments at even higher energies and is involved into the corresponding activities. Nevertheless many interesting and important things can be learned from experiments at low and medium energies, where QCD, one of the pillars of the Standard Model, becomes practically intractable because instead of the asymptotic freedom we have infrared slavery in this energy range and consequently a breakdown of the perturbation theory.
For more than 25 years the VEPP-2M collider in Novosibirsk operates in the center-of-mass energy range GeV [1]. Until now its maximum luminosity of at MeV is a record in this energy range. During this period several generations of detectors carried out experiments at VEPP-2M. Much of current data on low energy region particle properties [2] were obtained in these experiments.
The SND detector, which calorimeter will be described here, is an advanced version of its predecessor – the Neutral Detector (ND) [3, 4], which successfully completed its five-year experimental program in 1987 [5]. It also has some common features with the famous Crystal Ball detector [6], but contrary to it has a multilayer structure calorimeter, like Neutral Detector, and consequently more tools for and separation.
The three-layer spherical electromagnetic calorimeter based on NaI(Tl) crystals is the main part of the SND. It is optimized for investigation of radiative decays of mesons, and other rare processes at energy near 1 GeV with photons in the final state. A good energy and angular resolution for photons in the energy range from 30 to 700 MeV is essential for background suppression in the and meson reconstructions and for detection of photons emitted in radiative transitions between quarkonia states.
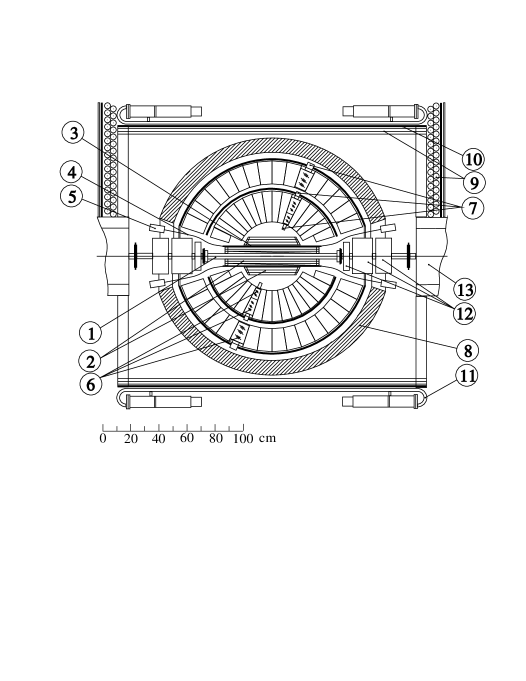
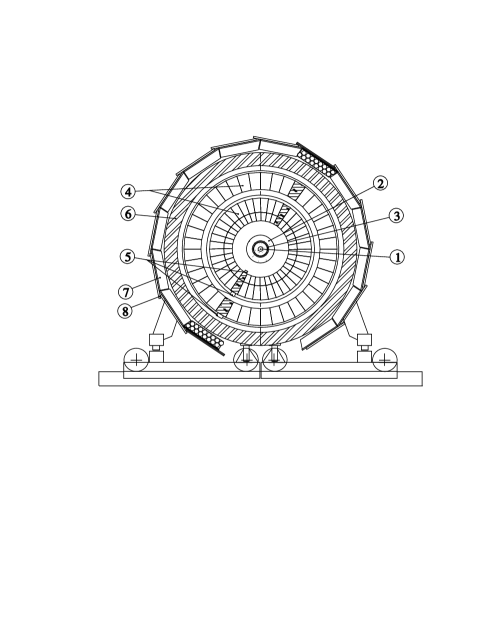
The general layout of the SND detector is shown in Figs. 1, 2. Electron and positron beams collide inside the beryllium beam pipe with a diameter of 4 cm and thickness of 1 mm. The beam pipe is surrounded by tracking system consisting of two drift chambers with a cylindrical scintillation trigger counter between them. The solid angle coverage of the tracking system is about of . The electromagnetic calorimeter surrounds the tracking system. Outside the calorimeter a 12 cm thick iron absorber of the electromagnetic shower residuals is placed. It is surrounded by segmented muon system which provides muon identification and suppression of cosmic background. Each segment consists of two layers of streamer tubes and a plastic scintillation counter separated from the tubes by 1 cm iron plate. The iron layer between the tubes and the counter reduces the probability of their simultaneous firing by photons produced in collisions to less than for 700 MeV photons.
2 Calorimeter layout
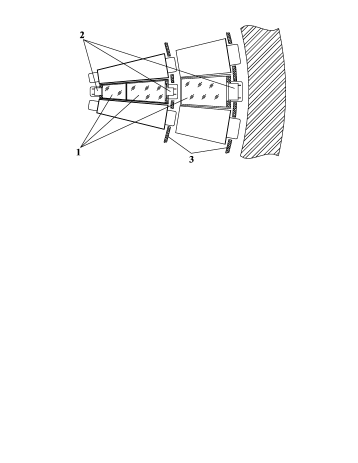
Each layer of the calorimeter includes 520 to 560 crystals of eight different shapes. Most of the crystals have shapes of truncated tetrahedral pyramids. The total solid angle covered by the calorimeter is equal to 0.9 of 4. The remaining space is occupied by magnetic structure elements of the storage ring, mainly by quadrupole lenses. Pairs of counters of the first two layers with the thickness of 2.9 and 4.8 respectively ( cm) are sealed together in common containers made of thin (0.1 mm) aluminum foil and fixed to an aluminum supporting hemisphere (Fig. 3). Behind it, the third layer of NaI(Tl) crystals, 5.7 thick, is placed. In order to improve light collection efficiency and to separate one crystal from another, each crystal is wrapped in an aluminized mylar. The gaps between adjacent crystals of one layer do not exceed 0.5 mm. The total thickness of the calorimeter for particles originating from the center of the detector is 13.4 (34.7 cm) of NaI(Tl). The total number of crystal in the calorimeter equals 1632 with 3.5 t total mass.
During the crystals production their nonuniformity of the light collection efficiency along the crystal was controlled and only the crystals for which the relative r.m.s. value of this nonuniformity was less than 3 % were accepted. As number of crystals was large, special computer controlled measurement device was developed for this goal. A new “quantum mechanical” algorithm for automatic photopeak searches [7] was used in the computer code for this device. The typical behavior of the light collection efficiency along the crystal is shown in Fig. 4 for the first layer crystals and in Fig. 5 for the second layer ones. Crystals from the third layer are similar to the second layer crystals in this respect. The light collection efficiency varies from to for crystals of different calorimeter layers. The averaged efficiency for the first layer is 13%, for the second layer – 17%, and for the third layer – 18%.
As photosensitive devices for the calorimeter counters the vacuum phototriodes are used [8] with a photocathode diameter of 17 mm in the first two layers and 42 mm in the third layer. The quantum efficiency of their photocathodes is about 15 %, average gain is 10. Crystals with lower light collection efficiency are equipped with higher gain phototriodes and vice versa.
Spherical shape of the SND calorimeter provides relative uniformity of its response over the whole solid angle. The range of polar angle coverage by the calorimeter is . The calorimeter is logically divided into two parts: “large” angles and “small” angles — the rest. The angular dimensions of crystals are at large angles and at small angles.
The crystal widths approximately match the transverse size of an electromagnetic shower in NaI(Tl). Two showers can be distinguished if the angle between them is larger than . If this angle exceeds the energies of the showers can be measured with the same accuracy as for an isolated shower. A high granularity of the calorimeter is especially useful for the detection of multi-particle events. For example, the detection efficiency for 7-photon events is usually close to 15% after all cuts needed to separate useful process from background.
For the trigger needs the calorimeter crystals are logically organized into “towers”. A tower consists of counters located within the same interval in polar and azimuthal directions in all three layers. The number of counters in a tower is 12 at large angles and 6 at small ones.
3 Electronics
Electronics of the calorimeter (Fig. 6) consists of
-
•
the charge sensitive preamplifiers (CSA) with a conversion coefficient of 0.7 V/pC;
-
•
12-channel shaping amplifiers (SHA) with a remote controlled gain;
-
•
24-channel 12-bit analog to digital converters (ADC) with a maximum input signal .
In order to equalize contributions from different counters into the total energy deposition signal and to obtain equal energy thresholds for trigger signals over the whole calorimeter, all shaping amplifiers are equipped with computer controlled attenuators, allowing to adjust SHA gain in steps of 1/255.
Each SHA serves one tower and also produces additional signals for the first level trigger, the most important among them is the the total energy deposition — analog sum of all calorimeter channels in the tower. Other three logical signals correspond to energy depositions above 5 MeV in separate calorimeter layers.
CSA and SHA constitute calorimeter front-end electronics (Fig. 7). The equivalent electronics noise of individual calorimeter channel lies within the range of keV.
Each calorimeter channel can be tested using a precision computer-controlled calibration generator. The amplitude of its signal can be set to any value from 0 to 1 V with a resolution of 1/4096.
The SND electronics is organized to provide necessary signals for the first level trigger (FLT). For example, the calorimeter shaping amplifiers are collected into 160 modules corresponding to 160 towers. From the FLT point of view the towers divide calorimeter into 20 sectors of in azimuthal direction and into 8 rings of in polar direction.
The following parameters are used for event identification in the calorimeter FLT:
-
•
total energy deposition in the calorimeter;
-
•
energy depositions in certain parts of the calorimeter;
-
•
number of clusters and their relative and absolute locations;
-
•
existence of a tower with energy depositions above a certain threshold in at least two calorimeter layers.
Signals from 16 towers, forming two calorimeter sectors, are collected by IFLT modules (Fig. 8). For each tower two logical signals are produced: a “soft tower” (TS) with a total energy deposition higher than 25 MeV, and a “hard tower” – the same as a TS but with energy depositions in two of three layers larger than 5 MeV.
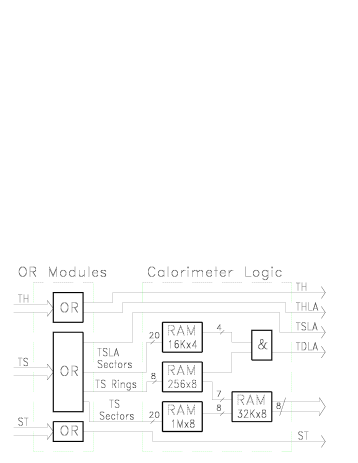
Fig. 9 shows the organization of the Calorimeter Logic module. Two groups of 20 signals each from sectors at different angles, produced by the summation of tower signals in the polar direction, and 8 signals from rings – the sums of towers in the azimuthal direction – form the set of input signals for the Calorimeter Logic module.
The ring signals and the partial sector signals from towers at large angles (TSLA) produce the signal “two towers at large angle” (TDLA). The sector signals (TS) go to the address bus of 1MB static RAM, where the look-up table is stored. The information from rings contained in another 32 kB RAM is added. So, according to the memory contents, the components of the FLT defining the number of towers and their relative positions are produced. FLT components can be easily changed by RAM reprogramming.
4 Calibration
Calorimeter is calibrated using cosmic muons [10] and Bhabha events [11]. A fast preliminary calibration based on cosmic muons gives the constants for the energy deposition calculations in the calorimeter crystals. These constants are used to set computer controlled attenuators at such values for each calorimeter channel that equal responses of all crystals are obtained. This provides uniform first-level trigger energy threshold over the whole calorimeter. They also represent seed values for the more precise calibration procedure, using events. The cosmic calibration procedure is based on the comparison of the experimental and simulated energy depositions in the calorimeter crystals for cosmic muons. The detailed description of the method is given in [10]. The statistical accuracy of in the calibration coefficients was achieved for about 1.5 million events collected in special data taking runs with total duration of 4.5 hours. After cosmic calibration the peak positions in the measured energy spectra for photons and electrons agree at a level of about with the actual particle energies (Fig. 10).
The cosmic calibration procedure was performed weekly, between the experimental runs.For a one-week period between consecutive calibrations the coefficients stability was better than . Changes in the coefficients were also monitored daily, using the calibration generator. They could either drift slowly due to electronics gain changes or show larger leaps when broken electronics modules are replaced.
Crystal-phototriode-preamplifier channel short term stability was also previously studied in series of measurements with a calorimeter segment by using laser-based calibration system with a fiber optics [12]. Light pulses from a nitrogen laser after distribution system was driven to both counter crystals and reference photodiodes which measure the pulse amplitude. Instability shown by this laser calibration was about 0.4% [12].
To achieve highest possible energy resolution, the precise OFF-LINE calibration procedure, based on the Bhabha events analysis, was implemented. The calibration coefficients are obtained by the minimization of the r.m.s. of the total energy deposition spectrum for the electrons with fixed energy. The detailed description of the procedure is given in [11]. To obtain the statistical accuracy of about the sample of at least 150 electrons per crystal is needed. SND acquires such a sample daily when VEPP-2M operates in the center-of-mass energy GeV. The average difference in calibration coefficients obtained using cosmic and calibration procedures is about , while the calibration improves the energy resolution by about . For example, the energy resolution for 500 MeV photons improves from to .
5 Energy and spatial resolutions
The calorimeter energy resolution is determined mainly by the fluctuations of the energy losses in the passive material before and inside the calorimeter and leakage of shower energy through the calorimeter. The most probable value of the energy deposition for photons in the calorimeter is about of their energy (Fig. 11). The estimated energy losses in passive material for 500 MeV photons obtained by simulation are listed in Table 1.
| element | thickness | ||
| passive material in front of the calorimeter | 0.17 | 0.16 | 0.05 |
| passive material between 2nd and 3d layer | 0.17 | 0.84 | 0.96 |
| longitudinal leakage | — | 3.5 | 1.2 |
| transverse leakage | — | 2.8 | 1.1 |
| containers | — | 0.26 | 0.05 |
| NaI(Tl) | 13.4 | 93 | 3.3 |
In order to compensate for the shower energy losses in passive material and improve energy resolution the photon energy is calculated as:
| (1) |
where is energy deposition in the first and second layers of the central tower of the shower, is energy deposition in the first two layers outside the central tower, is energy deposition in the third layer, are energy dependent coefficients. Here the tower means the three counters of the 1, 2 and 3 layers with the same and coordinates and the central tower corresponds to the shower center of gravity.
The coefficients were determined from simulation of photons with energies from 50 to 700 MeV. For each photon energy the following function:
| (2) |
was minimized with regard to . Here is a known photon energy, is the energy calculated using expression (1). The energy dependences of were approximated by the smooth curves. The approximation was done separately for showers starting in different layers.
The apparatus effects, such as nonuniformity of light collection efficiency over the crystal volume and electronics instability also affect energy resolution:
| (3) |
where is the energy resolution obtained using Monte Carlo simulation without effects mentioned above, is electronics instability and calibration accuracy contribution, is the contribution of nonuniformity of light collection over the crystal volume. For example, for 500 MeV photons , , and . The dependence of the calorimeter energy resolution on photon energy (Fig. 12) was fitted as:
| (4) |
The calorimeter angular resolution for photons is also an important parameter. The distribution function of energy deposition in SND calorimeter outside the cone with the angle around the shower direction was obtained using Monte-Carlo simulation:
| (5) |
where the and parameters turned out to be practically independent of the photon energy over the interval MeV. The method of estimation of photon angles based on this dependence was introduced in [13]. The dependence of the angular resolution on the photon energy is shown on Fig. 13 and can be approximated as:
| (6) |
6 Particle identification
The discrimination between electromagnetic and hadronic showers in the calorimeter is often based on the total energy deposition (Fig. 14). Multilayer structure of the SND calorimeter provides additional means for identification based on the longitudinal energy deposition profiles. energy deposition distributions over layers for and are shown in Fig. 15. Two areas of pion concentration on this scatter plot correspond to the nuclear interactions of pions and pure ionization losses in the first two layers of NaI(Tl). Utilizing differences in energy depositions for electrons and pions, the special discrimination parameter was worked out. In the energy region it provides selection efficiency for , while keeping contamination by events .
The distribution of energy depositions in the calorimeter layers is also used for identification in decay. Such an identification provides the suppression of background in searches of rare decays, for example [14].
The and separation parameters, based on the differences in the energy deposition profiles in transverse direction, were also constructed. Their detailed description is given in [15].
7 The calorimeter performance
The calorimeter energy and angular resolution determine the accuracy of invariant mass measurements. The two-photon invariant mass distributions in and events, depicted in Figs. 16, 17, show clear peaks at and mesons masses. Invariant mass resolution is about 11 MeV for and 25 MeV for .
For the physical analysis of the most processes the kinematic fitting [16] is performed. As a result the angular and energy accuracy improve. For example, in the analysis of decays the fitting increases the two photons invariant mass resolution by 1.5 times (Fig. 18).
As a last example of the calorimeter performance, Fig. 19 shows -meson peak in the reaction .
8 Conclusion
SND detector operates at VEPP-2M since 1995. The total integrated luminosity in the center-of-mass energy range GeV was collected. Electric dipole radiative decays [17], [18] and OZI and G-parity suppressed decay [19] were observed for the first time. The [20] decay existence was confirmed. Other interesting physical results were also obtained.
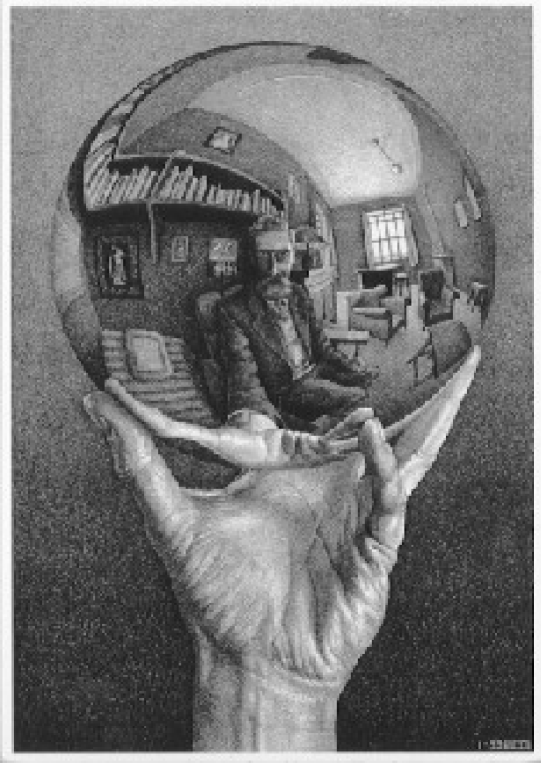
The SND calorimeter performance was crucial for all these results. In the last Fig. 20 we present an artist’s view on the SND calorimeter and provide citation from “M.C. Escher - The Graphic Work” [21], which gives, in our opinion, a concise impression to what the calorimeter is used for and also exhibits a real driving force in all high and medium energy physics experiments, and not only there.
“A reflecting globe rests in the artist’s hand. In this mirror he can have a much more complete view of his surroundings than by direct observation, for nearly the whole of the area around him - four walls, the floor and ceiling of his room - are compressed, albeit distorted, within this little disc. His head, or to be more precise, the point between his eyes, comes in the absolute center. The ego is the unshakable core of his world.”
References
- [1] A. N. Skrinsky, in Proc. of Workshop on physics and detectors for DANE, Frascati, Italy, April 4-7, 1995, p.3.
- [2] Review of particle physics, Particle Data Group, Eur. Phys. J. C3 (1998).
-
[3]
V. B. Golubev et al., Nucl. Instr. and Meth. 227 (1984) 467.
M. D. Minakov et al., Instrum. Exp. Tech. 23 (1981) 868. - [4] V. B. Golubev et al., Instrum. Exp. Tech. 24 (1982) 1373.
- [5] S. I. Dolinsky et al., Phys. Rep. 202 (1991) 161.
-
[6]
E. D. Bloom and C. Peck,
Ann. Rev. Nucl. Sci. 33 (1983) 1.
K. Wachs et al., Z. Phys. C 42 (1989) 33. - [7] Z. K. Silagadze, Nucl. Instr. and Meth. A376 (1996) 451.
-
[8]
P. M. Beschastnov et al.,
Nucl. Instr. and Meth. A 342 (1994) 477.
V. V. Anashin et al., Nucl. Instr. and Meth. A 379 (1996) 522. - [9] D. A. Bukin et al., Nucl. Instr. and Meth. A379 (1996) 545.
- [10] M. N. Achasov et al., Nucl. Instr. and Meth. A401 (1997) 179.
- [11] M. N. Achasov et al., Nucl. Instr. and Meth. A411 (1998) 337.
- [12] A. D. Bukin et al., Phys. Atom. Nucl. 56 (1993) 1494.
- [13] M. G. Bekishev, V. N. Ivanchenko, Nucl. Instr. and Meth. A361 (1995) 138
- [14] M. N. Achasov et al., hep-ex/9907004.
- [15] A. V. Bozhenok, V. N. Ivanchenko, Z. K. Silagadze, Nucl. Instr. and Meth. A379 (1996) 507.
- [16] J. P. Berge et al., Rev. Scien. Instr. 32 (1961) 538.
- [17] M. N. Achasov et al., Phys. Lett. B440 (1998) 442.
- [18] M. N. Achasov et al., Phys. Lett. B438 (1998) 441.
- [19] M. N. Achasov et al., Phys. Lett. B449 (1999) 122.
- [20] V. M. Aulchenko et al., JETP Letters 69 (1999) 87.
- [21] http://www.worldofescher.com/gallery/HandWithSphere.html