DESY–99–059 Measurement of High- Charged-Current Deep Inelastic Scattering Cross Sections at HERA
Abstract
The charged-current deep inelastic scattering cross sections, for between 200 and 60000 GeV2, and and for GeV2, have been measured with the ZEUS detector at HERA. A data sample of 47.7 pb-1, collected at a center-of-mass energy of 300 GeV, has been used. The cross section falls by a factor of about 50000 as increases from 280 to 30000 GeV2. The double differential cross section has also been measured. A comparison between the data and Standard Model (SM) predictions shows that contributions from antiquarks ( and ) and quarks ( and ) are both required by the data. The predictions of the SM give a good description of the full body of the data presented here. A comparison of the charged-current cross section with the recent ZEUS results for neutral-current scattering shows that the weak and electromagnetic forces have similar strengths for above . A fit to the data for with the Fermi constant and as free parameters yields and . Results for , where the propagator effect alone or the SM constraint between and have been considered, are also presented.
The ZEUS Collaboration
J. Breitweg,
S. Chekanov,
M. Derrick,
D. Krakauer,
S. Magill,
B. Musgrave,
A. Pellegrino,
J. Repond,
R. Stanek,
R. Yoshida
Argonne National Laboratory, Argonne, IL, USA p
M.C.K. Mattingly
Andrews University, Berrien Springs, MI, USA
G. Abbiendi,
F. Anselmo,
P. Antonioli,
G. Bari,
M. Basile,
L. Bellagamba,
D. Boscherini1,
A. Bruni,
G. Bruni,
G. Cara Romeo,
G. Castellini2,
L. Cifarelli3,
F. Cindolo,
A. Contin,
N. Coppola,
M. Corradi,
S. De Pasquale,
P. Giusti,
G. Iacobucci4,
G. Laurenti,
G. Levi,
A. Margotti,
T. Massam,
R. Nania,
F. Palmonari,
A. Pesci,
A. Polini,
G. Sartorelli,
Y. Zamora Garcia5,
A. Zichichi
University and INFN Bologna, Bologna, Italy f
C. Amelung,
A. Bornheim,
I. Brock,
K. Coböken,
J. Crittenden,
R. Deffner,
M. Eckert6,
H. Hartmann,
K. Heinloth,
E. Hilger,
H.-P. Jakob,
A. Kappes,
U.F. Katz,
R. Kerger,
E. Paul,
J. Rautenberg7,
H. Schnurbusch,
A. Stifutkin,
J. Tandler,
A. Weber,
H. Wieber
Physikalisches Institut der Universität Bonn,
Bonn, Germany c
D.S. Bailey,
O. Barret,
W.N. Cottingham,
B. Foster8,
G.P. Heath,
H.F. Heath,
J.D. McFall,
D. Piccioni,
J. Scott,
R.J. Tapper
H.H. Wills Physics Laboratory, University of Bristol,
Bristol, U.K. o r
M. Capua,
A. Mastroberardino,
M. Schioppa,
G. Susinno
Calabria University,
Physics Dept.and INFN, Cosenza, Italy f
H.Y. Jeoung,
J.Y. Kim,
J.H. Lee,
I.T. Lim,
K.J. Ma,
M.Y. Pac9
Chonnam National University, Kwangju, Korea h
A. Caldwell,
N. Cartiglia,
Z. Jing,
W. Liu,
B. Mellado,
J.A. Parsons,
S. Ritz10,
R. Sacchi,
S. Sampson,
F. Sciulli,
Q. Zhu11
Columbia University, Nevis Labs.,
Irvington on Hudson, N.Y., USA q
J. Chwastowski,
A. Eskreys,
J. Figiel,
K. Klimek,
K. Olkiewicz,
M.B. Przybycień,
P. Stopa,
L. Zawiejski
Inst. of Nuclear Physics, Cracow, Poland j
L. Adamczyk12,
B. Bednarek,
K. Jeleń,
D. Kisielewska,
A.M. Kowal,
T. Kowalski,
M. Przybycień,
E. Rulikowska-Zarȩbska,
L. Suszycki,
J. Zaja̧c
Faculty of Physics and Nuclear Techniques,
Academy of Mining and Metallurgy, Cracow, Poland j
Z. Duliński,
A. Kotański
Jagellonian Univ., Dept. of Physics, Cracow, Poland k
L.A.T. Bauerdick,
U. Behrens,
J.K. Bienlein,
C. Burgard,
K. Desler,
G. Drews,
A. Fox-Murphy, U. Fricke,
F. Goebel,
P. Göttlicher,
R. Graciani,
T. Haas,
W. Hain,
G.F. Hartner,
D. Hasell13,
K. Hebbel,
K.F. Johnson14,
M. Kasemann15,
W. Koch,
U. Kötz,
H. Kowalski,
L. Lindemann,
B. Löhr,
M. Martínez, J. Milewski16,
M. Milite,
T. Monteiro17,
M. Moritz,
D. Notz,
F. Pelucchi,
K. Piotrzkowski,
M. Rohde,
P.R.B. Saull,
A.A. Savin,
U. Schneekloth,
O. Schwarzer18,
F. Selonke,
M. Sievers,
S. Stonjek,
E. Tassi,
G. Wolf,
U. Wollmer,
C. Youngman,
W. Zeuner
Deutsches Elektronen-Synchrotron DESY, Hamburg, Germany
B.D. Burow19,
C. Coldewey,
H.J. Grabosch,
A. Lopez-Duran Viani,
A. Meyer,
K. Mönig,
S. Schlenstedt,
P.B. Straub
DESY Zeuthen, Zeuthen, Germany
G. Barbagli,
E. Gallo,
P. Pelfer
University and INFN, Florence, Italy f
G. Maccarrone,
L. Votano
INFN, Laboratori Nazionali di Frascati, Frascati, Italy f
A. Bamberger,
S. Eisenhardt20,
P. Markun,
H. Raach,
S. Wölfle
Fakultät für Physik der Universität Freiburg i.Br.,
Freiburg i.Br., Germany c
N.H. Brook21,
P.J. Bussey,
A.T. Doyle,
S.W. Lee,
N. Macdonald,
G.J. McCance,
D.H. Saxon,
L.E. Sinclair,
I.O. Skillicorn,
E. Strickland,
R. Waugh
Dept. of Physics and Astronomy, University of Glasgow,
Glasgow, U.K. o
I. Bohnet,
N. Gendner, U. Holm,
A. Meyer-Larsen,
H. Salehi,
K. Wick
Hamburg University, I. Institute of Exp. Physics, Hamburg,
Germany c
A. Garfagnini,
I. Gialas22,
L.K. Gladilin23,
D. Kçira24,
R. Klanner, E. Lohrmann,
G. Poelz,
F. Zetsche
Hamburg University, II. Institute of Exp. Physics, Hamburg,
Germany c
T.C. Bacon,
J.E. Cole,
G. Howell,
L. Lamberti25,
K.R. Long,
D.B. Miller,
A. Prinias26,
J.K. Sedgbeer,
D. Sideris,
A.D. Tapper,
R. Walker
Imperial College London, High Energy Nuclear Physics Group,
London, U.K. o
U. Mallik,
S.M. Wang
University of Iowa, Physics and Astronomy Dept.,
Iowa City, USA p
P. Cloth,
D. Filges
Forschungszentrum Jülich, Institut für Kernphysik,
Jülich, Germany
T. Ishii,
M. Kuze,
I. Suzuki27,
K. Tokushuku28,
S. Yamada,
K. Yamauchi,
Y. Yamazaki
Institute of Particle and Nuclear Studies, KEK,
Tsukuba, Japan g s
S.H. Ahn,
S.H. An,
S.J. Hong,
S.B. Lee,
S.W. Nam29,
S.K. Park
Korea University, Seoul, Korea h
H. Lim,
I.H. Park,
D. Son
Kyungpook National University, Taegu, Korea h
F. Barreiro,
J.P. Fernández,
G. García,
C. Glasman30,
J.M. Hernández31,
L. Labarga,
J. del Peso,
J. Puga,
I. Redondo32,
J. Terrón
Univer. Autónoma Madrid,
Depto de Física Teórica, Madrid, Spain n
F. Corriveau,
D.S. Hanna,
J. Hartmann33,
W.N. Murray34,
A. Ochs,
S. Padhi,
M. Riveline,
D.G. Stairs,
M. St-Laurent,
M. Wing
McGill University, Dept. of Physics,
Montréal, Québec, Canada b
T. Tsurugai
Meiji Gakuin University, Faculty of General Education, Yokohama, Japan
V. Bashkirov35,
B.A. Dolgoshein
Moscow Engineering Physics Institute, Moscow, Russia l
G.L. Bashindzhagyan,
P.F. Ermolov,
Yu.A. Golubkov,
L.A. Khein,
N.A. Korotkova,
I.A. Korzhavina,
V.A. Kuzmin,
O.Yu. Lukina,
A.S. Proskuryakov,
L.M. Shcheglova36,
A.N. Solomin36,
S.A. Zotkin
Moscow State University, Institute of Nuclear Physics,
Moscow, Russia m
C. Bokel, M. Botje,
N. Brümmer,
J. Engelen,
E. Koffeman,
P. Kooijman,
A. van Sighem,
H. Tiecke,
N. Tuning,
J.J. Velthuis,
W. Verkerke,
J. Vossebeld,
L. Wiggers,
E. de Wolf
NIKHEF and University of Amsterdam, Amsterdam, Netherlands i
D. Acosta37,
B. Bylsma,
L.S. Durkin,
J. Gilmore,
C.M. Ginsburg,
C.L. Kim,
T.Y. Ling,
P. Nylander
Ohio State University, Physics Department,
Columbus, Ohio, USA p
H.E. Blaikley,
S. Boogert,
R.J. Cashmore17,
A.M. Cooper-Sarkar,
R.C.E. Devenish,
J.K. Edmonds,
J. Große-Knetter38,
N. Harnew,
T. Matsushita,
V.A. Noyes39,
A. Quadt17,
O. Ruske,
M.R. Sutton,
R. Walczak,
D.S. Waters
Department of Physics, University of Oxford,
Oxford, U.K. o s
A. Bertolin,
R. Brugnera,
R. Carlin,
F. Dal Corso,
S. Dondana,
U. Dosselli,
S. Dusini,
S. Limentani,
M. Morandin,
M. Posocco,
L. Stanco,
R. Stroili,
C. Voci
Dipartimento di Fisica dell’ Università and INFN,
Padova, Italy f
L. Iannotti40,
B.Y. Oh,
J.R. Okrasiński,
W.S. Toothacker,
J.J. Whitmore
Pennsylvania State University, Dept. of Physics,
University Park, PA, USA q
Y. Iga
Polytechnic University, Sagamihara, Japan g
G. D’Agostini,
G. Marini,
A. Nigro,
M. Raso
Dipartimento di Fisica, Univ. ’La Sapienza’ and INFN,
Rome, Italy
C. Cormack,
J.C. Hart,
N.A. McCubbin,
T.P. Shah
Rutherford Appleton Laboratory, Chilton, Didcot, Oxon,
U.K. o
D. Epperson,
C. Heusch,
H.F.-W. Sadrozinski,
A. Seiden,
R. Wichmann,
D.C. Williams
University of California, Santa Cruz, CA, USA p
N. Pavel
Fachbereich Physik der Universität-Gesamthochschule
Siegen, Germany c
H. Abramowicz41,
S. Dagan42,
S. Kananov42,
A. Kreisel,
A. Levy42
Raymond and Beverly Sackler Faculty of Exact Sciences,
School of Physics, Tel-Aviv University,
Tel-Aviv, Israel e
T. Abe,
T. Fusayasu,
M. Inuzuka,
K. Nagano,
K. Umemori,
T. Yamashita
Department of Physics, University of Tokyo,
Tokyo, Japan g
R. Hamatsu,
T. Hirose,
K. Homma43,
S. Kitamura44,
T. Nishimura
Tokyo Metropolitan University, Dept. of Physics,
Tokyo, Japan g
M. Arneodo45,
R. Cirio,
M. Costa,
M.I. Ferrero,
S. Maselli,
V. Monaco,
C. Peroni,
M.C. Petrucci,
M. Ruspa,
A. Solano,
A. Staiano
Università di Torino, Dipartimento di Fisica Sperimentale
and INFN, Torino, Italy f
M. Dardo
II Faculty of Sciences, Torino University and INFN -
Alessandria, Italy f
D.C. Bailey,
C.-P. Fagerstroem,
R. Galea,
T. Koop,
G.M. Levman,
J.F. Martin,
R.S. Orr,
S. Polenz,
A. Sabetfakhri,
D. Simmons
University of Toronto, Dept. of Physics, Toronto, Ont.,
Canada a
J.M. Butterworth, C.D. Catterall,
M.E. Hayes,
E.A. Heaphy,
T.W. Jones,
J.B. Lane,
B.J. West
University College London, Physics and Astronomy Dept.,
London, U.K. o
J. Ciborowski,
R. Ciesielski,
G. Grzelak,
R.J. Nowak,
J.M. Pawlak,
R. Pawlak,
B. Smalska,
T. Tymieniecka,
A.K. Wróblewski,
J.A. Zakrzewski,
A.F. Żarnecki
Warsaw University, Institute of Experimental Physics,
Warsaw, Poland j
M. Adamus,
T. Gadaj
Institute for Nuclear Studies, Warsaw, Poland j
O. Deppe,
Y. Eisenberg42,
D. Hochman,
U. Karshon42
Weizmann Institute, Department of Particle Physics, Rehovot,
Israel d
W.F. Badgett,
D. Chapin,
R. Cross,
C. Foudas,
S. Mattingly,
D.D. Reeder,
W.H. Smith,
A. Vaiciulis46,
T. Wildschek,
M. Wodarczyk
University of Wisconsin, Dept. of Physics,
Madison, WI, USA p
A. Deshpande,
S. Dhawan,
V.W. Hughes
Yale University, Department of Physics,
New Haven, CT, USA p
S. Bhadra,
W.R. Frisken,
R. Hall-Wilton,
M. Khakzad,
S. Menary,
W.B. Schmidke
York University, Dept. of Physics, Toronto, Ont.,
Canada a
1 now visiting scientist at DESY
2 also at IROE Florence, Italy
3 now at Univ. of Salerno and INFN Napoli, Italy
4 also at DESY
5 supported by Worldlab, Lausanne, Switzerland
6 now at BSG Systemplanung AG, 53757 St. Augustin
7 drafted to the German military service
8 also at University of Hamburg, Alexander von
Humboldt Research Award
9 now at Dongshin University, Naju, Korea
10 now at NASA Goddard Space Flight Center, Greenbelt, MD
20771, USA
11 now at Greenway Trading LLC
12 supported by the Polish State Committee for
Scientific Research, grant No. 2P03B14912
13 now at Massachusetts Institute of Technology, Cambridge, MA,
USA
14 visitor from Florida State University
15 now at Fermilab, Batavia, IL, USA
16 now at ATM, Warsaw, Poland
17 now at CERN
18 now at ESG, Munich
19 now an independent researcher in computing
20 now at University of Edinburgh, Edinburgh, U.K.
21 PPARC Advanced fellow
22 visitor of Univ. of Crete, Greece,
partially supported by DAAD, Bonn - Kz. A/98/16764
23 on leave from MSU, supported by the GIF,
contract I-0444-176.07/95
24 supported by DAAD, Bonn - Kz. A/98/12712
25 supported by an EC fellowship
26 PPARC Post-doctoral fellow
27 now at Osaka Univ., Osaka, Japan
28 also at University of Tokyo
29 now at Wayne State University, Detroit
30 supported by an EC fellowship number ERBFMBICT 972523
31 now at HERA-B/DESY supported by an EC fellowship
No.ERBFMBICT 982981
32 supported by the Comunidad Autonoma de Madrid
33 now at debis Systemhaus, Bonn, Germany
34 now a self-employed consultant
35 now at Loma Linda University, Loma Linda, CA, USA
36 partially supported by the Foundation for German-Russian Collaboration
DFG-RFBR
(grant no. 436 RUS 113/248/3 and no. 436 RUS 113/248/2)
37 now at University of Florida, Gainesville, FL, USA
38 supported by the Feodor Lynen Program of the Alexander
von Humboldt foundation
39 now with Physics World, Dirac House, Bristol, U.K.
40 partly supported by Tel Aviv University
41 an Alexander von Humboldt Fellow at University of Hamburg
42 supported by a MINERVA Fellowship
43 now at ICEPP, Univ. of Tokyo, Tokyo, Japan
44 present address: Tokyo Metropolitan University of
Health Sciences, Tokyo 116-8551, Japan
45 now also at Università del Piemonte Orientale, I-28100 Novara,
Italy, and Alexander von
Humboldt fellow at the University of Hamburg
46 now at University of Rochester, Rochester, NY, USA
| a | supported by the Natural Sciences and Engineering Research Council of Canada (NSERC) |
|---|---|
| b | supported by the FCAR of Québec, Canada |
| c | supported by the German Federal Ministry for Education and Science, Research and Technology (BMBF), under contract numbers 057BN19P, 057FR19P, 057HH19P, 057HH29P, 057SI75I |
| d | supported by the MINERVA Gesellschaft für Forschung GmbH, the German Israeli Foundation, and by the Israel Ministry of Science |
| e | supported by the German-Israeli Foundation, the Israel Science Foundation, the U.S.-Israel Binational Science Foundation, and by the Israel Ministry of Science |
| f | supported by the Italian National Institute for Nuclear Physics (INFN) |
| g | supported by the Japanese Ministry of Education, Science and Culture (the Monbusho) and its grants for Scientific Research |
| h | supported by the Korean Ministry of Education and Korea Science and Engineering Foundation |
| i | supported by the Netherlands Foundation for Research on Matter (FOM) |
| j | supported by the Polish State Committee for Scientific Research, grant No. 115/E-343/SPUB/P03/154/98, 2P03B03216, 2P03B04616, 2P03B10412, 2P03B05315, 2P03B03517, and by the German Federal Ministry of Education and Science, Research and Technology (BMBF) |
| k | supported by the Polish State Committee for Scientific Research (grant No. 2P03B08614 and 2P03B06116) |
| l | partially supported by the German Federal Ministry for Education and Science, Research and Technology (BMBF) |
| m | supported by the Fund for Fundamental Research of Russian Ministry for Science and Education and by the German Federal Ministry for Education and Science, Research and Technology (BMBF) |
| n | supported by the Spanish Ministry of Education and Science through funds provided by CICYT |
| o | supported by the Particle Physics and Astronomy Research Council |
| p | supported by the US Department of Energy |
| q | supported by the US National Science Foundation |
| r | partially supported by the British Council, ARC Project 0867.00 |
| s | partially supported by the British Council, Collaborative Research Project, TOK/880/11/15 |
1 Introduction
Deep inelastic scattering (DIS) of leptons on nucleons is the key source of information for the development of our understanding of the structure of the nucleon. In the Standard Model (SM), charged-current (CC) DIS is mediated by the exchange of the boson (see Fig. 1(a)). In contrast to neutral-current (NC) interactions, where all quark and antiquark flavors contribute, only down-type quarks (antiquarks) and up-type antiquarks (quarks) participate at leading order in () CC DIS reactions. Therefore, CC DIS provides a powerful tool for the flavor-specific investigation of parton momentum distributions. Even though CC events are kinematically less constrained than NC events due to the unobserved final-state neutrino, they can be identified with little background at HERA.
First measurements of the CC DIS cross section at HERA, reported previously by the H1 [1, 2] and ZEUS [3, 4] collaborations, extended the coverage of the kinematic range compared to that of the fixed-target neutrino-nucleus scattering experiments [5] by about two orders of magnitude in the four-momentum transfer squared (). These analyses were based on and data samples of approximately 1 pb-1 and 3 pb-1, respectively. The cross section at high demonstrated, for the first time, the presence of a space-like propagator with a finite mass, consistent with that of the boson.
This paper presents results from ZEUS on the CC DIS differential cross sections , , and for GeV2, and comparisons to SM predictions. The measurements are based on 47.7 pb-1 of data collected with the ZEUS detector from 1994 – 1997 during which HERA collided 27.5 GeV positrons with 820 GeV protons, yielding a center-of-mass energy GeV. The 16-fold increase in the luminosity compared to the previous measurements allows the double differential cross section to be determined in this high- regime for the first time. A recent publication presented NC cross sections from the same data sample [6]. These data, together with those presented here, permit a precise comparison of CC and NC cross sections up to values of about GeV2.
2 Standard Model prediction
The electroweak Born cross section for the reaction
| (1) |
can be written as
| (2) |
where is the Fermi constant, is the mass of the boson, is the Bjorken scaling variable, and . The center-of-mass energy of the positron-proton collision is given by , where and are the positron and proton beam energies, respectively. The structure functions and , in leading-order (LO) QCD, measure sums and differences of quark and antiquark parton momentum distributions [7]. For longitudinally unpolarized beams,
| (3) |
| (4) |
where is, for example, the parton distribution function (PDF) which gives the number density of a down quark with momentum fraction in the proton. Since the top quark mass is large and the off-diagonal elements of the CKM matrix are small, the contribution from the third generation quarks to the structure functions may be safely ignored [8]. The chirality of the CC interaction is reflected by the factors multiplying the structure functions. The longitudinal structure function, , is zero at leading order but is finite at next-to-leading-order (NLO) QCD. It gives a negligible contribution to the cross section except at values close to 1, where it can be as large as 10%.
The electroweak radiative corrections to (2) receive contributions from initial state photon radiation, fermion and boson loops, and the exchange of multiple intermediate vector bosons. The effects of these radiative corrections are taken into account to leading order [9], so that the quoted cross sections in this paper are corrected to the electroweak Born level. Equation (2) is evaluated with and [10]. The uncertainties in the electroweak parameters have a negligible effect both on the calculated cross sections and on the radiative corrections.
Thus, the main uncertainty in the SM cross-section prediction comes from the PDF uncertainties, which are discussed in detail in [6, 11] and are taken into account in the CC cross-section calculation. The resulting uncertainty in , for example, ranges from 4% at GeV2 to 10% at GeV2, and increases further at higher . The large uncertainty at high is due to the -quark density which is poorly constrained at high by the experimental data.
3 The ZEUS experiment
ZEUS [12] is a multipurpose magnetic detector designed to measure interactions at HERA. The primary components used for this analysis are the compensating uranium-scintillator calorimeter (CAL), the central tracking detector (CTD), and the luminosity detector.
The ZEUS coordinate system is right-handed with the axis pointing in the direction of the proton beam (forward) and the axis pointing horizontally toward the center of HERA. The polar angle is zero in the direction.
Tracking information is provided by the CTD [13] operating in a 1.43 T solenoidal magnetic field. The interaction vertex is measured with a typical resolution along (transverse to) the beam direction of 0.4 (0.1) cm. The CTD is used to reconstruct the momenta of tracks in the polar angle region . The transverse momentum () resolution for full-length tracks can be parameterized as , with in GeV.
The CAL [14] covers of the total solid angle. It is divided into three parts with a corresponding division in as viewed from the nominal interaction point: forward (FCAL, ), barrel (BCAL, ) and rear (RCAL, ). Each section is subdivided into towers which subtend solid angles between 0.006 and 0.04 steradian. Each tower is longitudinally segmented into an electromagnetic (EMC) and one (RCAL) or two (FCAL, BCAL) hadronic sections (HAC). The electromagnetic section of each tower is further subdivided transversely into two (RCAL) or four (BCAL, FCAL) cells. Under test beam conditions the calorimeter resolutions were for electrons and for hadrons. The calorimeter has a time resolution of better than 1 ns for energy deposits above 4.5 GeV. The position of the interaction vertex along the beam direction can also be reconstructed from the measured arrival time of energy deposits in FCAL [15]. The resolution is about 9 cm for events with FCAL energy above 25 GeV and improves to about 7 cm for FCAL energy above 100 GeV.
An instrumented-iron backing calorimeter [16] (BAC) measures energy leakage from the CAL. The muon chambers in the forward [12], barrel and rear [17] regions are used in this analysis to detect background events induced by cosmic-ray or beam-halo muons.
The luminosity is measured using the Bethe-Heitler reaction [18]. The resulting small angle energetic photons are measured by the luminosity monitor, a lead-scintillator calorimeter placed in the HERA tunnel 107 m from the interaction point in the positron beam direction.
4 Monte Carlo simulation
Monte Carlo simulations (MC) are used to determine the efficiency for selecting events, to determine the accuracy of kinematic reconstruction, to estimate the background rate and to extrapolate measured cross sections to the full kinematic phase space. A sufficient number of events is generated to ensure that errors from MC statistics can be neglected. The MC samples are normalized to the total integrated luminosity of the data.
The ZEUS detector response is simulated with a program based on geant [19]. The generated events are passed through the simulated detector, subjected to the same trigger requirements as the data, and processed by the same reconstruction programs.
The underlying distribution of the -coordinate of the event vertex is determined using a minimum-bias sample of low- neutral-current DIS events as discussed in detail in [6].
CC DIS events including radiative effects are simulated using the heracles 4.5.2 [9] program with the django6 2.4 [20] interface to the QCD programs. In heracles, corrections for initial-state radiation, vertex and propagator corrections, and two-boson exchange are included. The QCD cascade and the hadronic final state are simulated using the color-dipole model of ariadne 4.08 [21] and, as a systematic check, the meps model of lepto 6.5 [22]. Both programs use the Lund string model of jetset 7.4 [23] for the hadronization. A set of NC events generated with django is used to estimate the NC contamination in the CC sample.
5 Reconstruction of kinematic variables
The principal signature of CC DIS events at HERA is the presence of a large missing transverse momentum, . This is illustrated in Fig. 1(b), where an event from the final CC DIS sample is shown. The struck quark gives rise to one or more jets of hadrons. The energetic final-state neutrino escapes detection, leaving a large imbalance in the transverse momentum observed in the detector. is calculated as
| (5) |
where the sum runs over all calorimeter energy deposits (uncorrected in the trigger, but corrected in the offline analysis as discussed below), and and are their polar and azimuthal angles as viewed from the interaction vertex. The hadronic polar angle, , is defined by
| (6) |
where
| (7) |
In the naïve Quark Parton Model, gives the angle of the struck quark. Another variable used in the selection is the total transverse energy, , given by
| (8) |
The kinematic variables are reconstructed using the Jacquet-Blondel method [27]. The estimators of , and are:
| (9) |
For the offline determination of and , methods developed and tested for the NC cross section determination [6] are used. The calorimeter cells with energy deposits are grouped into units called clusters. For each cluster, corrections depending on the cluster energy and angle are made for hadronic energy loss in inactive material in front of the calorimeter. The correction algorithm, which is based on MC, has been verified using the highly constrained NC events measured in the ZEUS detector. Energetic hadron jets in the FCAL direction may produce particles backscattered into the BCAL or RCAL (albedo). Also, particles may be redirected by the material between the interaction point and the calorimeter. Such effects, which create biases in the measurement of , are suppressed by removing low energy clusters at polar angles much larger than the calculated value of .
6 Event selection
CC DIS candidates are selected by requiring large and a reconstructed event vertex consistent with an interaction. The main sources of background affecting the CC event selection are processes like NC DIS and high- photoproduction, where the finite resolution or energy escaping detection in the CAL cause . Events not originating from collisions such as beam-gas interactions, beam-halo muons or cosmic rays can also cause substantial apparent imbalance in the transverse momentum and constitute other sources of background. The selection criteria described below are imposed to separate CC events from the background.
The events are classified first according to , the value of measured with respect to the nominal interaction point. If is sufficiently large, i.e. in the central region, tracks in the CTD are used to reconstruct the event vertex, which strongly suppresses non- backgrounds. The selection procedure designed to select these events is described in Sect. 6.2. On the other hand, if is small, i.e. in the forward region, the hadronic final state of such CC events is often outside the acceptance of the CTD, and thus calorimeter timing is used for the vertex reconstruction. The algorithm designed specifically to select such events, which tend to be at high values, is described in Sect. 6.3. The kinematic quantities are finally recalculated using the -coordinate of the event vertex () determined from either CTD tracks or calorimeter timing, depending on .
6.1 Trigger selection
ZEUS has a three-level trigger system [12]. At the first trigger level, events are selected using criteria based on the energy, transverse energy and missing transverse momentum determined by the calorimeter [28]. Generally, events are triggered with a lower threshold of these values in coincidence with at least one CTD track, while a higher threshold is necessary for events with no CTD track. The latter events have a hadronic final state boosted forward outside the CTD acceptance. Typical threshold values are 5 GeV (8 GeV) in missing transverse momentum, or 11.5 GeV (30 GeV) in transverse energy, for events with (without) CTD tracks.
At the second level, timing information from the calorimeter is used to reject background events inconsistent with the bunch-crossing time. Also, the missing transverse momentum is available with better resolution than at the first level, so that a tighter cut of 6 GeV (9 GeV without CTD track) can be made.
At the third level, track reconstruction and vertex finding are performed and are used to reject candidate events with a vertex that is inconsistent with an interaction. The thresholds on the trigger quantities are lower than the cut variables used in the offline analysis.
6.2 Offline selection based on a CTD vertex
Events with are required to contain a vertex reconstructed from CTD tracks and to satisfy the following criteria:
-
•
GeV and GeV
is the missing transverse momentum calculated excluding the FCAL towers closest to the beam hole. The cut strongly suppresses beam-gas background events while maintaining high efficiency for CC events. -
•
cm
A vertex reconstructed by the CTD is required to be within the range consistent with the interaction region. -
•
Tracking requirement
At least one track associated with the event vertex must have transverse momentum in excess of 0.2 GeV and a polar angle in the range to . -
•
Rejection of photoproduction
Photoproduction events tend to have azimuthally symmetric hadronic energy flow. At high , a relatively small imbalance due to resolution effects or escaping particles can lead to non-negligible . These events are rejected by the following cuts: is required for events with GeV; is required for events with GeV. No requirement is imposed on events with GeV. In addition, the difference between the direction of the vector calculated using CTD tracks and that obtained using the calorimeter is required to be less than 1 radian if GeV and less than 2 radians if GeV. -
•
Rejection of NC DIS
NC DIS events in which the positron or jet energy is poorly measured can have a large . To identify such events, a positron-finding algorithm which selects isolated electromagnetic clusters [29] is used. Candidate positron clusters within the CTD acceptance are required to have an energy above 4 GeV and a matching track with momentum larger than 25% of the cluster energy. Clusters with are required to have a transverse momentum exceeding 2 GeV. Events with a candidate positron satisfying the above criteria and GeV are rejected; for contained NC events, peaks at GeV. This cut is applied only for events with GeV. -
•
Rejection of non- background
Beam-gas events typically give calorimeter arrival times which are inconsistent with the bunch-crossing time. Such events are rejected. A muon-finding algorithm based on calorimeter energy deposits or muon-chamber signals is used to reject events produced by cosmic-ray or beam-halo muons.
6.3 Offline selection without CTD vertex
Events with are not required to have an event vertex reconstructed from CTD tracks. They must satisfy the following criteria:
-
•
GeV and GeV
Relaxing the requirements on tracking and the CTD vertex results in an increase of non- background. To compensate for this, the requirements on the missing transverse momentum are tightened. -
•
cm
is reconstructed from the measured arrival time of energy deposits in FCAL. The relation between the timing measurement and was determined using a large data sample of NC DIS events, in which a reliable estimate can be obtained from the positron track even if the hadronic system is boosted in the very forward direction. -
•
Rejection of photoproduction
is required for events with GeV. This cut also suppresses beam-gas interactions. -
•
Rejection of non- background
The same timing and muon-rejection cuts are used as described in Sect. 6.2. A class of background events which are especially troublesome in this selection branch arises from beam-halo muons interacting inside the FCAL. To reduce this background, topological cuts on the transverse and longitudinal shower shape are imposed; these reject events where the energy deposits are much more strongly collimated than for typical hadronic jets. Another characteristic of muons traversing the detector parallel to the beam line is a coincidence of energy deposits in the RCAL and FCAL at similar positions. If such a coincidence is found, the event is rejected.
NC DIS is negligible in this selection branch.
6.4 Final event sample
In order to restrict the sample to regions where the resolution in the kinematic variables is acceptable and the background is small, further requirements GeV2 and are imposed. The cross sections presented below are corrected to the full range using the SM -dependence described by (2).
The combined selection efficiency of the above cuts for most of the and region (, ) is typically 90%. At low or high , the efficiency decreases due to the requirement. At low , the hadronic system is close to the beam pipe and the requirement affects the efficiency. The overall selection efficiency for CC events with GeV2 is 70%.
The final sample consists of 1086 events. All events have been scanned visually, and no remaining cosmic or halo-muon background events have been found. The distribution of versus for the accepted events is shown in Fig. 2. For , the sample is dominated by events for which the interaction vertex is determined by the calorimeter timing (full circles). Figure 2 also demonstrates that the acceptance is zero for events at very low x in the low region due to the cut. There is also zero acceptance for events at very low (low and high ), where a large part of the hadronic system escapes in the forward beam pipe direction. The MC is used to correct for the acceptance loss of such events in determining the cross sections.
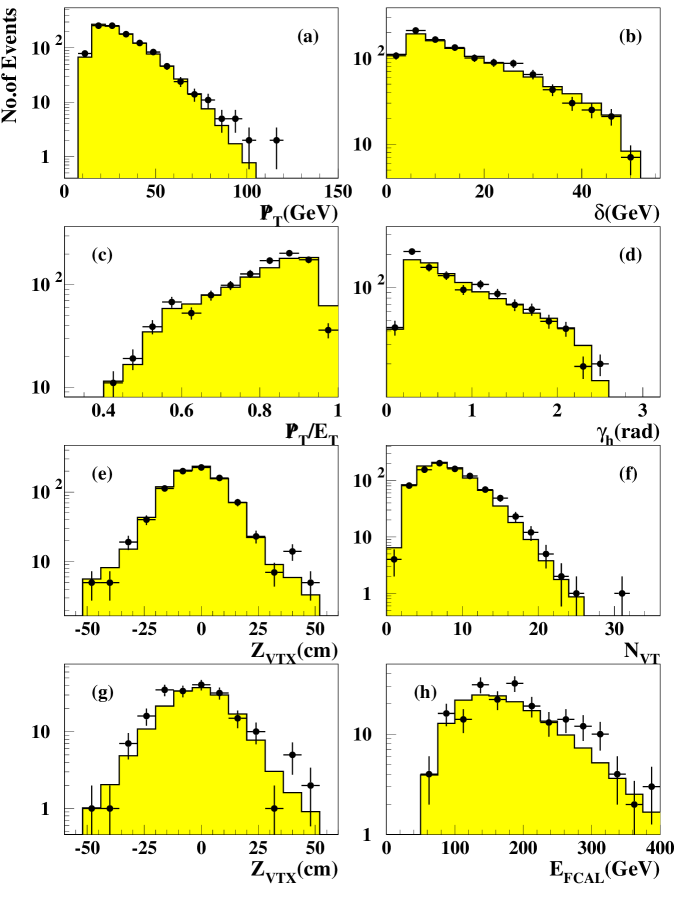
Figures 3(a)-(d) show the distributions of the variables , , and in the final event sample, compared with the corresponding MC predictions, which include the contributions from CC DIS and the small contributions from the background sources described below. The CC MC distribution is based on the CTEQ4D [30] PDF set (see discussion in Sect. 9.1). The contamination from events not due to collisions, such as beam-gas interactions, is negligible. In general, good agreement is observed, except for some excess at low . Furthermore, the peak of the distribution is shifted to slightly lower values as compared to MC. For the events selected with a CTD vertex (Sect. 6.2), shown by the open circles in Fig. 2, the distributions of and the number of tracks assigned to the primary vertex are provided in Fig. 3(e) and (f). The good agreement between data and MC shows that as far as the acceptance calculation is concerned, the CC final state is well modeled by the MC. For the events selected with a timing vertex (Sect. 6.3), the distributions of and the total energy in FCAL, , are shown in (g) and (h). About 18% of data events fall in this category, while MC predicts 16%. This small excess is directly related to the excess in the low (i.e. high ) region seen in (d). As seen in (h), all events in this sample have large FCAL energies to ensure a good resolution for from the timing.
The relative resolution in is approximately 20% over the entire range of . The relative resolution in improves from % in the interval (see Sect. 7) to at high , and that in is approximately 8% over the entire range, except for where it increases to %. Here the resolutions are obtained by comparing the reconstructed quantities with the true values in MC, and the RMS value of the distribution is quoted.
The fraction of background events in the final sample is typically below 1% at high and increases as decreases, exceeding 10% in the interval 200 GeV 400 GeV2 (see Sect. 7), as estimated from MC. Photoproduction and Bethe-Heitler dilepton production in the dimuon channel are the dominant sources of background at low , whereas the production and decay of time-like bosons is the remaining background at high . The contamination from NC events is negligible.
7 Cross-section determination
The single and double differential cross sections are determined using bin-by-bin unfolding. The measured cross section in a particular bin, , is determined from
| (10) |
where is the number of observed events in the bin, is the estimated number of background events, is the acceptance and is the integrated luminosity. The acceptance, defined from the MC as the number of events reconstructed within the bin divided by the number of events generated in that bin, takes both the selection efficiency and the event migration due to resolution into account.
The measured cross section includes the radiative effects discussed in Sect. 2. The correction factor to provide the Born-level cross section is defined as
| (11) |
The numerator is obtained by numerically integrating (2) over the bin. The value of , the cross section in the bin including radiation, is calculated using heracles 4.6.2 [31]. The measured Born-level cross section is then given by
| (12) |
Finally, the quoted differential cross section, for example , is calculated as
| (13) |
A similar procedure is used for and . In this manner, the acceptance factor is used to correct the effect of all the selection cuts (Sect. 6) and the cross sections are extrapolated to the full kinematic range. In particular the MC is used to extrapolate beyond the -region restricted by the cut. The differential cross sections and are quoted in the region GeV2.
For the measurement, nine bins are used between and 60000 GeV2. The bins have equal width in between 400 and 22494 GeV2 (four bins per decade), while the lowest and highest bins have somewhat larger width. For , bins of equal width in are used, three between and , and four between and . For the measurement, the region is divided equally into two bins between and , and five bins between and . All bins are defined such that their sizes significantly exceed the resolutions of the respective variables (see Sect. 6.4). The values at which and are quoted, and , are chosen to be near the logarithmic center of each bin, except in the highest and bins, where they are chosen lower than the logarithmic center, reflecting the very steeply falling cross sections. The cross section is quoted at the center of each bin.
The statistical errors are calculated using the square root of the number of measured events, , for and otherwise from Poisson confidence intervals around .
8 Systematic uncertainties
The major sources of systematic uncertainties for the quoted cross sections are described below. The individual uncertainties are added in quadrature separately for the positive and negative deviations from the nominal cross section values to obtain the total systematic uncertainty. The uncertainty on the luminosity of the combined 1994 –1997 sample is 1.6% and is not included in the total systematic uncertainty.
-
•
Uncertainty of the calorimeter energy scale
The uncertainty in the hadronic energy scale of the calorimeter is determined by the methods described in [6] to be 2% for FCAL and BCAL, and 3% for RCAL. Varying the energy scale of the calorimeter separately by this amount in the detector simulation induces shifts of the Jacquet-Blondel estimators for the kinematic variables. The resulting systematic errors in the measured cross sections are typically less than , but increase to in the highest bin and in the highest bin.A 2% fraction of the accepted events have a measurable energy leakage from the CAL into the BAC. The average energy leakage for these events is 4 GeV. This effect on the cross-section measurement is negligible.
-
•
Variation of selection thresholds
The threshold values of the selection cuts are varied independently in MC by typically 10%. The largest effect is observed when varying the threshold; this changes the cross section by 8% in the lowest bin and 4% in the highest bin. Varying the threshold produces a 3% change in the lowest bin. -
•
Uncertainty in the parton-shower scheme
To test the sensitivity of the results to the details of the simulation of higher-order QCD effects in the hadronic final state, the lepto meps model is used instead of the ariadne model for calculating the acceptance. The largest effects are observed in the bins of lowest (8%), highest (6%), lowest (5%) and highest (5%). -
•
Background subtraction
The uncertainty of the photoproduction background is estimated by fitting a linear combination of the distributions of the signal and the photoproduction MC samples to the corresponding distribution in the data, allowing the normalizations of the direct and resolved photoproduction components to vary. No cut on is applied for this check. A 40% uncertainty in the photoproduction background is found, leading to a sizable systematic error in the lowest bins (4% in and maximum 7% in ). At GeV2, the effect is less than 1%. -
•
Trigger efficiency
The simulation of the efficiency of the first-level trigger as a function of is examined by using data events triggered independently. This independent trigger is efficient for CC events and is based on the calorimeter energy sums. The difference between the efficiencies calculated from the data and from MC has a negligible effect on the measured cross section. -
•
Choice of parton distribution functions
The CC MC events are generated using the CTEQ4D PDFs. To examine the influence of variations of the PDFs on the cross-section measurement, the PDFs of MRSA [32] and GRV94 [33] are also considered. In addition, a modification of the -quark to -quark density ratio according to the prescription (see [34] and discussion in Sect. 9) has been tested. This increases the predicted CC cross section at high .The MC events are re-weighted using these alternative PDFs and new acceptance correction factors are computed. The change in the measured cross section is typically and at most 2.5% over the entire kinematic range of interest.
The radiative correction factors also depend on the choice of the PDFs. Using the program hector [35], the difference in the radiative correction factors by changing the PDFs is found to be typically less than 0.1% and thus is neglected.
The calculation of the differential cross section in a given bin according to (13) uses the ratio of the differential to the integrated SM cross sections. The ratio is sensitive to the shape of the PDFs within this bin. The largest effects are observed in the highest bin (3.5%) and highest bin (3%).
-
•
The effect of
The django program neglects the contribution when generating CC events. The corresponding effect on the acceptance correction factors is evaluated by reweighting MC events with the ratio of the cross sections with and without . The largest effect is observed in the highest bin where it amounts to 1.5%. -
•
Uncertainty in the radiative correction
The uncertainties in the radiative correction as determined with heracles are estimated to be smaller than 3% in the kinematic region considered [36] and are not included in the total systematic uncertainty.
9 Cross-section results
9.1 Single differential cross sections
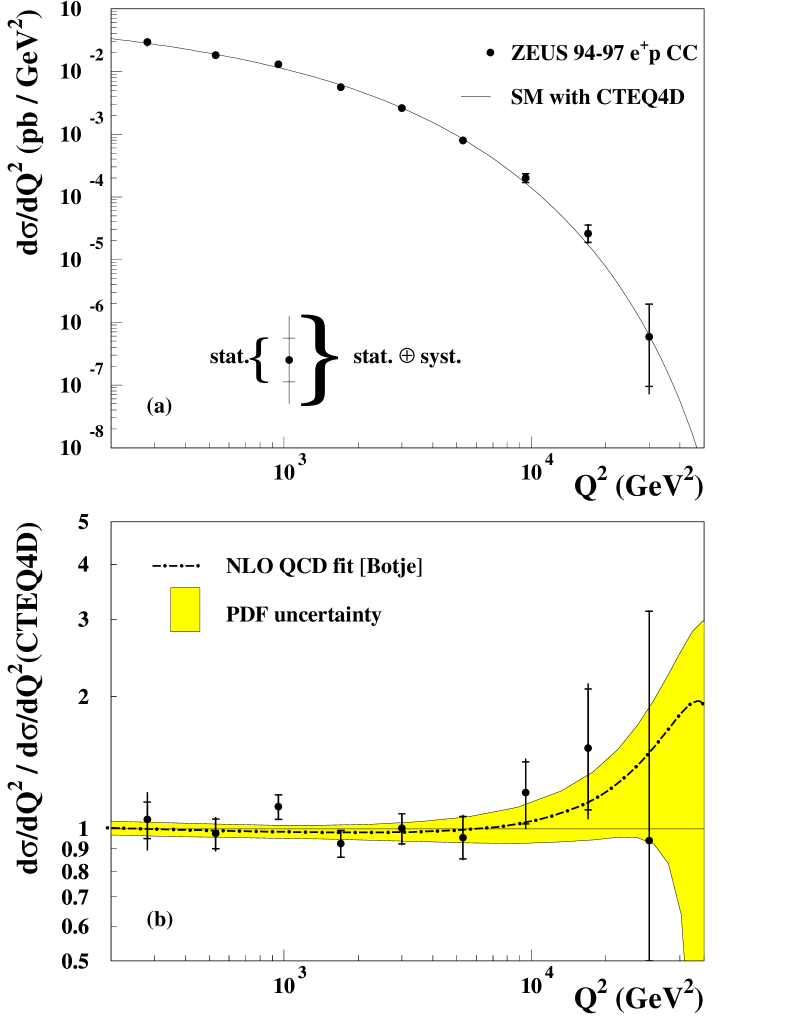
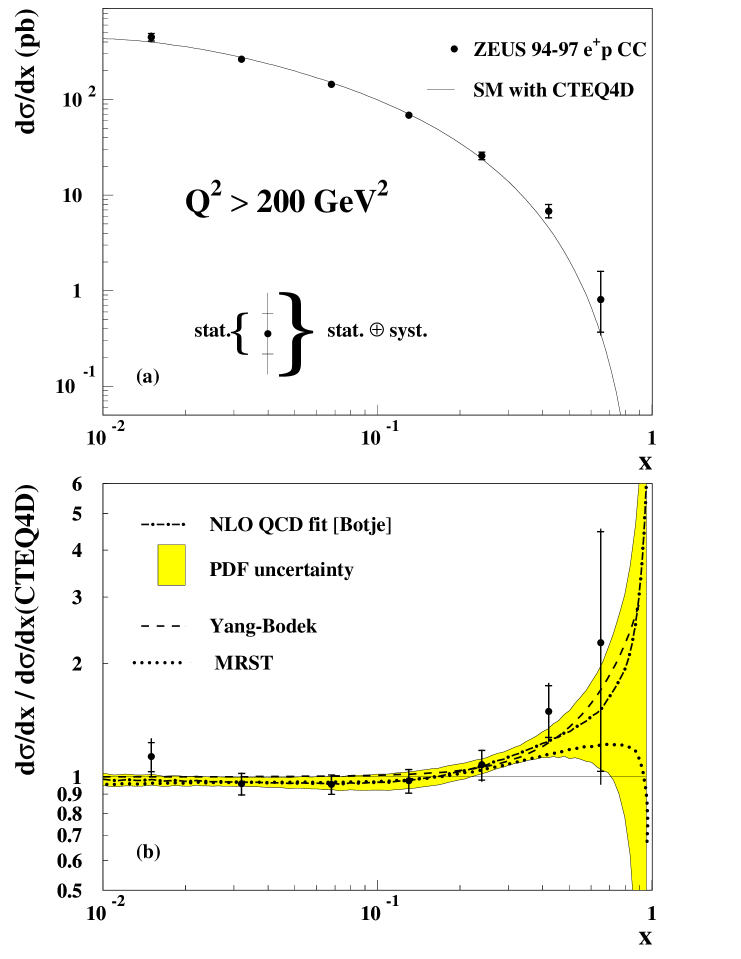
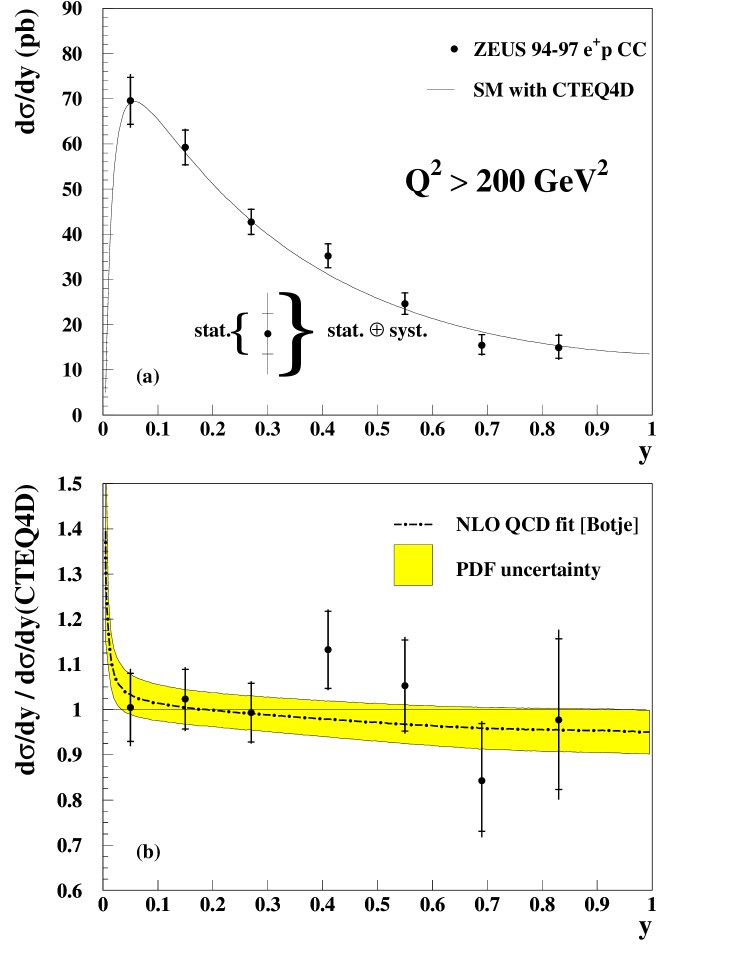
The differential cross sections , and are shown in Figs. 4(a), 5(a) and 6(a) and are compiled111Tables 5 and 6 contain details of the systematic uncertainties that are correlated between cross-section bins. in Tables 1 – 3. The uncertainty of the measured cross sections are dominated by statistical errors and are typically 7 – 20%. The cross section falls by a factor of about 50000 between and 30000 GeV2. As a function of , the cross section is largest at small , showing a gradual decrease from to , followed by a sharp drop towards . The cross section decreases slowly as a function of for .
The Standard Model cross sections from (2) using CTEQ4D are also shown in Figs. 4 – 6, together with the ratios of the measured to the SM cross section. The Standard Model describes the data well, with the possible exception of , where the measurement at is somewhat above the CTEQ4D prediction.
Also shown are the cross-section predictions obtained from a NLO QCD fit [11], together with their uncertainties. The fit is made to the data from fixed-target experiments and NC DIS measurements at HERA in the region GeV2. Neither the CC data from HERA nor the recent high- NC data from ZEUS [6] are included in the fit. The prediction from the fit also describes the data well, and in particular describes at higher better than the CTEQ4D prediction222 The CTEQ5 PDFs [37], which have been made available recently, predict higher than CTEQ4D in the region . . The CC DIS cross section is dominated by the -quark contribution at high , as can be seen from (3) and (4). The possibility of a larger ratio than previously assumed has been of interest in recent years, for example see [34, 38]. Modification [34] of PDFs with an additional term (; see Sect. 8) yields close to the NLO QCD fit as shown in Fig. 5(b). For comparison, the prediction of the MRST [39] PDFs is also shown in Fig. 5(b).
9.2 Double differential cross section
The double differential cross section is compiled11footnotemark: 1 in Table 4. The reduced double differential cross section, , is defined from the CC cross section as
| (14) |
The reduced cross sections as functions of and are displayed in Figs. 7 and 8. The predictions of the CTEQ4D PDFs give a good description of the data, although at the highest value the measured cross sections lie above the predictions. The predictions from the NLO QCD fit at high are higher than those from CTEQ4D.
In leading-order QCD, depends on the quark momentum distributions as follows
| (15) |
As a result, for fixed , at low (i.e. high ) is mainly sensitive to the antiquark combination while at high (i.e. low ) it is dominated by the quark combination . These PDF combinations evaluated with the leading-order CTEQ4L parameterization are shown separately in Fig. 7. Both the quark and the antiquark combinations are required in order to obtain a good description of the data.
9.3 Comparison of NC and CC cross sections
Fig. 9 compares the cross section for CC scattering with the ZEUS result for NC scattering [6]. At low , the CC cross section is much smaller than the NC cross section due to the relative strength of the weak force compared to the electromagnetic force. However, the CC cross section decreases with less rapidly than that for NC scattering, reflecting the behavior of the propagator as contrasted to the photon propagator which dominates NC scattering. At , the CC and NC cross sections become comparable; at these large , the weak and electromagnetic forces are of similar strengths. At yet higher , the rapid fall of both CC and NC cross sections with is due to the effects of the and propagators, the decrease of the parton densities with increasing , and, in particular for CC scattering, the term in the cross section. These observations were made in previous HERA measurements [2, 3]; here they are clearly demonstrated with a much improved precision.
10 Electroweak analysis
The absolute magnitude of the CC cross section, described by (2), is determined by the Fermi constant and the PDFs, while the dependence of the CC cross section includes the propagator term , which produces substantial damping of the cross section at high . To compare the experimental results with the predictions of the Standard Model, a fit to the measured differential cross section, , has been performed, treating and as free parameters purely for the purpose of this exercise. The result of this fit is
| (16) |
and
| (17) |
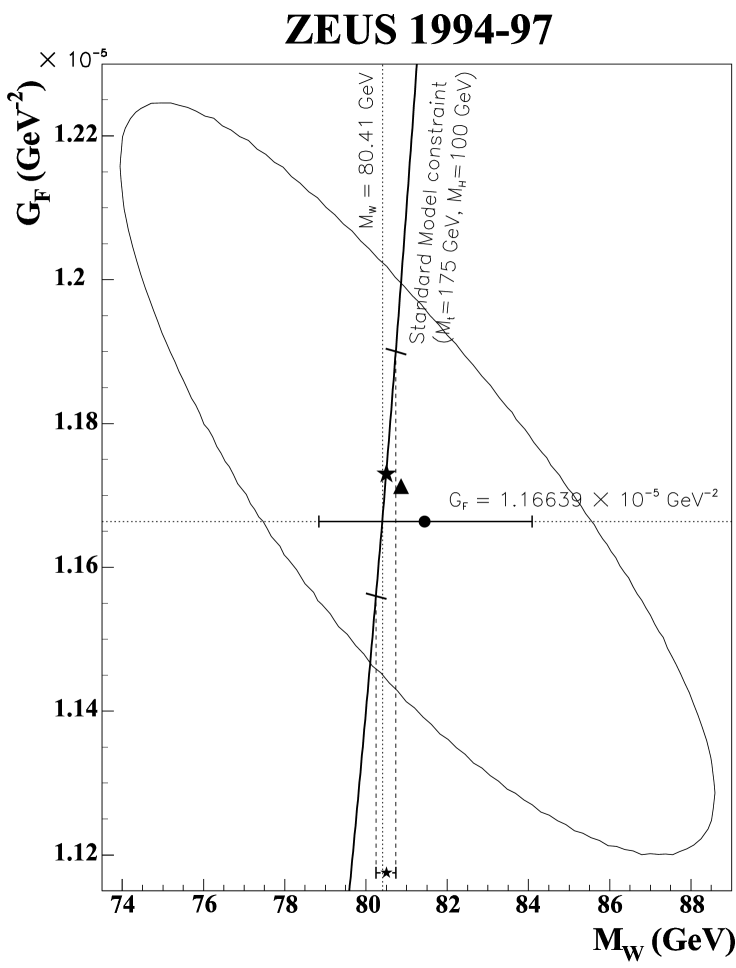
The central values are obtained using the CTEQ4D PDFs. The major sources of systematic uncertainty in the determination of the cross section, namely the energy scale, the parton shower scheme and the luminosity, are taken into account in the systematic errors. The PDF errors quoted are obtained by re-evaluating the PDFs within the uncertainties given by the NLO QCD fit [11]. The sensitivity of the result to variation of the value of assumed in the extraction of the PDFs is negligible compared to the uncertainties quoted above. The point which gives minimum () is displayed in Fig. 10 as the triangle together with the 70% confidence level contour. This contour was determined using statistical errors only. The value of obtained is in good agreement with the value GeV-2 obtained from muon decay [10], implying the universality of the CC interaction over a wide range of . The value of obtained agrees with the value of GeV from the PDG fit [10], using time-like production of bosons at the Tevatron and at LEP. Since CC DIS represents space-like exchange, the result (17) is complementary to measurements of from or annihilation. This result constitutes an important experimental consistency check of the Standard Model.
Two more fits are performed to determine under more restrictive theoretical assumptions. First, by evaluating the function along the line , a measurement of the ‘propagator mass’ of the exchanged boson can be made. The determination of the propagator mass is an important test of the SM description of the CC in the space-like regime. Second, a ‘Standard Model fit’ may be performed by evaluating the function along the SM constraint
| (18) |
where is the mass of the boson and is the fine structure constant. The term contains the radiative corrections to the lowest order expression for and is a function of and the masses of the fundamental bosons and fermions [40]. The constraint implied by (18) on and is also shown in Fig. 10 as the heavy solid line. As can be seen from the plot, the value of has a strong dependence on . Therefore, within the context of the SM, the greatest sensitivity to in this experiment may be obtained by combining the dependence of the propagator term in the CC cross section with the dependence of .
The ‘propagator-mass’ fit to the measured differential cross section, , with fixed to the value GeV-2 yields the result
| (19) |
shown in Fig. 10 as the solid dot with horizontal error bars. The use of the constraint has significantly reduced the uncertainty on the estimation of compared to the value obtained in the unconstrained fit (17). The result is in agreement with the value of obtained by direct measurement, GeV [10].
In order to use the SM constraint (18), , , and all fermion masses, other than the mass of the top quark, , are set to the PDG values [10]. The central result of the fit was obtained with GeV and the mass of the Higgs boson GeV. The function is evaluated along the line given by the SM constraint and the position of the minimum, shown in Fig. 10 as the large star, gives the ‘Standard Model fit’ result333It should be clearly understood that (20) represents a constrained fit using assumptions on the validity of the Standard Model which implies that the result cannot be used in a global average of experimental values of .
| (20) |
The error labeled is obtained by re-evaluating with in the range GeV, in the range GeV and in the range GeV. The dependence of on these changes is small, and the resulting error is negligible compared with the other errors quoted above. This result is in agreement with the value of GeV obtained in fixed-target neutrino-nucleon DIS [41]. The good agreement with both direct and indirect determinations of indicates that the SM gives a consistent description of a variety of phenomena over a wide range of energy scales.
11 Summary
Charged-current deep inelastic scattering, , has been measured with the ZEUS detector at HERA using 47.7 pb-1 of data collected during 1994 – 1997. Single differential cross sections , and have been presented with typical uncertainties of 7 – 20%. The cross section falls by a factor of about 50000 as increases from 280 to 30000 GeV2. The double differential cross section has also been measured. A comparison between the data and Standard Model (SM) predictions shows clearly that contributions from antiquarks ( and ) and quarks ( and ) are both required by the data. The predictions of the SM, using recent parton distribution functions, give a good description of the full body of the data presented in this paper.
The charged-current (CC) cross-section results for presented here have been compared with the recent ZEUS results for neutral-current (NC) scattering. The CC cross section is found to fall with less rapidly and to approach the NC cross section at , in agreement with previous observations at HERA. This shows that the weak and electromagnetic forces reach similar strengths for above .
A fit to the data for with the Fermi constant and as independent parameters yields
A propagator fit, with fixed to the PDG value [10], yields
These results show that the SM gives a consistent description of charged-current induced time-like and space-like processes over a wide range of virtualities.
Acknowledgements
We appreciate the contributions to the construction and maintenance of the ZEUS detector of the many people who are not listed as authors. The HERA machine group and the DESY computing staff are especially acknowledged for their success in providing excellent operation of the collider and the data analysis environment. We thank the DESY directorate for their strong support and encouragement.
References
-
[1]
H1 Collab., T. Ahmed et al., Phys. Lett. B324 (1994)241;
H1 Collab., S. Aid et al., Z. Phys. C67 (1995) 565. - [2] H1 Collab., S. Aid et al., Phys. Lett. B379 (1996) 319.
- [3] ZEUS Collab., M. Derrick et al., Phys. Rev. Lett. 75 (1995) 1006.
- [4] ZEUS Collab., M. Derrick et al., Z. Phys. C72 (1996) 47.
-
[5]
CDHS Collab., H. Abramowicz et al., Z. Phys. C25 (1984) 29;
CDHSW Collab., J.P. Berge et al., Z. Phys. C49 (1991) 187;
CCFR Collab., E. Oltman et al., Z. Phys. C53 (1992) 51;
BEBC Collab., G.T. Jones et al., Z. Phys. C62 (1994) 575. - [6] ZEUS Collab., J. Breitweg et al., DESY-99-056, submitted to Eur. Phys. J.
-
[7]
G. Ingelman and R. Rückl, Phys. Lett. B201 (1988) 369;
A.M. Cooper-Sarkar, R. Devenish and A. de Roeck, Int’l J. Mod. Phys. A13 (1998) 3385. - [8] U. Katz, Deep-Inelastic Positron-Proton Scattering in the High Momentum-Transfer Regime of HERA, Springer Tracts in Modern Physics (1999) (to be published).
-
[9]
A. Kwiatkowski, H. Spiesberger and
H.-J. Möhring, Comp. Phys. Commun. 69 (1992) 155;
H. Spiesberger, heracles – An Event Generator
for Interactions at HERA Including Radiative Processes
(Version 4.6), 1996, available on WWW:
http://www.desy.de/~hspiesb/heracles.html. - [10] Particle Data Group, C. Caso et al., Eur. Phys. J. C3 (1998) 1.
- [11] M. Botje, DESY 99-038, NIKHEF-99-011.
- [12] ZEUS Collab., The ZEUS Detector, Status Report 1993, DESY 1993.
-
[13]
N. Harnew et al., Nucl. Instrum. Methods A279 (1989) 290;
B. Foster et al., Nucl. Phys. (Proc. Suppl.) B32 (1993) 181;
B. Foster et al., Nucl. Instrum. Methods A338 (1994) 254. -
[14]
M. Derrick et al., Nucl. Instrum. Methods A309 (1991) 77;
A. Andresen et al., Nucl. Instrum. Methods A309 (1991) 101;
A. Bernstein et al., Nucl. Instrum. Methods A336 (1993) 23. - [15] ZEUS Collab., M. Derrick et al., Phys. Lett. B316 (1993) 412.
- [16] H. Abramowicz et al., Nucl. Instrum. Methods A313 (1992) 126.
- [17] G. Abbiendi et al., Nucl. Instrum. Methods A333 (1993) 342.
-
[18]
J. Andruszków et al., DESY 92-066 (1992).
ZEUS Collab., M. Derrick et al., Z. Phys. C63 (1994) 391. - [19] R. Brun et al., CERN-DD/EE/84-1 (1987).
-
[20]
K. Charchuła, G.A. Schuler and H. Spiesberger,
Comp. Phys. Commun. 81 (1994) 381;
H. Spiesberger, django6 version 2.4 – A Monte Carlo
Generator for Deep Inelastic Lepton Proton Scattering Including
QED and QCD Radiative Effects, 1996, available on WWW:
http://www.desy.de/~hspiesb/django6.html. - [21] L. Lönnblad, Comp. Phys. Commun. 71 (1992) 15.
- [22] G. Ingelman, A. Edin and J. Rathsman, Comp. Phys. Commun. 101 (1997) 108.
-
[23]
T. Sjöstrand,
Comp. Phys. Commun. 39 (1986) 347;
T. Sjöstrand and M. Bengtsson, Comp. Phys. Commun. 43 (1987) 367;
T. Sjöstrand, Comp. Phys. Commun. 82 (1994) 74. - [24] G. Marchesini et al., Comp. Phys. Commun. 67 (1992) 465.
- [25] U. Baur, J.A.M. Vermaseren and D. Zeppenfeld, Nucl. Phys. B375 (1992) 3.
- [26] J.A.M. Vermaseren, Nucl. Phys. B229 (1983) 347.
- [27] F. Jacquet and A. Blondel, Proc. of the Study for an Facility for Europe, DESY 79-48 (1979) 391.
- [28] W.H. Smith et al., Nucl. Instrum. Methods A355 (1995) 278.
- [29] H. Abramowicz, A. Caldwell and R. Sinkus, Nucl. Instum. Methods A365 (1995) 508.
- [30] H.L. Lai et al., Phys. Rev. D55 (1997), 1280.
- [31] H. Spiesberger, private communication.
- [32] A.D. Martin, R.G. Roberts and W.J. Stirling, Phys. Rev. D51 (1995) 4756.
- [33] M. Glück, E. Reya and A. Vogt, Z. Phys. C67 (1995) 433.
- [34] U.K. Yang and A. Bodek, Phys. Rev. Lett. 82 (1999) 2467.
- [35] A. Arbuzov et al., Comp. Phys. Commun. 94 (1996) 128.
- [36] A.M. Cooper-Sarkar et al., hep-ph/9902277, submitted to J. Phys. G. and references 38, 39 and 40 therein.
- [37] H.L. Lai et al., preprint MSU-HEP-903100 and hep-ph/9903282v2 (1999).
-
[38]
W. Melnitchouk and A.W. Thomas, Phys. Lett. B377 (1996) 11;
W. Melnitchouk and J.C. Peng, Phys. Lett. B400 (1997) 220. - [39] A.D. Martin, R.G. Roberts, W.J. Stirling and R.S. Thorne, Eur. Phys. J. C4 (1998) 463.
-
[40]
D. Bardin et al, Z. Phys. C44 (1989) 149;
M. Böhm and H. Spiesberger, Nucl. Phys. B304 (1988) 749;
W.F.L. Hollik, Fortsch. Phys. 38 (1990) 165;
H. Spiesberger, Nucl. Phys. B349 (1991) 109;
H. Spiesberger, in Proc. of the Workshop “Future Physics at HERA”, vol. 1,
Eds. G. Ingelman, A. De Roeck and R. Klanner, DESY (1996) 227. - [41] CCFR/NuTeV Collab., K.S. McFarland et al., Eur. Phys. J. C1 (1998) 509.
| range | (pb/GeV2) | ||||||||||
|---|---|---|---|---|---|---|---|---|---|---|---|
| (GeV2) | (GeV2) | measured | SM | ||||||||
| 200 – | 400 | 280 | 141 | 16.5 | 0.46 | 1.01 | |||||
| 400 – | 711 | 530 | 173 | 5.3 | 0.64 | 1.01 | |||||
| 711 – | 1265 | 950 | 248 | 2.3 | 0.74 | 1.01 | |||||
| 1265 – | 2249 | 1700 | 205 | 2.3 | 0.79 | 1.03 | |||||
| 2249 – | 4000 | 3000 | 169 | 2.4 | 0.81 | 1.04 | |||||
| 4000 – | 7113 | 5300 | 91 | 0.6 | 0.82 | 1.05 | |||||
| 7113 – | 12649 | 9500 | 45 | 0.7 | 0.86 | 1.07 | |||||
| 12649 – | 22494 | 17000 | 13 | 0.1 | 0.96 | 1.07 | |||||
| 22494 – | 60000 | 30000 | 1 | 0.01 | 1.48 | 1.09 | |||||
| range | (pb) | ||||||||||
|---|---|---|---|---|---|---|---|---|---|---|---|
| measured | SM | ||||||||||
| 0.0100 – | 0.0215 | 0.015 | 136 | 4.0 | 0.56 | 1.04 | |||||
| 0.0215 – | 0.0464 | 0.032 | 246 | 7.4 | 0.79 | 1.02 | |||||
| 0.0464 – | 0.1000 | 0.068 | 306 | 10.0 | 0.85 | 1.02 | |||||
| 0.1000 – | 0.1780 | 0.130 | 200 | 2.9 | 0.82 | 1.01 | |||||
| 0.1780 – | 0.3160 | 0.240 | 124 | 0.6 | 0.73 | 1.01 | |||||
| 0.3160 – | 0.5620 | 0.420 | 46 | 0.06 | 0.56 | 1.00 | |||||
| 0.5620 – | 1.0000 | 0.650 | 3 | 0.00 | 0.36 | 1.02 | |||||
| range | (pb) | ||||||||||
|---|---|---|---|---|---|---|---|---|---|---|---|
| measured | SM | ||||||||||
| 0.00 – | 0.10 | 0.05 | 192 | 7.3 | 0.64 | 0.98 | |||||
| 0.10 – | 0.20 | 0.15 | 249 | 5.2 | 0.85 | 0.99 | |||||
| 0.20 – | 0.34 | 0.27 | 240 | 2.6 | 0.83 | 1.01 | |||||
| 0.34 – | 0.48 | 0.41 | 185 | 5.0 | 0.78 | 1.03 | |||||
| 0.48 – | 0.62 | 0.55 | 117 | 3.8 | 0.70 | 1.05 | |||||
| 0.62 – | 0.76 | 0.69 | 61 | 2.1 | 0.60 | 1.07 | |||||
| 0.76 – | 0.90 | 0.83 | 42 | 1.1 | 0.44 | 1.10 | |||||
| range | range | (pb/GeV2) | ||||||||||||
|---|---|---|---|---|---|---|---|---|---|---|---|---|---|---|
| (GeV2) | (GeV2) | measured | SM | |||||||||||
| 200 – | 400 | 0.0100 – | 0.0215 | 280 | 0.015 | 50 | 2.0 | 0.64 | 1.00 | |||||
| 0.0215 – | 0.0464 | 0.032 | 42 | 4.7 | 0.80 | 0.99 | ||||||||
| 0.0464 – | 0.1000 | 0.068 | 28 | 5.9 | 0.71 | 0.97 | ||||||||
| 400 – | 711 | 0.0100 – | 0.0215 | 530 | 0.015 | 42 | 1.6 | 0.64 | 1.02 | |||||
| 0.0215 – | 0.0464 | 0.032 | 52 | 0.8 | 0.87 | 0.99 | ||||||||
| 0.0464 – | 0.1000 | 0.068 | 44 | 1.0 | 0.86 | 0.98 | ||||||||
| 0.1000 – | 0.1780 | 0.130 | 21 | 0.5 | 0.77 | 0.98 | ||||||||
| 711 – | 1265 | 0.0100 – | 0.0215 | 950 | 0.015 | 37 | 0.3 | 0.50 | 1.06 | |||||
| 0.0215 – | 0.0464 | 0.032 | 85 | 0.4 | 0.88 | 1.01 | ||||||||
| 0.0464 – | 0.1000 | 0.068 | 69 | 0.5 | 0.89 | 0.99 | ||||||||
| 0.1000 – | 0.1780 | 0.130 | 43 | 0.2 | 0.84 | 0.98 | ||||||||
| 0.1780 – | 0.3160 | 0.240 | 14 | 0.0 | 0.66 | 0.99 | ||||||||
| 1265 – | 2249 | 0.0215 – | 0.0464 | 1700 | 0.032 | 58 | 0.9 | 0.77 | 1.05 | |||||
| 0.0464 – | 0.1000 | 0.068 | 66 | 1.1 | 0.91 | 1.02 | ||||||||
| 0.1000 – | 0.1780 | 0.130 | 40 | 0.3 | 0.89 | 1.00 | ||||||||
| 0.1780 – | 0.3160 | 0.240 | 28 | 0.3 | 0.83 | 1.00 | ||||||||
| range | range | (pb/GeV2) | ||||||||||||
|---|---|---|---|---|---|---|---|---|---|---|---|---|---|---|
| (GeV2) | (GeV2) | measured | SM | |||||||||||
| 2249 – | 4000 | 0.0464 – | 0.1000 | 3000 | 0.068 | 76 | 1.1 | 0.88 | 1.06 | |||||
| 0.1000 – | 0.1780 | 0.130 | 42 | 0.2 | 0.89 | 1.03 | ||||||||
| 0.1780 – | 0.3160 | 0.240 | 27 | 0.1 | 0.86 | 1.01 | ||||||||
| 0.3160 – | 0.5620 | 0.420 | 15 | 0.0 | 0.75 | 1.00 | ||||||||
| 4000 – | 7113 | 0.0464 – | 0.1000 | 5300 | 0.068 | 22 | 0.4 | 0.69 | 1.07 | |||||
| 0.1000 – | 0.1780 | 0.130 | 35 | 0.2 | 0.92 | 1.04 | ||||||||
| 0.1780 – | 0.3160 | 0.240 | 26 | 0.1 | 0.89 | 1.03 | ||||||||
| 0.3160 – | 0.5620 | 0.420 | 8 | 0.0 | 0.84 | 1.04 | ||||||||
| 7113 – | 12649 | 0.1000 – | 0.1780 | 9500 | 0.130 | 15 | 0.6 | 0.84 | 1.08 | |||||
| 0.1780 – | 0.3160 | 0.240 | 18 | 0.1 | 0.94 | 1.05 | ||||||||
| 0.3160 – | 0.5620 | 0.420 | 10 | 0.0 | 0.90 | 1.05 | ||||||||
| 12649 – | 22494 | 0.1780 – | 0.3160 | 17000 | 0.240 | 5 | 0.1 | 1.04 | 1.07 | |||||
| 0.3160 – | 0.5620 | 0.420 | 7 | 0.0 | 1.03 | 1.06 | ||||||||
| (pb/GeV2) | (%) | (%) | (%) | (%) | (%) | (%) | |
|---|---|---|---|---|---|---|---|
| 280 | |||||||
| 530 | |||||||
| 950 | |||||||
| 1700 | |||||||
| 3000 | |||||||
| 5300 | |||||||
| 9500 | |||||||
| 17000 | |||||||
| 30000 | |||||||
| (pb) | (%) | (%) | (%) | (%) | (%) | (%) | |
| 0.015 | |||||||
| 0.032 | |||||||
| 0.068 | |||||||
| 0.130 | |||||||
| 0.240 | |||||||
| 0.420 | |||||||
| 0.650 | |||||||
| (pb) | (%) | (%) | (%) | (%) | (%) | (%) | |
| 0.05 | |||||||
| 0.15 | |||||||
| 0.27 | |||||||
| 0.41 | |||||||
| 0.55 | |||||||
| 0.69 | |||||||
| 0.83 | |||||||
| (GeV2) | (pb/GeV2) | (%) | (%) | (%) | (%) | (%) | (%) | |
|---|---|---|---|---|---|---|---|---|
| 280 | 0.015 | |||||||
| 280 | 0.032 | |||||||
| 280 | 0.068 | |||||||
| 530 | 0.015 | |||||||
| 530 | 0.032 | |||||||
| 530 | 0.068 | |||||||
| 530 | 0.130 | |||||||
| 950 | 0.015 | |||||||
| 950 | 0.032 | |||||||
| 950 | 0.068 | |||||||
| 950 | 0.130 | |||||||
| 950 | 0.240 | |||||||
| 1700 | 0.032 | |||||||
| 1700 | 0.068 | |||||||
| 1700 | 0.130 | |||||||
| 1700 | 0.240 |
| (GeV2) | (pb/GeV2) | (%) | (%) | (%) | (%) | (%) | (%) | |
|---|---|---|---|---|---|---|---|---|
| 3000 | 0.068 | |||||||
| 3000 | 0.130 | |||||||
| 3000 | 0.240 | |||||||
| 3000 | 0.420 | |||||||
| 5300 | 0.068 | |||||||
| 5300 | 0.130 | |||||||
| 5300 | 0.240 | |||||||
| 5300 | 0.420 | |||||||
| 9500 | 0.130 | |||||||
| 9500 | 0.240 | |||||||
| 9500 | 0.420 | |||||||
| 17000 | 0.240 | |||||||
| 17000 | 0.420 |