Upper limit on the decay
Abstract
The search for CP-violating decay was performed with SND detector
at VEPP-2M collider. The total amount of data
corresponding to 7 million produced mesons was analyzed.
No candidate events were found, giving an upper limit of the decay branching
ratio:
at 90%
confidence level.
PACS: 13.25.Es; 11.30.Er; 13.65.+i; 13.75.-n; 14.40.Aq
Keywords: collisions; kaon decays; CP-violation; upper limit
Introduction
At present CP-violation is observed only in the and decays, and first indication of the effect in B-decays was recently reported [1]. Another possible domain for CP-violation studies are still unseeing and decays, of which the latter must be a pure CP-violating process [2], because for three neutral pions only CP-odd states exist. CP-violation in the decay can be parameterized in terms of parameter, which is defined as:
One can estimate the decay branching ratio [2]: . The lowest existing experimental upper limit of was reported by CPLEAR collaboration [3]. In this paper results of the study of the decay with the SND detector are presented.
Detector and experiment
The experiment was performed in 1996–1998 at VEPP-2M collider with SND detector [4]. The SND is a general purpose nonmagnetic detector. Its main part is a spherical electromagnetic calorimeter, consisting of 1632 NaI(Tl) crystals. The calorimeter energy resolution for photons is , the angular resolution is and solid angle coverage is close to of steradian [5].
Presented analysis is based on experimental data collected in the center-of-mass energy region 980–1040 , with most of the data, taken in the close vicinity of the peak. The decays were used as a source of mesons. Experimental data corresponds to about produced mesons or decays.
Event selection
The search for the decay was performed using the process
| (1) |
In this process the having momentum of about and decay length of may either produce signals in the detector due to nuclear interaction in the calorimeter or decay in flight, or it can punch through the detector unseen. The detection efficiency of mesons in the calorimeter material was studied in the process
| (2) |
With the probability of the produces a single cluster of hit crystals in the calorimeter, and with the probability — more than one cluster. The clusters produced by mesons are interpreted as “photons” by event reconstruction program. The rest of mesons produce no signal in the calorimeter.
Events with 6 or 7 reconstructed photons were used in the search for decay. In order to reject background caused by stray particles from the accelerator and cosmic events, constraints were imposed on total energy deposition () and total momentum of events (), where is a beam energy. To suppress cosmic background even further, the events, where the most of hit crystals could be fitted by a single straight track, were rejected. Due to worse energy resolution near the calorimeter edges the polar angle of all reconstructed photons was limited to .
Remaining background comes mainly from two processes:
| (3) |
and from (2) with producing extra 2 or 3 “photons” due to nuclear interaction or decay.
Kinematic fitting based on -method was performed for the events satisfying selection criteria described above. For each event two hypotheses were checked:
-
-
: an event is due to the process (1), i.e. there are 3 -s from decay in the event;
-
-
: an event is due to the process (2), i.e. it contains 2 -s from decay.
As result of kinematic fitting the following parameters were evaluated:
-
-
and — the chi-square values for the two hypotheses;
-
-
and — the momentum of reconstructed ;
-
-
and — the polar angle of reconstructed ;
-
-
and — raw invariant masses of photon pairs, attributed to pions during kinematic fitting.
In order to isolate events of the process (1), the following cuts were applied:
As a result significant part of background events of the processes (3) and (2) was rejected. The total of 19 6-photon and 15 7-photon events survived the cuts.
The process (2) was used as a reference for the detection efficiency monitoring. The events with 4 and 5 reconstructed photons were selected using the same primary cuts as for the process (1). After kinematic fitting the following additional cuts were applied:
The and distributions for experimental and simulated events of the process (2) are shown in Fig. 2 and Fig. 2.
Analysis of the events with detected
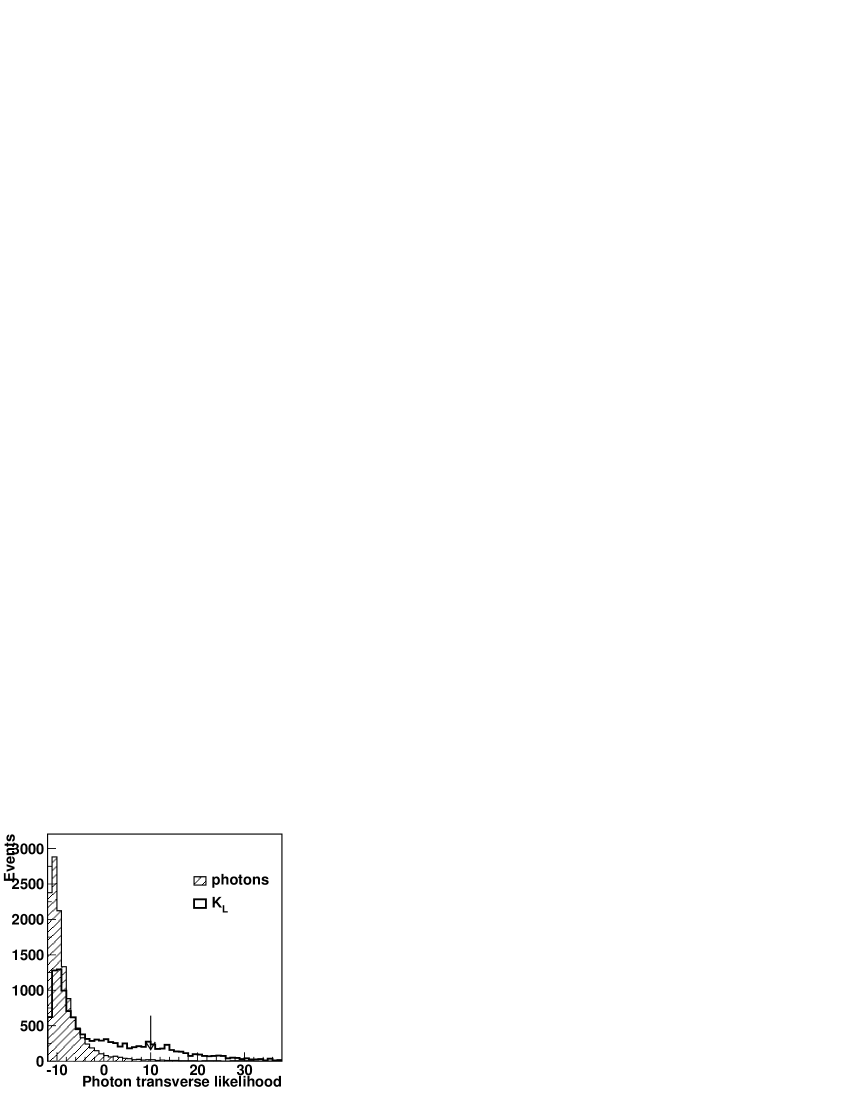
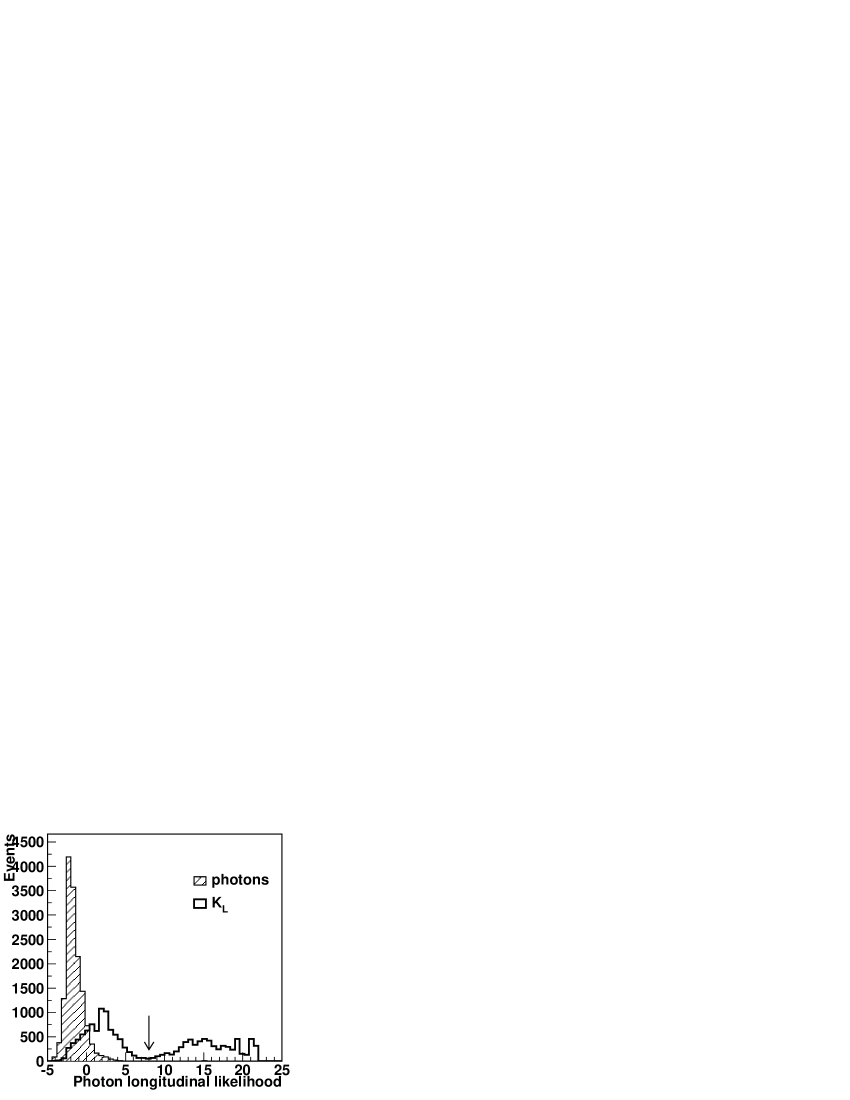
In the events of the process (1) with 7 reconstructed photons, one of the photons must be in fact a meson, thus additional cuts on its parameters can be imposed. In the analysis it was required that energy deposition of cluster is at least , and spatial angle between the cluster and reconstructed direction is more than degrees. The following cuts were based on specific for profiles of energy deposition in the calorimeter. The parameters and were introduced to quantitatively describe the differences between the energy deposition profiles for photons and mesons. The parameter [7] represents the likelihood of a hypothesis that the transverse profile of energy deposition in a cluster was produced by a single photon. The parameter has the same meaning, but for the longitudinal profile. Both parameters were studied in the process (2), their distributions are shown in Figs. 4 and 4. The figures show that the requirement of either or reliably identifies meson. The same requirement was applied to meson in 5-photon events of the reference process (2).
As a result the number of selected events was for the process (1) and for the process (2). The detection efficiencies and for the processes (1) and (2) were calculated by Monte Carlo simulation using UNIMOD2 package [8]. The branching ratio of the decay was calculated as follows:
| (4) |
An upper limit was obtained at confidence level:
The analysis of events with undetected
In 6-photon (1) candidates all detected particle must be photons. Thus the remaining (2) background can be suppressed by the following cuts on and : and for all six particles. It was required also that raw invariant masses of photon pairs, reconstructed as pions are restricted to the range . The same cuts were used in parallel analysis of 4-photon events of the reference process (2). The detection efficiencies of processes (1) and (2) were obtained by Monte Carlo simulation to be and respectively. events of the process (1) and events of process (2) survived the cuts. The upper limit at the confidence level of is:
Combined analysis
By using the following relation between numbers of found events of the processes (1) and (2):
| (5) |
the results of both analyses can be combined:
| (6) |
The resulting upper limit according to Eq.(6) amounts to
at the confidence level of .
The systematic error of the detection efficiency is determined mainly by imprecise simulation of nuclear interaction. Its estimated value is . Since the (1) branching ratio depends on the ratio of the detection efficiencies for the processes (1) and (2), the common systematic error in the simulation cancels. The remaining systematic error in the efficiency ratio is determined mainly by the accuracy of simulation of electromagnetic showers. In order to estimate this error, the process (3) was studied with the cuts similar to those in the analysis of process (1). Resulting branching ratio of is lower than its world averaged value [9]. This difference was taken as an estimate of the systematic error of the ratio of the detection efficiencies. The final result for the upper limit is then:
Conclusion
The experiment was performed with SND detector at VEPP-2M collider. The total statistics of mesons was analyzed. As a result, no candidate events of the decay were found. The upper limit of the branching ratio of at the confidence level of was placed.
Acknowledgement
This work is supported in part by The Russian Fund for Basic Researches (grant 96-15-96327) and STP “Integration” (No.274).
References
- [1] Manfred Paulini, B Lifetimes, Mixing and CP Violation at CDF, Fermilab-Pub-99/014-E, hep-ex/9903002.
- [2] L.Maiani and N.Paver, The second DANE physics handbook, vol.I (1995), p. 51.
- [3] CPLEAR collaboration, Phys. Lett. B 425 (1998) pp.391-398.
- [4] M.N.Achasov et al., Experiments at VEPP-2M with SND detector, preprint BINP 98-65, (1998).
- [5] M.N.Aulchenko et al., Spherical nonmagnetic detector (SND) for electron-positron collider VEPP-2M, preprint BINP 99-16, (1999), in Russian.
- [6] V.M.Aulchenko et al., Proc. Workshop on Physics and Detectors for DANE, Frascati, Italy, April 9-12 (1991), p.605.
- [7] A.V.Bozhenok, V.N.Ivanchenko, Z.K.Silagadze, Transverse energy profile of electromagnetic shower, Nucl. Inst. and Meth., A379 (1996) pp.507-508.
- [8] A.D.Bukin et al., in Proc. Workshop on Detector and Event Simulation in High Energy Physics, The Netherlands, Amsterdam, 8-12 April 1991, NIKHEF, p.79.
- [9] C.Caso et al. (Particle Data Group) Europ. Phys. Jour. C 3 1 (1998).
Figure captions
-
1.
The distribution of of kinematic fit for events. The histogram represents the simulation, points — experimental data.
-
2.
The distribution of the momentum of reconstructed meson in events. The histogram represents the simulation, points — data.
-
3.
The distributions for photons (clear histogram) and for mesons (shaded histogram) in the process (2).
-
4.
The distributions for photons (clear histogram) and mesons (shaded histogram) in the process (2).