Study of the radiative decay with CMD-2 detector
R.R.Akhmetshin, E.V.Anashkin, V.S.Banzarov, L.M.Barkov, N.S.Bashtovoy, A.E.Bondar, D.V.Bondarev, D.V.Chernyak, S.I.Eidelman, G.V.Fedotovich, N.I.Gabyshev, A.A.Grebeniuk, D.N.Grigoriev, P.M.Ivanov, V.F.Kazanin, B.I.Khazin, I.A.Koop, P.P.Krokovny, L.M.Kurdadze, A.S.Kuzmin, I.B.Logashenko, P.A.Lukin, A.P.Lysenko, K.Yu.Mikhailov, V.S.Okhapkin, T.A.Purlatz, N.I.Root, A.A.Ruban, N.M.Ryskulov, A.G. Shamov, Yu.M.Shatunov, B.A.Shwartz, V.A.Sidorov, A.N.Skrinsky, V.P.Smakhtin, I.G.Snopkov, E.P.Solodov, P.Yu.Stepanov, A.I.Sukhanov, Yu.V.Yudin, S.G.Zverev
Budker Institute of Nuclear Physics, Novosibirsk, 630090, Russia
B.L.Roberts
Boston University, Boston, MA 02215, USA
J.A.Thompson
University of Pittsburgh, Pittsburgh, PA 15260, USA
V.W.Hughes
Yale University, New Haven, CT 06511, USA
Using the of data collected with the CMD-2 detector at VEPP-2M the decay mode , has been studied. The obtained branching ratio is B(.
1 Introduction
Radiative transitions between vector and pseudoscalar mesons are very interesting for tests of the quark model, SU(3) symmetry and Vector Dominance Model [1]. Recently there were extensive discussions concerning mechanisms of SU(3) breaking, the role of anomalies and a possible admixture of glue in mesons in radiative decays [2, 3, 4, 5, 6, 7, 8]. Despite numerous experimental efforts, many open questions still exist requiring more precise measurements of the decay probabilities.
The radiative magnetic dipole transition of into has been previously studied in many experiments [9] based on the neutral final states arising when decays into or . In this work, using the general purpose CMD-2 detector at the high luminosity Novosibirsk collider VEPP-2M, the decay rate into the charged-neutral final state was measured: . The study is based on a data sample of about corresponding to 3.5 million meson decays collected in 1996 with CMD-2.
2 Experiment
The CMD-2 detector is described in detail elsewhere [10, 11, 12]. It is an axial field detector consisting of a drift chamber with about 250 resolution transverse to the beam and proportional Z-chamber used for trigger, both inside a thin (0.4 ) superconducting solenoid with a field of 1 T.
The barrel calorimeter placed outside of the solenoid consists of 892 CsI crystals of cm3 size and covers polar angles from to . The energy resolution for photons in the CsI calorimeter is about 9% in the energy range from 50 to 600 MeV.
The BGO () end-cap calorimeter consists of two identical end-caps and covers forward-backward angles from 16∘ to 49∘ and from 131∘ to 164∘. It is placed inside the main solenoid in the gap between the drift chamber and the flux return yoke and operates in a 1 T longitudinal magnetic field. Each end-cap is a compact matrix of rectangular BGO crystals of cm3 size. The thickness of the calorimeter for normally incident particles is equal to 13.4 . The calorimeter consists of 680 BGO crystals with a total weight of about 450 kg. The light from each crystal is read out by vacuum phototriodes which can operate in magnetic fields up to 2 T. The energy and angular resolution of the end-cap calorimeter is equal to and radians respectively.
3 Selection criteria
Events with two tracks and more than one photon were selected using the following criteria:
-
•
One vertex is found in the event
-
•
Two tracks with opposite charges are reconstructed from this vertex and there are no other tracks
-
•
The angles of both tracks with respect to the beam are limited by to match the optimal drift chamber coverage
-
•
The number of photons detected in the CsI and BGO calorimeters is more than one and less than six. The cluster in the calorimeter was accepted as a photon when it did not match any charged track and its energy was more than 30 MeV in the CsI calorimeter (more than 40 MeV in the BGO calorimeter).
-
•
The distance from each track to the beam
-
•
The distance from the vertex to the interaction point along the beam direction
-
•
The space angle between the tracks to suppress events of ,
-
•
The angle between the tracks in the r- plane
-
•
The total energy of the charged particles (assuming that both are charged pions)
-
•
The energy deposition of the photon accepted as a recoil one is more than 250 MeV
The cut for the total energy is to reject events from the decay . From simple kinematical relations the total energy of charged pions from the is greater than 539 MeV while for it is less than 522 MeV.
4 Kinematics of
In this study the final state contains two charged particles and three photons.
Since is a two-body decay and is a narrow state, the energy of the recoil photon is given by
| (1) |
where is the beam energy, is the mass. The invariant mass of two other final photons is equal to . At the meson peak the energy of the recoil photon equals 363 MeV.
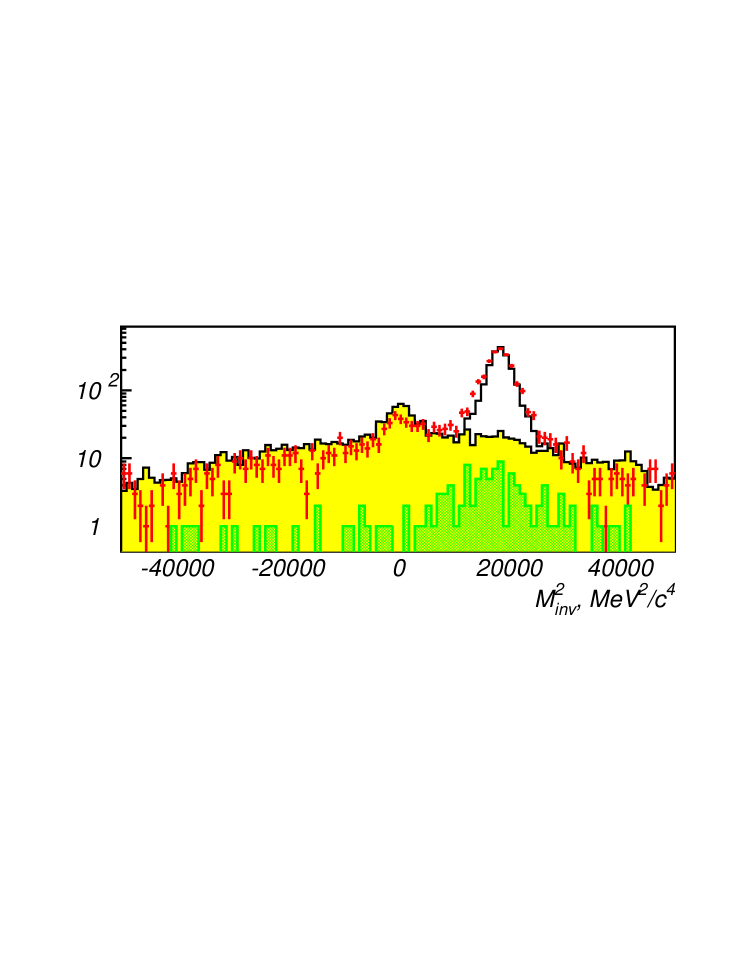
In this analysis detection of all final particles is not necessary. Instead, one requires the detection of both charged pions and at least one photon, the recoil one. Using the measured momenta of charged pions, angles and of the recoil photon and the assumption that the energy of the recoil photon is given by (1), one can reconstruct the invariant mass of all other photons in the system, . In case of the process this parameter .

The recoil photon has the largest energy among three photons in the final state. So, the simplest way would be to take a photon with the largest energy deposition in the calorimeter. In this study, however, we prefer not to use the energy deposition at all, relying instead on the position of the cluster (angles of photons). The Monte Carlo simulation of the decay mode studied in this work shows that the recoil photon prefers to fly opposite to the total momentum of charged pions in contrast to the photons from the decay (Fig. 1). Therefore the photon whose direction is closest to was selected as the recoil one.
5 Data Analysis

The distribution over the parameter for selected events is presented in Fig. 2. Events from the decay produce a peak near the mass squared. Other events surviving after all the cuts are coming from the following processes:
-
•
. For such events the value of should be obviously zero and a corresponding peak can be seen in Fig. 2.
-
•
-
•
. Most of the events from this decay are suppressed by the cut on the total energy of the charged particles , but some small fraction could survive.
-
•
-
•
beam background, the photon conversion at the vacuum tube
Simulation of the first three background processes used the GEANT based CMD-2 simulation code [14]. It is difficult to study two last sources of background using simulation, therefore their behaviour was studied with the help of experimental data using the selection instead of . Figure 3 presents the distribution over for simulated events of background processes after applying selection criteria. The fraction of each background process in the total number of simulated events corresponds to its cross section, the fraction of background with large distances from the beam has been also normalized. The sum of background distributions is shown by the hatched histogram in Fig. 3. The logarithmic scale was chosen for better demonstration of the background. The background simulation is in reasonable agreement with the data supporting our description of the background processes. sources is correct. The background from the decay (see the solid hatched histogram in Fig. 3) is rather small but unpleasant since its distribution for events surviving the selection has a maximum near that of the signal.
The number of events in the mode was determined by the following procedure:
-
•
The distribution over for each background process was fit by a smooth function to fix its shape.
-
•
The distribution over for all the data (Fig. 2) was fit by the sum of background functions excluding the signal region.
-
•
After that the function describing the shape of the signal was determined by the fit including the signal region and taking the sum of background functions with fixed parameters.
-
•
As a result of previous steps one had the functions describing the shape of signal and each background component. For each beam energy the number of events was determined by fitting the distribution over by the sum of these functions with the fixed shape and the number of events for signal and background processes as free parameters. For the background the detection efficiency was determined from the simulation and the number of events at each energy was calculated according to the energy dependence of the cross section of the reaction [15]. The total background of the decay mode is less than 2%.
The resulting number of events and the obtained cross section are presented in Table 1.
At each energy the cross section was calculated as
where is the integrated luminosity at this energy, is a radiative correction for the process , is the detection efficiency, = [9].
The radiative correction was calculated according to [16] and its behaviour in the -meson energy range is presented in Fig. 4.

The detection efficiency was determined using simulation of and the value was obtained. The systematic uncertainty of the efficiency was estimated by comparing results of the simulation of nuclear interactions by different methods (FLUKA and GHEISHA) [14]. For simulation of the decay instead of standard GEANT tools which assume a constant matrix element we used the following matrix element parametrisation from [17]
Here , ,
where and are the kinetic energies of the
and in the rest frame, and
. The parameter values were taken from recent
Crystal Barrel data [18].
The cross section of the process was parametrized by a sum of the -meson amplitude and an interfering term with the tails of the and resonances:
where , are the mass, width and peak cross section () for the -meson, and is a function describing the dynamics of the decay including the phase space.
| No. | |||||
|---|---|---|---|---|---|
| 1 | -0.21 | ||||
| 2 | -0.24 | ||||
| 3 | -0.25 | ||||
| 4 | -0.28 | ||||
| 5 | -0.28 | ||||
| 6 | -0.28 | ||||
| 7 | -0.27 | ||||
| 8 | -0.27 | ||||
| 9 | -0.26 | ||||
| 10 | -0.24 | ||||
| 11 | -0.22 | ||||
| 12 | -0.19 | ||||
| 13 | -0.17 | ||||
| 14 | -0.11 | ||||
| 15 | -0.04 | ||||
| 16 | 0.28 | ||||
| 17 | -0.01 | ||||
| 18 | -0.09 |
The energy dependence of the meson width was written as
where , , and are branching ratios of the meson decay into corresponding modes; , and for the calculation the model assuming the decay was used.
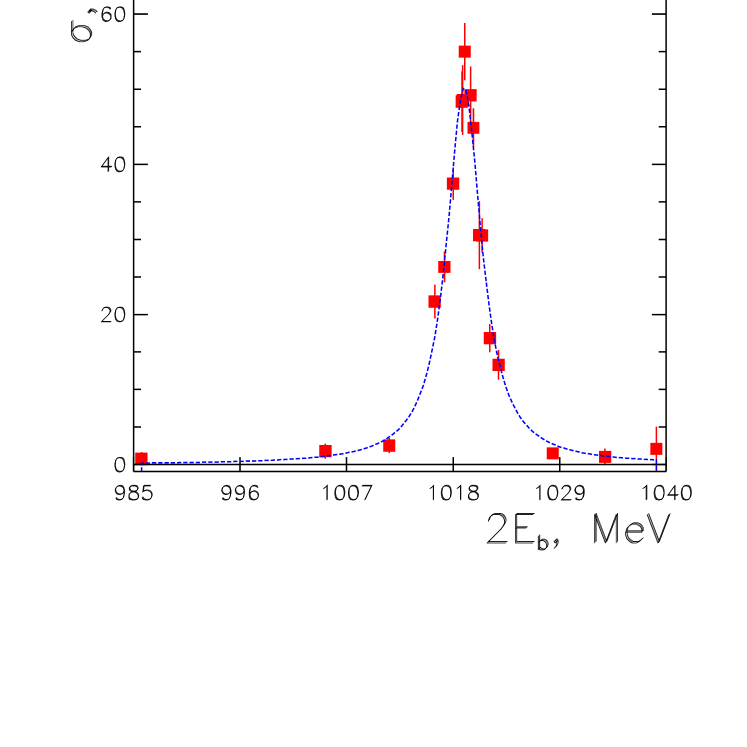
Fitting the energy dependence of the cross section of (Fig. 5) the meson mass and peak
cross section were determined, while was
fixed at the world average value [9].
The following results were obtained when the interfering term :
nb;
MeV;
.
If is calculated accurately taking into account the and meson contributions, the value of is changed by only 1%.
The systematic uncertainty of the peak cross section is estimated to be 4.8% and includes the following contributions:
-
•
luminosity determination (2%);
-
•
the uncertainty of the value of (2.2%);
-
•
determination of the detection efficiency (2.8%);
-
•
uncertainty of the background subtraction (2.5%)
The systematic uncertainty of the mass was estimated to be 80 keV from the difference in the c.m.energy obtained from two different methods of the beam energy determination (one used the momenta of charged kaons and the other was based on the analysis of the magnetic field of the collider [13]).
Taking the value from [9], one obtains the following value of the branching ratio corresponding to the peak cross section above:
where the first error is statistical and the second one is systematic. The latter includes contributions from the uncertainties of the peak cross section (4.8%) and that of (2.7%).
6 Conclusions
Using a data sample of about 3.5 million meson decays the CMD-2 collaboration studied the decay . About 2200 events of this decay have been selected. The meson mass was determined to be and agrees with other measurements [9]. The branching ratio of the decay was measured with high precision to be and is consistent with the world average value [9] as well as with another accurate determination of this quantity recently reported by the SND collaboration [19]. It is the first measurement of the decay rate using the charged mode of the meson decay. Analysis of a five times bigger data sample is in progress.
7 Acknowledgements
The authors are grateful to M.Benayoun, V.N.Ivanchenko and A.A.Salnikov for useful discussions.
References
- [1] P.J.O’Donnell, Rev. Mod. Phys. 53 (1981) 673.
- [2] M.Benayoun et al., Zeit. Phys. C65 (1995) 399.
- [3] A.Bramon, A.Grau and G.Pancheri, Phys. Lett. B344 (1995) 240.
- [4] M.Hashimoto, Phys. Rev. D54 (1996) 5611.
- [5] M.Benayoun, S.I.Eidelman and V.N.Ivanchenko, Zeit. Phys. C72 (1996) 221.
- [6] P.Ball, J.M.Frere, M.Tytgat, Phys. Lett. B365 (1996) 367.
- [7] A.Bramon, R.Escribano and M.D.Scadron, Eur. Phys. J. C7 (1999) 271.
- [8] M.Benayoun et al., Phys. Rev. D59 (1999) 114027.
- [9] C.Caso et al., Review of Particle Physics, Eur. Phys. J. C3 (1998) 1.
- [10] G.A.Aksenov et al., Preprint BudkerINP 85-118, Novosibirsk, 1985.
- [11] E.V.Anashkin et al., ICFA Instrumentation Bulletin 5 (1988) 18.
- [12] R.R.Akhmetshin et al., Preprint BudkerINP 95-35, Novosibirsk, 1995.
- [13] R.R.Akhmetshin et al., Preprint BudkerINP 99-11, Novosibirsk, 1999.
- [14] E.V.Anashkin et al., Preprint BudkerINP 99-1, Novosibirsk, 1999.
- [15] R.R.Akhmetshin et al., Phys. Lett. B434 (1998) 426.
- [16] E.A.Kuraev and V.S.Fadin, Sov. J. Nucl. Phys. 41 (1985) 466.
- [17] L.Montanet et al., Review of Particle Properties, Phys. Rev. D50 (1994) 1454.
- [18] A.Abele et al., Phys. Lett. B417 (1998) 197.
- [19] M.N.Achasov et al., JETP Lett. 68 (1998) 573.