Inclusive Jet Cross Sections in Collisions at = 630 and 1800 GeV
Abstract
We have made a precise measurement of the inclusive jet cross section at =1800 GeV. The result is based on an integrated luminosity of 92 pb-1 collected at the Fermilab Tevatron Collider with the DØ detector. The measurement is reported as a function of jet transverse energy (60 GeV 500 GeV ), and in the pseudorapidity intervals 0.5 and 0.10.7. A preliminary measurement of the pseudorapidity dependence of inclusive jet production ( 1.5 ) is also discussed. The results are in good agreement with predictions from next–to–leading order (NLO) quantum chromodynamics (QCD). DØ has also determined the ratio of jet cross sections at =630 GeV and =1800 GeV (). This preliminary measurement differs from NLO QCD predictions.
1 Introduction
Within the framework of quantum chromodynamics (QCD), inelastic scattering between a proton and antiproton is described as a hard collision between their constituents (partons). After the collision, the outgoing partons manifest themselves as localized streams of particles or “jets”. Predictions for the inclusive jet cross section have improved in the early nineties with next-to-leading order (NLO) perturbative QCD calculations [1] and new, accurately measured parton density functions (pdf)[2].
DØ has recently measured and published [3] the cross section for the production of jets as a function of the jet energy transverse to the incident beams, . The measurement is based on an integrated luminosity of about 92 pb-1 of hard collisions collected with the DØ Detector [4] at the Fermilab Tevatron Collider. This result allows a stringent test of QCD, with a total uncertainty substantially reduced relative to previous results [5, 6]. We also measure the ratio of jet cross sections at two center-of-mass energies: 630 (based on an integrated luminosity of about 0.537 pb-1) and 1800 GeV [7]. Experimental and theoretical uncertainties are significantly reduced in the ratio. This is due to the large correlation in the errors of the two cross section measurements, and the suppression of the sensitivity to parton distribution functions (pdf) in the prediction. The ratio of cross sections thus provides a stronger test of the matrix element portion of the calculation than a single cross section measurement alone. Previous measurements of cross section ratios have been performed with smaller data sets by the UA2 and CDF [8] experiments.
2 Jet Reconstruction and Data Selection
Jets are reconstructed using an iterative jet cone algorithm with a cone radius of =0.7 in – space, (pseudorapidity is defined as ) [9]. The offline data selection procedure, which eliminates background caused by electrons, photons, noise, or cosmic rays, follows the methods described in Refs. [10, 11].
3 Energy Corrections
The jet energy scale correction, described in [12], removes instrumentation effects associated with calorimeter response, showering, and noise, as well as the contribution from spectator partons (underlying event).
The energy scale corrects jets from their reconstructed to their “true” on average. An unsmearing correction is applied later to remove the effect of a finite resolution [3].
4 The Inclusive Jet Cross Section
The resulting inclusive double differential jet cross sections, , for and (the second region for comparison to Ref. [6]), are compared with a NLO QCD theoretical prediction [1]. Discussions on the different choices in the theoretical calculation: pdfs, renormalization and factorization scales (), and clustering algorithm parameter () can be found in Refs. [9].
Figure 1 shows the ratios for the data () and JETRAD NLO theoretical () predictions based on the CTEQ3M, CTEQ4M and MRST pdf’s [4,5] for . (The tabulated data for both and measurements can be found in Ref. [13].)
The predictions are in good quantitative agreement with the data, as verified with a test, which incorporates the uncertainty covariance matrix . Here and represent the -th data and theory points, respectively. The overall systematic uncertainty is largely correlated.
Table 1 lists values for several JETRAD predictions using various parton distribution functions [2]. The predictions describe both the and cross section very well. The measurement by DØ and CDF are also in good quantitative agreement within their systematic uncertainties [3].
| CTEQ3M | 23.9 | 28.4 |
|---|---|---|
| CTEQ4M | 17.6 | 23.3 |
| CTEQ4HJ | 15.7 | 20.5 |
| MRSA´ | 20.0 | 27.8 |
| MRST | 17.0 | 19.5 |

5 Dependence of
DØ has made a preliminary measurement of the pseudorapidity dependence of the inclusive jet cross section. Figure 2 shows the ratios for the data () and JETRAD NLO theoretical () predictions using the CTEQ3M pdf set for and . The measurements and the predictions are in good qualitative agreement. A detailed error analysis is currently being completed.
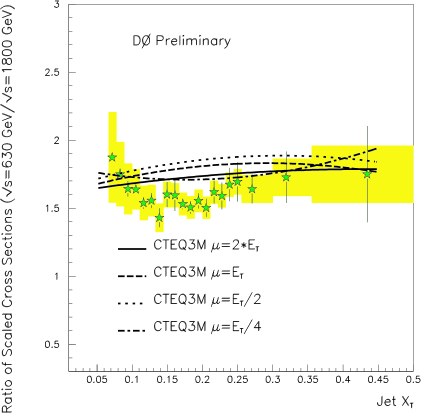
6 Ratio of Scale Invariant Jet Cross Sections
A simple parton model would predict a jet cross section that scales with center-of-mass energy. In this scenario, , plotted as a function of jet , would remain constant with respect to the center-of-mass energy. Figure 3 shows the DØ measurement of (stars) compared to JETRAD predictions (lines). There is poor agreement between data and NLO QCD calculations using the same in the numerator and the denominator (probability of agreement not greater than 10%). The agreement improves for predictions with different at the two center-of-mass energies [7].
In conclusion, we have made precise measurements of jet production cross sections. At =1800 GeV, there is good agreement between the measurements and the data. The ratio of cross sections at =1800 and 630 GeV, however, differs from NLO QCD predictions, unless different renormalization scales are introduced for the two center-of-mass energies.

References
- [1] W. T. Giele, E. W. N. Glover, and D. A. Kosower, Phys. Rev. Letters 73, 2019 (1994); S. D. Ellis, Z. Kunszt, and D. E. Soper, Phys. Rev. Letters 64, 2121 (1990); F. Aversa et al., Phys. Rev. Letters 65, (1990)
- [2] H. L. Lai et al., Phys. Rev. D 51, 4763 (1995); A. D. Martin et al., Eur. Phys. J.C 4, 463-496 (1998).
- [3] B. Abbott et al.,(DØ Collaboration), Phys. Rev. Letters 82, 2451 (1999).
- [4] S. Abachi et al., (DØ Collaboration), Nucl. Instrum. Methods A338, 185 (1994).
- [5] J. Alitti et al., (UA2 Collaboration), Phys. Letters B 257, 232 (1991); Z.Phys.C 49, 17 (1991); F. Abe et al., (CDF Collaboration), Phys. Rev. Letters 70, 1376 (1993).
- [6] F. Abe et al., (CDF Collaboration), Phys. Rev. Letters 77, 438 (1996).
- [7] J. Krane (DØ Collaboration). To be published in the proceedings of DPF (1999).
- [8] J. Appel et al., (UA2 Collaboration), Phys. Letters B 160, 349 (1985); F. Abe et al., (CDF Collaboration), Phys. Rev. Lett. 70, 1376 (1993)
- [9] S. Abachi et al., (DØ Collaboration), Phys. Letters B 357, 500 (1995); B. Abbott et al., Eur. Phys. J. C. 5, 687 (1998).
-
[10]
D. Elvira, Ph.D. Thesis, Universidad de
Buenos Aires, Buenos Aires, Argentina, 1995 (unpublished),
http://www-d0.fnal.gov/results/ publications_talks/thesis/thesis.html. -
[11]
J. Krane, Ph.D. Thesis, University of
Nebraska-Lincoln, 1998 (unpublished),
http://www-d0.fnal.gov/results/ publications_talks/thesis/thesis.html. - [12] B. Abbott et al., (DØ Collaboration), Nuc. Inst. and Meth. A 424, nos. 2-3, 352-394 (1999)
-
[13]
Available from the AIP E-PAPS service
and at
http://www-d0.fnal.gov/ d0qcd/inclusive