MEASUREMENT OF THE ATMOSPHERIC MUON NEUTRINOS
WITH THE MACRO DETECTOR
Abstract
The flux of muons induced by atmospheric neutrinos has been measured with the MACRO detector. Different event topologies have been detected, due to neutrino interactions in the apparatus and in the rock below it. The upward-throughgoing muon sample is the larger one and is generated by neutrinos with a peak energy of . The observed upward-throughgoing muons are fewer than expected and the zenith angle distribution does not fit with the expected one. Assuming neutrino oscillation, the angular shape and the normalization factor suggest maximal mixing and of a few times . Also the other event categories induced by low-energy neutrinos (peak energy ) show a deficit of observed events. The value of this deficit and its uniformity with respect to the angular bins are in agreement with the oscillation parameters suggested by the analysis of the upward-throughgoing muon sample.
Les Rencontres de Physique de la Vallee d’Aoste
February 28 - March 6, 1999, La Thuile, Italy
1 Introduction
The interest in precise measurements of the flux of neutrinos produced in cosmic ray cascades in the atmosphere has been growing over the last years due to the anomaly in the ratio of contained muon neutrino to electron neutrino events1-5). The anomaly finds explanation in the scenario of neutrino oscillation. The effects of neutrino oscillations appear also at higher energies, as reported by many experiments6-9). The flux of muon neutrinos in the energy region from a few up to hundreds of is inferred from measurements of upgoing muons. The flux of upgoing muons is reduced as a consequence of oscillations. A clearer signature of oscillations in the range is connected with the dependence of the reduction on the polar angle with respect to the zenith. The reduction in the number of events is stronger near the vertical than near the horizontal directions due to the longer pathlength of neutrinos from production to observation near the nadir (Fig. 1).

Furthermore the flux of atmospheric muon neutrinos in the region of a few can be studied looking at muons produced inside the detector and muons externally produced and stopping inside it. If the atmospheric neutrino anomalies are the results of neutrino oscillations, it is expected a reduction in the flux of upward-going low-energy atmospheric neutrinos of about a factor of two, but without any distortion in the shape of the angular distribution.
2 The MACRO detector
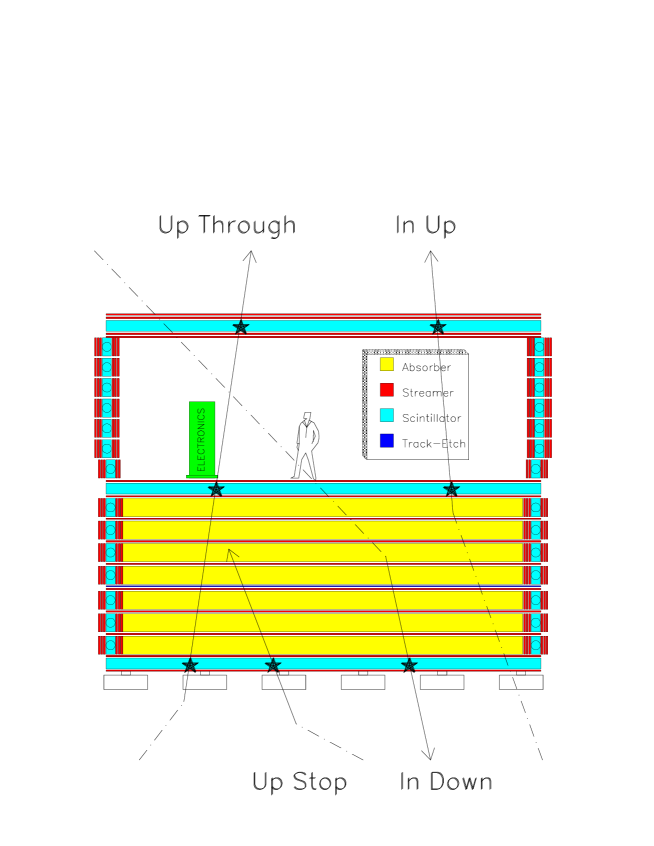
The MACRO detector[10] is located in the Gran Sasso Laboratory, with a minimum rock overburden of . It is a large rectangular box () divided longitudinally in supermodules and vertically in a lower and an upper part, called attico. The active elements (see Fig. 2) are liquid scintillation counters for time measurement and streamer chambers for tracking, with stereo strip readouts. In the lower half of the detector streamer tube planes are alternated with trays of crushed rock absorbers. The attico is hollow and it is used as a work area in which the electronics racks are placed. The streamer tube system allows to achieve a tracking resolution for muons in the range – as a function of the track length. Hence the angular uncertainty is lower than the angular spread due to multiple scattering in the rock for a muon coming from above. The scintillator system consists of horizontal and vertical layers. The scintillator resolutions for muons are about in time and in position.
Thanks to its large area, fine tracking granularity and electronics symmetry with respect to upgoing and downgoing flight directions, the MACRO detector is a proper tool for the study of upward-travelling muons, generated by external interactions. Its mass () allows also to collect a statistically significant sample of neutrino events due to internal interactions.
3 Neutrino events in MACRO
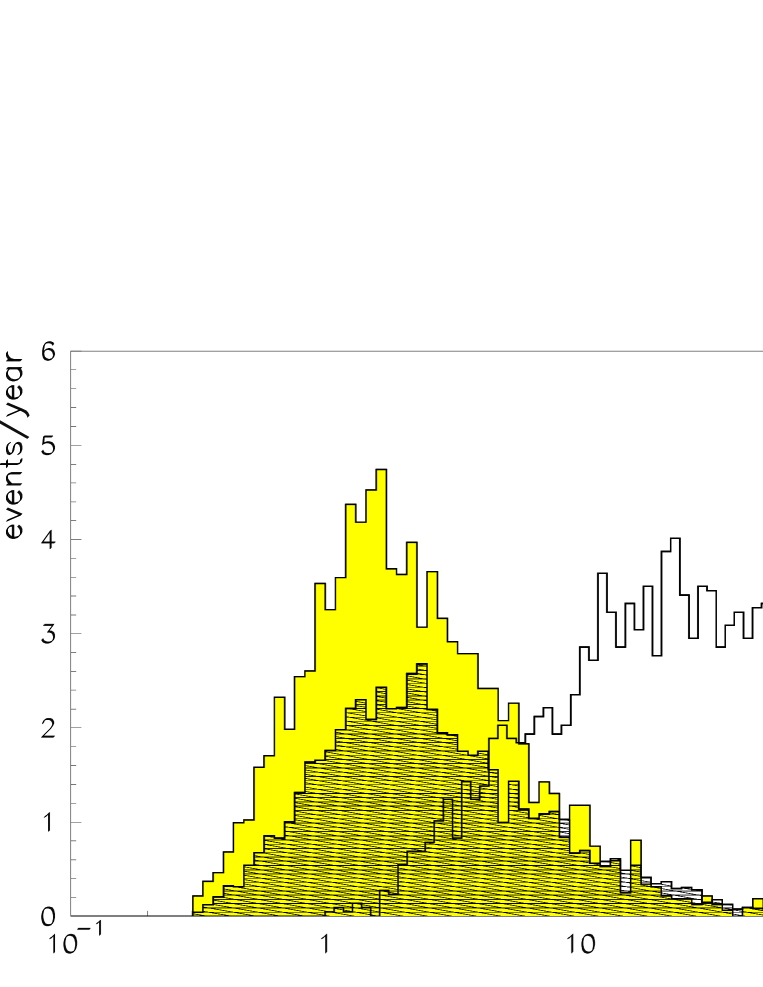
Fig. 2 displays the different kinds of neutrino events here analyzed. Most of the detected particles are muons generated in Charged Current interactions. In Fig. 3 the parent neutrino energy distributions for the different event topologies are shown :
-
•
Up Through - These tracks come from interactions in the rock below MACRO and cross the whole detector (). The time information provided by scintillator counters allows to know the flight direction by means of the time-of-flight (T.o.F. ) method. The data have been collected in three periods, with different detector configurations. In the first two periods (March 1989 – November 1991, December 1992 – June 1993) only lower parts of MACRO were working[6]. In the last period (April 1994 – February 1999) also the attico was in acquisition.
-
•
In Up - These partially contained events come from interactions inside the apparatus. Also in this case the analysis algorithm is based on the T.o.F. calculation made possible by the attico scintillator layers. Hence only the data collected with the attico (live-time years) are useful for this analysis. A not negligible percentage () of events is expected to be induced by Neutral Currents or CC interactions.
-
•
Up Stop + In Down - This sample is composed by two subsamples : external interactions with upward-going track stopping in MACRO (Up Stop), interactions in the lower part of the detector with a downgoing track (In Down). These events are recognized by means of topological criteria and the lack of time information makes difficult to distinguish the two subsamples. Up to now we consider them as an unique sample. Assuming that neutrinos do not oscillate, it is expected that the number of Up Stop is almost equal to the number of In Down and the contribution of Neutral Currents and CC interactions is . The attico is used also in the analysis of this sample as a veto for downgoing tracks. Therefore the analyzed data are those collected with the whole detector with the same effective live-time of the In Up sample.
4 Analysis procedure
The T.o.F. method uses the formula
| (1) |
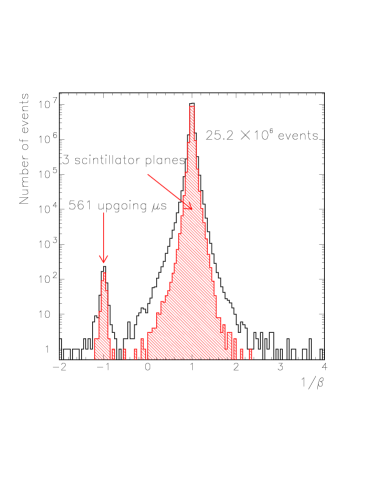
where and are the times measured in lower and higher scintillator counters, respectively, and is the path between the two counters. Therefore results roughly for downgoing tracks and for upgoing tracks. In the sample of throughgoing muons it happens that a track hits 3 scintillator layers. In this case the time measurements are redundant and is calculated by means of a linear fit of the time as a function of the pathlength.
Several cuts are imposed to remove backgrounds from radioactivity and showering events which may cause failure in time reconstruction. Another background is connected to photonuclear processes such as where low-energy upgoing particles are produced at large angles by downgoing muons[11]. The requirement of a minimum range of in the apparatus is applied to the Up Through sample in order to reduce drastically these low-energy tracks which mimic neutrino induced events when the downgoing muon misses MACRO.
After all analysis cuts the signal peaks with are well isolated for the first two samples (see Fig. 4).

The Up Stop + In Down events are identified via topological constraints. The main requirement is the presence of a reconstructed track crossing the bottom scintillator layer. All the track hits must be at least far from the supermodule walls. The criteria used to verify that the event vertex (or stop point) is inside the detector are similar to those used for the In Up search. The probability that an atmospheric muon produces a background event is negligible. To reject ambiguous and/or wrongly tracked events which survive automated analysis cuts, real events are directly scanned with the MACRO Event Display. Because of the low energy of these events the minimum range of in the apparatus is not required. Therefore the background due to upward going charged pions is estimated via simulation and subtracted on a statistical basis.
Expected rates and angular distributions have been estimated assuming the atmospheric flux calculated by the Bartol University group[12][13]. The estimate of cross-section was based on GRV94[14] parton distribution set, which varies by the prediction with respect to the Morfin and Tung[15] parton distribution used in the past by the MACRO Collaboration. For In Up and Up Stop + In Down samples also low-energy effects[16] have been taken into account. The propagation of muons in the rock was taken from Lohmann et al[17]. The uncertainty on the expected muon flux is estimated for Up Through events and for the other events. The apparatus and the data acquisition are fully reproduced in a GEANT[18] based Monte Carlo program. Real and simulated data are analyzed by means of the same procedure. Particular care has been taken to minimize the systematic uncertainty in the detector acceptance simulation. For the Up Through sample different acceptance calculations, including separate electronic and data acquisition systems, have been compared. For each sample, two different analyses have been performed getting the same results. Furthermore trigger and streamer tube efficiency, background subtraction, effects of analysis cuts have been in detail studied. The efficiency of the visual scanning for the Up Stop + In Down sample has been estimated by analyzing real and simulated events after a random merging. The systematic error on the total number of events due to the acceptance has been estimated for Up Through sample. The uncertainty is higher () for low-energy samples because it depends strongly on data taking conditions, analysis algorithm efficiency and detector mass.


5 High energy sample - Analysis results
In the Up Through sample 642 events are in the signal range (). Looking at the distribution of events outside the signal peak, we estimate a background contamination of events. Furthermore events are expected to be upgoing charged particles produced by downgoing muons. Finally we expect that are not true Up Through events because they are generated by neutrino interactions in the very bottom layer of MACRO scintillators. Hence, removing these backgrounds, the observed number of Up Through muons integrated over all zenith angles results .
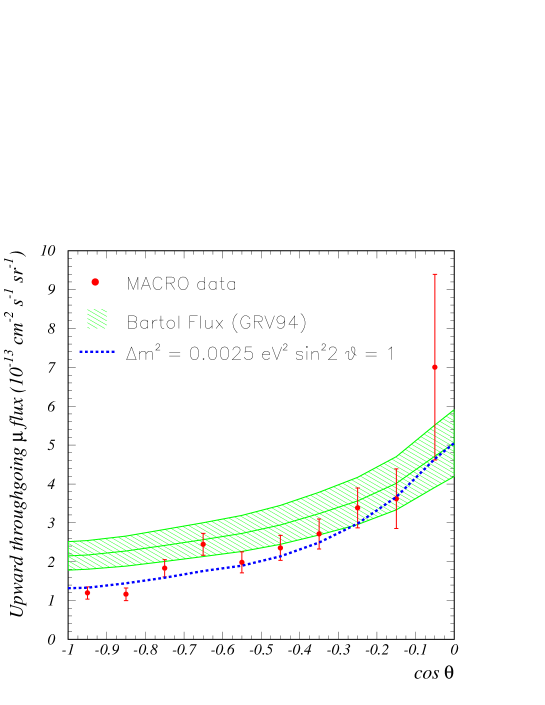
For this sample events are expected and the ratio of observed to expected events is reported in Table 1. In Fig. 5 the distribution of the measured flux is shown compared with the expected ones assuming stable or oscillating neutrinos. The data error bars are the statistical errors with an extension due to the systematic errors, added in quadrature. The observed zenith distribution does not fit well with the hypothesis of no oscillation, giving a maximum probability111The data are normalized to the predicition. The last bin near the horizontal is not taken into account because of the higher acceptance uncertainty and the background connected to scattering of quasi horizontal downgoing muons. of only . Combining normalization and angular shape the probability is still very low ().

These results can be explained in the scenario of oscillation. Assuming the lower value for the angular distribution in the physical region222The best value is 10.6 in the unphysical range (). is with maximal mixing and . In the first plot of Fig. 6 the independent probabilities for normalization and angular shape and the combined probability are shown as functions of assuming maximal mixing. It is notable that total number of events and distribution indicate very close values of . The second plot of Fig. 6 shows the same probabilities for oscillation[19][20]. The maximum of the combined probability is for and for oscillation into sterile neutrino.
Fig. 7 shows the confidence regions at the and confidence levels based on application of the Monte Carlo prescription by Feldman et al[21]. Also the sensitivity of the experiment is plotted. The sensitivity is the contour which would result when the data are equal to the Monte Carlo prediction at the best-fit point.
| Topology | Ratio | Statist. | Syst. | Theor. | Ratio with |
|---|---|---|---|---|---|
| error | error | error | oscillation | ||
| Up Through | 0.736 | 0.031 | 0.044 | 0.12 | 1.058 |
| In Up | 0.57 | 0.05 | 0.06 | 0.14 | 0.98 |
| Up Stop + In Down | 0.71 | 0.05 | 0.07 | 0.18 | 0.92 |
6 Low energy samples - Analysis results
In the In Up sample the uncorrelated background is estimated from the distribution. After the background subtraction events are accepted. The prediction is In Up events. In the Up Stop + In Down sample events survive the analyis cuts and the visual scanning while events are expected.
The ratios of the observed number of events to the prediction and the angular distributions of both samples are reported in Table 1 and in Fig. 8. The low-energy samples show an uniform deficit of the measured number of events over the whole angular distribution with respect to the predictions based on the absence of neutrino oscillation.
We note the agreement between the results for low-energy and Up Through events. Assuming the oscillation parameters suggested by higher energy sample, it is expected a disappearance of in In Up and Up Stop samples because of the neutrino path (thousands of kilometres). No flux reduction is instead expected for In Down events whose neutrino path is of the order of tens of kilometres. The ratios and the angular distributions estimated assuming the oscillation are also reported in Table 1 and in Fig. 8.
In order to reduce the effects of uncertainties coming from neutrino flux and cross section, the double ratio
| (2) |
has been studied. A residual theoretical error () survives, due to small differences between the energy spectra of the two samples. Because of some cancellations the systematic uncertainty is also reduced to . The value of the double ratio over the zenith angle distribution is shown in Fig. 9. Assuming the oscillation parameters (, ) suggested by Up Through sample, the points are compatible with 1.
The probability to obtain a sum double ratio at least so far from 1 is assuming no oscillation and the Bartol flux as the parent flux.


7 Conclusions
The flux and the shape of the zenith distribution for the Up Through sample favour oscillations. The experimental data have a probability assuming oscillation against assuming stable neutrino.
Therefore the new data confirm the MACRO published results[6][7] with increased probability for the oscillation hypothesis.
The low-energy neutrino events are fewer than expected and the deficit is quite uniform over the whole angular range. Also these results suggest oscillation with maximal mixing and of a few times .
The combined analysis of high and low energy data is in progress. Presently we stress the strong coherence of the MACRO results in different energy ranges and with different event topologies.
References
- 1 . K.S. Hirata et al (Kamiokande Collaboration), Phys. Lett. B280, 2 (1992).
- 2 . D. Casper et al (IMB Collaboration), Phys. Rev. Lett. 66, 2561 (1991).
- 3 . R. Becker-Szendy et al (IMB Collaboration), Phys. Rev. D46, 3720 (1992).
- 4 . W.W.M. Allison et al (Soudan Collaboration), Phys. Lett. B391, 491 (1997).
- 5 . Y. Fukuda et al (SuperKamiokande Collaboration), Phys. Rev. Lett. 81, 1562 (1998).
- 6 . S. Ahlen et al (MACRO Collaboration), Phys. Lett. B357, 481 (1995).
- 7 . M. Ambrosio et al (MACRO Collaboration), Phys. Lett. B434, 451 (1998).
- 8 . S. Hatakeyama et al (Kamiokande Collaboration), Phys. Rev. Lett. 81, 2016 (1998).
- 9 . Y. Fukuda et al (SuperKamiokande Collaboration), e-print archive hep-ex/9812014.
- 10 . S. Ahlen et al (MACRO Collaboration), Nucl. Instr. and Methods A324, 337 (1993).
- 11 . M. Ambrosio et al (MACRO Collaboration), Astroparticle Physics 9, 105 (1998).
- 12 . T.K. Gaisser et al, in : Proc. 24th ICRC (Rome, 1995), 1, 694.
- 13 . V. Agrawal et al, Phys. Rev. D53, 1314 (1996).
- 14 . M. Glück et al, Z. Phys. C53, 127 (1992).
- 15 . J.G. Morfin et al, Z. Phys. C52, 13 (1991).
- 16 . P. Lipari et al, Phys. Rev. Lett. 74, 4384 (1995).
- 17 . W. Lohmann et al, CERN-EP 85-03 (1985).
- 18 . R. Brun et al, CERN GEANT User’s Guide DD/EE 84-1 (1992).
- 19 . E. Akhmedov et al, Phys. Lett. B300, 128 (1993).
- 20 . Q.Y. Liu et al, Nucl. Phys. B524, 505 (1998).
- 21 . G.J. Feldman et al, Phys. Rev. D57, 3873 (1998).