Recent Results from the Tevatron Fixed Target and Collider Experiments
Abstract
We present a review of recent QCD related results from the Fermilab Tevatron fixed target and collider experiments. Topics include jet and boson production, boson and top quark mass measurements, and studies of violation.
1 INTRODUCTION
Quantum Chromodynamics (QCD) emerged as a mathematically consistent theory in the 1970s, and nowadays is regarded as one of the cornerstones of the Standard Model. One of the triumphs of modern particle physics has been the extent to which QCD has successfully accounted for the strong interaction processes observed experimentally at hadron colliders. Some of the processes studied include hadronic jet, heavy quark, and gauge boson production.
The number of new results from the Fermilab Tevatron accelerator that are being presented in over twenty parallel sessions at this conference is overwhelming. The two collider detectors, CDF and DØ, have finished taking data in 1996; new results on Jet and Boson properties are based on these large data sets of integrated luminosity. Both collaborations are upgrading their detectors in preparation for Run II, scheduled to start in the year 2000. Results from the fixed target experiments are based on data taken during the last fixed target run that ended in 1997. The upcoming fixed target run is scheduled for later this year.
In this summary we review QCD results that are new since last year and that are presented in greater detail in the parallel sessions. We also include the new Tevatron results on the mass of the boson and the top quark from CDF and DØ. These measurements are used to constrain the mass of the Higgs boson. In addition, we present recent studies of violation. The KTeV collaboration has clearly observed direct violation in the Kaon system. CDF observes the first indication of violation in the quark system. New results from the NuTeV collaboration are being presented in a different summary contribution to this conference [1].
2 JET PRODUCTION IN PROTON–
ANTIPROTON COLLISIONS
At the Tevatron energies, the dominant process in collisions is jet production. Within the framework of QCD, inelastic scattering between a proton and an antiproton can be described as an elastic collision between a single proton constituent and a single antiproton constituent. These constituents are called partons. After the collision, the outgoing partons manifest themselves as localized streams of particles referred to as “jets”. Theoretical predictions for jet production are given by the folding of the parton scattering cross sections with experimentally determined parton density functions (pdf’s). These predictions have recently improved with next–to–leading order (NLO) QCD scattering calculations [2, 3, 4] and new, accurately measured pdf’s [5, 6]. Some of the questions that can be addressed with studies of jet production are testing of NLO QCD, extraction of pdf’s, measuring the value of the strong coupling constant , and testing quark compositeness.
2.1 Inclusive Jet Cross Section
The DØ and CDF collaborations measure the central inclusive jet cross section in collisions at using an integrated luminosity of and , respectively. The inclusive double differential jet cross section can be expressed as:
where is the total number of jets observed in a certain jet transverse energy bin, is the selection efficiency, is the bin width, is the pseudorapidity range considered, and is the integrated luminosity associated with the data set. The cross sections are measured in the pseudorapidity interval (CDF, [7]), and the two pseudorapidity ranges and (DØ, [8]). Figure 1 shows the ratio plot (Data-Theory)/Theory for the rapidity range for CDF and DØ data compared to NLO QCD.

In addition, DØ presented for the first time the preliminary [9] measurement of the rapidity dependence of the inclusive jet cross section, which extends the measurement to two forward rapidity regions: and . Figure 2 shows the ratio plot (Data-Theory)/Theory for this measurement. All the measurements show good agreement with the NLO QCD predictions currently available.

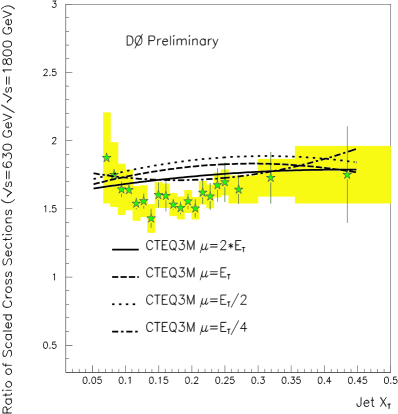
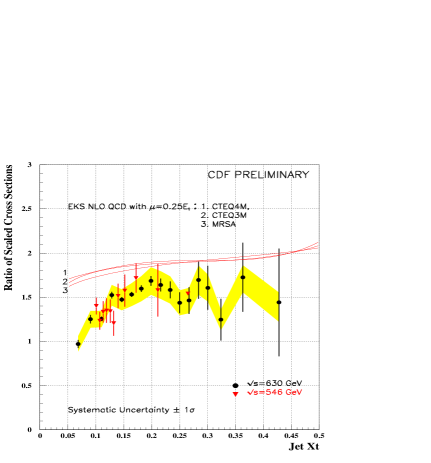
Although the Tevatron nominally operated at a center of mass energy of , a short period of the time was devoted to collect data at the lower center of mass energy of . DØ [9] and CDF [7] measure the ratio of scale invariant cross section at two center of mass energies as a function of Jet . Figures 3 and 4 show the preliminary results for DØ and CDF respectively. NLO QCD overestimates the DØ data by almost three standard deviations in the medium range of . The disagreement between data and theory is even worse for the CDF data at low . A good quantitative agreement between DØ data and NLO QCD can be obtained if different renormalization scales are used in the theoretical calculation at the two different center–of–mass energies. For instance, a scale of at and of at reproduces the DØ data best.
CDF [7] extracts the value of the strong coupling constant in the jet range from by comparing the measured inclusive jet cross section to the NLO JETRAD [10] Monte Carlo. The evolution of the coupling constant over a wide range of scales is clearly observed and is in agreement with QCD predictions. The measured is evolved to using a two–loop renormalization group equation. The preliminary measurement is .
2.2 Dijet Production
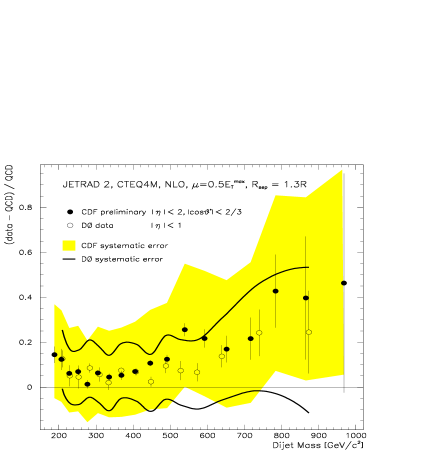
CDF and DØ measure the jet production cross section for events with two jets as a function of the dijet invariant mass. The results are shown in figure 5. NLO QCD is in good agreement with the data. DØ’s measurement of the dijet mass spectrum [11] is used to search for quark compositeness, which would manifest itself as an excess of events at high masses. A mass scale characterizes both the strength of the quark substructure binding and the physical size of the composite state. Limits are set assuming that such that quarks appear to be point-like and the coupling can be approximated by a four–Fermion contact interaction. The best sensitivity is obtained by taking the ratio of the dijet cross sections for events in which both jets are central () and events in which both jets are forward (). The confidence level lower limits on the mass scale are and for destructive and constructive interference models respectively.
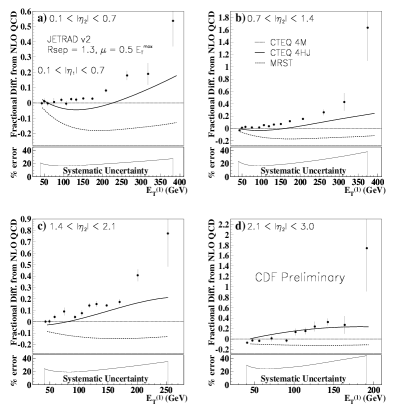
CDF measures the inclusive dijet differential cross section [12] as a function of the trigger jet . The trigger jet is central (); the second jet pseudorapidity is in one of the following four bins: , , , . The four resulting cross sections are shown in figure 6. The measurement is sensitive to the choice of pdf, and CTEQ4HJ qualitatively reproduces CDF data best.
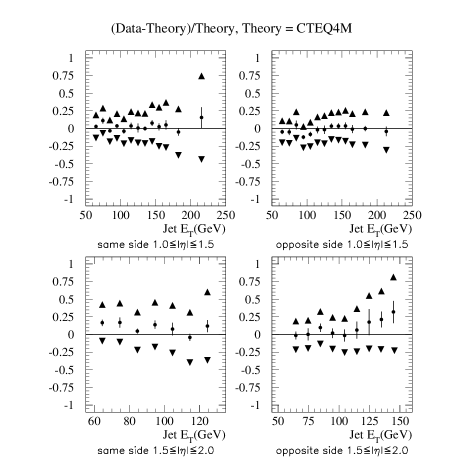
The DØ calorimeter allows the measurement of the energies of jets in the very forward rapidity region permitting a determination of the inclusive dijet differential cross section [13] as a function of the leading and next–to–leading jet in four pseudorapidity bins: , , , . Two topologies are considered: (“same side”) and (“opposite side”), with both jets required to be in the same bin. The eight resulting cross sections are shown in figures 7 and 8. The measurement is sensitive to the choice of pdf and CTEQ4M qualitatively reproduces the DØ data well.

2.3 Subjet Multiplicity in Quark and Gluon Jets
DØ measures the subjet multiplicity in jets reconstructed using the algorithm [14]. Jets with and are selected from data taken at two center–of–mass energies, and .
The HERWIG [15] Monte Carlo event generator predicts that of the jets are gluon jets at , and of the jets are gluon jets at . This information is used as input to the analysis to extract the average subjet multiplicity in gluon () and quark () jets. DØ clearly distinguishes, on a statistical bases, between quark and gluon jets, as can be seen in figure 9. The measured value of agrees with the Monte Carlo prediction of .

2.4 Diffractive Jet Production
DØ observes the production of dijet events produced in conjunction with two forward rapidity gaps (no calorimeter or scintillator hits in ) along the directions of each of the initial beam particles in proton–antiproton collisions at the center of mass energies of and [16]. This topology is consistent with Hard Double Pomeron exchange. It is interesting to examine the spectrum of the jets produced in these diffractive events. Figure 10 shows the spectra of the two leading jets for an inclusive sample with two central jets greater than (solid histogram), a sample with the additional requirement of a single forward rapidity gap (dashed histogram) and a sample of double gap events (open circles). All three spectra are in good agreement where the data are available, implying that the dynamics of leading jets produced in the rapidity gap events appear to be similar to those of inclusive QCD production. The same behavior is observed in data taken at the lower center of mass energy of . The spectra at both center of mass energies looks harder than allowed by the rule–of–thumb for the pomeron momentum fraction.

CDF observes diffractive dijet production associated with a leading antiproton in collisions at in data taken with the roman–pot trigger [17]. Using the diffractive dijet events in the kinematic region of the momentum loss fraction of the antiproton and the four momentum transfer squared , CDF finds that the cross section ratio of diffractive to non-diffractive dijet events as a function of the momentum fraction of the parton in the antiproton participating in the dijet production decreases with increasing , as can be seen in figure 11. Similar results are observed in data taken at the center of mass energy of .

3 BOSON PRODUCTION
and bosons, the carriers of the weak force, are directly produced in high energy collisions at the Fermilab Tevatron. In addition to probing electroweak physics, the study of the production of and bosons provides an avenue to explore QCD, the theory of strong interactions. Direct production of photons is also a powerful tool for testing QCD predictions with fewer of the ambiguities associated with jet production and fragmentation. The measurement of the high mass Drell–Yan cross section above the mass tests for quark–lepton compositeness.
3.1 and Production in collisions
Large numbers of bosons have been detected by the two collider detectors (CDF and DØ) during the 1992–1996 running period. These samples complement the detailed studies carried out on the boson at LEP and SLC, and also the new studies from LEP II.
DØ measures the production cross section times branching ratio for and bosons. The product of the boson cross section and the branching fraction for is calculated using the relation
where and are the number of and candidate events; and are the fraction of the and candidate events that come from multijet, quark, and direct photon background sources; and are the efficiency for and events to pass the selection requirements; and are the geometric and kinematic acceptance for and which include effects from detector resolution; , and are the fraction of and events that passes the selection criteria; and is the integrated luminosity of the data sample.
The product of the boson cross section and the branching fraction for is determined from the relation
where is a correction for the Drell-Yan contribution to boson production. The results are summarized in table 1.
The ratio of the cross sections can be used to extract an indirect measurement of the total width of the boson. In the ratio, many of the systematic uncertainties, including the luminosity uncertainty, cancel. This method therefore gives the most precise determination of the width currently available. The result on the cross section ratio is summarized in table 1. Using this results we can determine the electronic branching fraction of the boson via . Using = 0.03367 0.00006 [18] and = 3.29 0.03 [19], we get = 0.1066 0.0015 (stat) 0.0021 (syst) 0.0011 (other) 0.0011 (NLO), where the next-to-last source of uncertainty comes from uncertainties in and in . Assuming the standard model prediction for the electronic partial width ( [20]), we can calculate the boson width as 0.030 (stat) 0.041 (syst) 0.022 (other) 0.021 (NLO) GeV, to be compared with the standard model prediction of = 2.094 [20]. The difference between our measured value and the standard model prediction, which is the width for the boson to decay to final states other than the two lightest quark doublets and the three lepton doublets, is thus 0.036 . This is consistent with zero within uncertainties, so we set a confidence level upper limit on the boson width to non-standard-model final states (“invisible width”) of 0.168 GeV.
CDF and DØ measure the differential distribution for and bosons decaying to electrons. The data agrees with the combined QCD perturbative and resummation calculations [21, 22], as can be seen in figure 12 for the DØ data, and in figure 13 for the CDF data. In addition, the distribution for the boson discriminates between different vector boson production models and can be used to extract values of the non-perturbative parameters for the resummed prediction from a fit to the differential cross section. Figure 14 compares DØ data to the fixed-order perturbative QCD theory [23] in terms of a percentage difference from the prediction. We observe a strong disagreement at low-, as expected due to the divergence of the NLO calculation at , and a significant enhancement of the cross section relative to the prediction at moderate values of , confirming the enhancement of the cross section from soft gluon emission.


| Value | Uncertainty Contribution(pb) | |
| 67078 | 10 | |
| 0.671 0.009 | 30 | |
| 0.465 0.004 | 20 | |
| 0.064 0.014 | 35 | |
| 0.133 0.034 | – | |
| 0.744 0.011 | – | |
| 0.045 0.005 | – | |
| 6 | ||
| 0.0211 0.0021 | 5 | |
| 84.5 3.6 pb-1 | 100 | |
| 2310 pb | ||
| 5397 | 3 | |
| 0.744 0.011 | 3 | |
| 0.366 0.003 | 2 | |
| 0.045 0.005 | 1 | |
| 0.012 0.001 | ||
| 84.5 3.6 pb-1 | 10 | |
| 221 pb | ||
| 12.43 0.18 | 0.15 | |
| 1.108 0.007 | 0.06 | |
| 0.787 0.007 | 0.09 | |
| 0.133 0.034 | 0.03 | |
| 0.064 0.014 | 0.16 | |
| 0.045 0.005 | 0.05 | |
| 0.012 0.001 | 0.01 | |
| 0.021 0.002 | 0.02 | |
| 10.43 |
3.2 Photon Production
CDF measures the inclusive photon cross section [24] in the central region using taken during the 1994–1995 collider run. Figure 15 shows the data compared to variations of the model by Vogelsang et al.[25], in which the renormalization, fragmentation and factorization scales are changed independently. None of these changes allows the theory to agree with the data over the entire region.

CDF also measures the production of a photon plus a muon [24] and probes the charm content of the proton via the reaction . Results for the production cross section are compared with a NLO calculation and to PYTHIA [26] Monte Carlo. The latter, which does not include bremsstrahlung radiation, falls below the data; the data are consistent with the NLO prediction.
E706 [27] uses data accumulated from a proton beam at on Be target and measures the and direct–photon inclusive cross section as functions of . The measurements are shown in figure 16 compared to NLO QCD with and without enhancement [28]. Current pQCD calculations fail to account for the measured cross sections using conventional choices of scales. A simple implementation of supplemental parton in pQCD calculations [29], with , provides a reasonable description of the data. E706 obtained similar results using a proton beam at , and a beam at , and using a hydrogen target.

3.3 Drell–Yan production
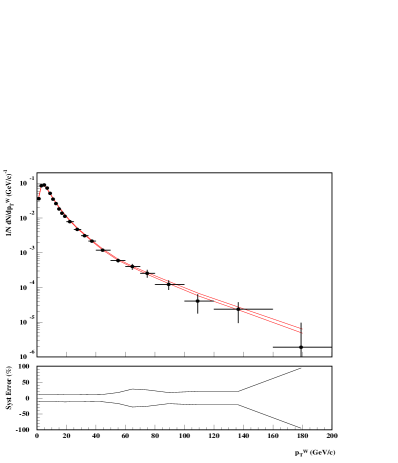
E866 measures the Drell–Yan cross sections to muon pairs [31] with dimuon mass from an proton beam incident on hydrogen and deuterium targets. The ratio of in the proton as a function of Bjorken is determined from the ratio of Drell–Yan cross sections. The result is shown in figure 17. The ratio decreases with for . However, at moderate , , it clearly is different from one and only approaches unity as .
DØ measures the Drell–Yan cross section in the dielectron invariant mass range from 50 to using of data collected in collisions at . No deviation from the standard model expectations is observed, and the data are used to set limits on the energy scale of quark–electron compositeness with common constituents. The confidence level lower limits on the compositeness scale vary between and depending on the assumed form of the effective contact interaction [30].
4 MEASUREMENT OF THE MASS
In the standard model of the electroweak interactions, the mass of the boson is predicted to be
| (1) |
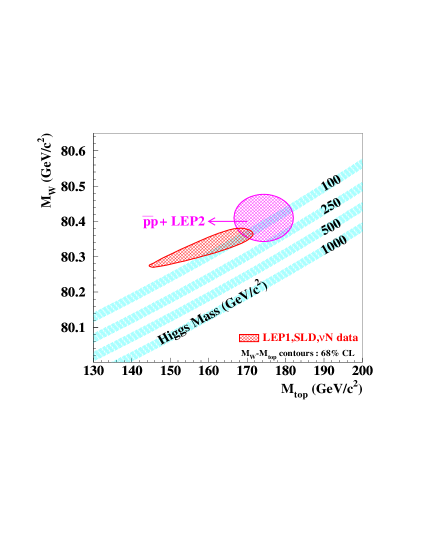
In the “on-shell” scheme [35] , where is the boson mass. A measurement of , together with , the Fermi constant (), and the electromagnetic coupling constant (), determines the electroweak radiative corrections experimentally. Purely electromagnetic corrections are absorbed into the value of by evaluating it at [36]. The dominant contributions to arise from loop diagrams that involve the top quark and the Higgs boson. The correction from the loop is substantial because of the large mass difference between the two quarks. It is proportional to for large values of the top quark mass . Since has been measured at the Tevatron, this contribution can be calculated within the Standard Model. For a large Higgs boson mass, , the correction from the Higgs loop is proportional to . If additional particles which couple to the boson exist, they would give rise to additional contributions to . Therefore, a measurement of is one of the most stringent experimental tests of SM predictions. Deviations from the predictions may indicate the existence of new physics. Within the SM, measurements of and the mass of the top quark constrain the mass of the Higgs boson. A discrepancy with the range allowed by the Standard Model could indicate new physics. The experimental challenge is thus to measure the boson mass to sufficient precision, about , to be sensitive to these corrections.
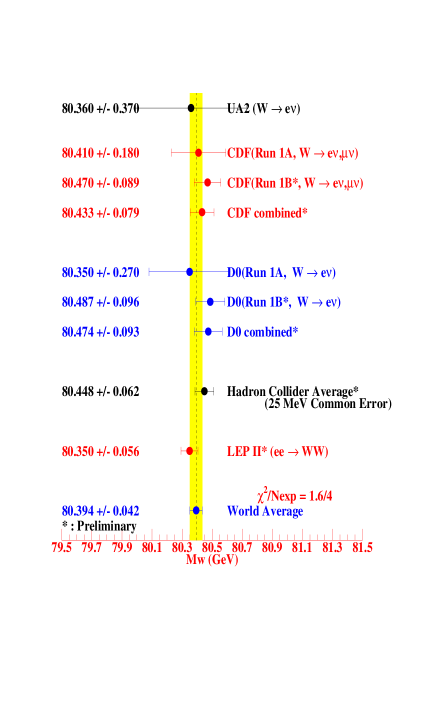
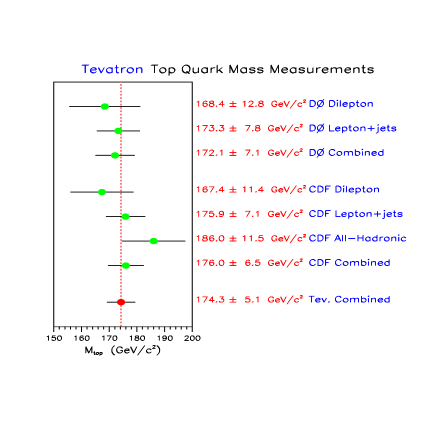
CDF and DØ report precise new measurements of the boson mass based on an integrated luminosity of from collisions at TeV. CDF identifies bosons by their decays to and , with electrons and muons identified in the central pseudorapidity region of the detector. The combined CDF result [37] for is . DØ identifies bosons by their decays to , with electrons identified both in the central and the forward pseudorapidity region. The combined DØ result [38] for is . The Tevatron values are combined with a 25 MeV common error, covering common uncertainties in pdf’s, W width and QED corrections to give : . The inclusion of the UA2 data produces a hadron collider average of : . Including LEP2 gives a world average of direct W mass measurements of : . The various measurements can be seen in figure 18. Figure 19 shows the current results for the top quark mass measurements from CDF and DØ. Figure 20 compares the direct measurements of the boson and top quark masses to the values predicted by the Standard Model for a range of Higgs mass values [39].The measured values are in agreement with the prediction of the Standard Model.
5 STUDIES OF VIOLATION
CDF reports an updated [32] direct measurement of the Standard Model CP violation parameter using of data collected in collisions at . CP violation can manifest itself as an asymmetry in the decay rate of particle versus antiparticle to a particular final state:
In the Standard Model, this CP asymmetry is proportional to . A value of would indicate CP violation in the quark system.
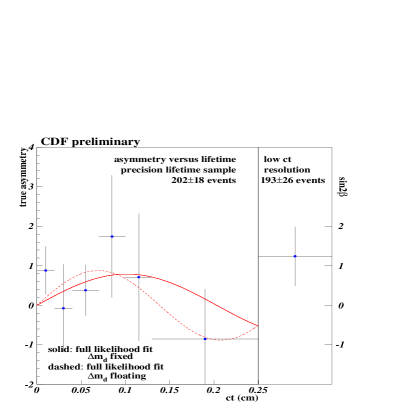
CDF uses a signal sample that consists of events. About half of the events have both muon tracks fully contained within the silicon vertex detector, and therefore have precision lifetime information. Three tagging methods are used to identify the flavor of the meson at the time of production [33]: the same–side tag, the soft–lepton tag and a jet–charge tag. Figure 21 shows the true asymmetry () as a function of lifetime for events. The non–SVX events, for which precision lifetime information is not available, are shown as a single point on the right. A maximum likelihood method is used to extract the result of . This measurement is the best indication that symmetry is violated in the quark system and is consistent with the Standard Model expectation of a large positive value of [34].
KTeV reports a new measurement of the direct violation parameter using of the data collected during the 1996–1997 fixed target run. It is well known that, in the neutral meson system, the two strangeness states mix to produce short and long lived kaons . In 1964, the observation of decays [40] revealed that symmetry is violated by the weak interaction. The dominant effect is an asymmetry in the mixing, parameterized by . Direct violation refers to the decays, in which a true eigenstate decays to a final state with opposite . The most sensitive searches for direct violation [41] measure
In this experiment, protons from the Tevatron are used to produce two beams; a regenerator in one of the beams (alternating once per minute) converts some to by coherent forward scattering. Kaon decays in the “vacuum beam” () and “regenerator beam” (mostly ) are collected simultaneously with the KTeV detector. is extracted from the data using a fitting program which calculates decay distributions using full treatments of kaon production and regeneration. The measured value of firmly establishes the existence of violation in the decay process and rules out the “superweak” model [42]. Standard Model calculations of depend sensitively on input parameters and the method of calculations [43]; it remains to be seen whether this large value of can be accommodated or may be an indication of new physics beyond the Standard Model.
6 CONCLUSIONS
Although the Tevatron experiments have stopped taking data several years ago, the number of new results is overwhelming. The unprecedented precision in the experimental results that is being achieved is confronting theory with experiments at new limits. So far, QCD has held up to all the quantitative tests that were performed. We expect to see improvements in the calculations in the following years while the experiments prepare for a new period of data taking in which the Tevatron will continue to improve our understanding of nature.
7 ACKNOWLEDGMENTS
I would like to thank my Tevatron colleagues who have provided me with the results included in this review, especially Andrew Brandt, Daniel Elvira, Ulrich Heintz, Rob Snihur and Mike Strauss from DØ, Alex Akopian, Mike Albrow, Frank Chlebana and Barry Wicklund from CDF, Marek Zielinski from E706, Donald Isenhower from E866, Peter Shawhan from KTeV, and Jeff Appel from E791. I would also like to thank the DIS99 organizers for an extremely interesting workshop.
References
- [1] Jorge Morfin, “Near–and–Far Future DIS Experiments at Fermilab”, this conference.
- [2] S. D. Ellis, Z. Kunszt, and D. E. Soper, Phys. Rev. Lett.64, 2121 (1990).
- [3] F. Aversa, et al. , Phys. Rev. Lett.65, (1990).
- [4] W. T. Giele, E. W. N. Glover, and D. A. Kosower, Phys. Rev. Lett.73, 2019 (1994).
- [5] H. L. Lai et al.Phys. Rev. D55128097.
- [6] A. D. Martin et al., Eur. Phys. J. C4, 463 (1998).
- [7] Alex Akopian for the CDF Collaboration, WGIII, this conference.
- [8] The DØ Collaboration, Phys. Rev. Lett. 82 2451 (1999)
- [9] Daniel Elvira for the DØ Collaboration, WGIII, this conference.
- [10] W.T. Giele, E.W.N. Glover and D.A. Kosower, Phys. Rev. Lett. 73, 2019 (1994).
- [11] The DØ Collaboration, Phys. Rev. Lett. 82 2457 (1999)
- [12] Frank Chlebana for the CDF Collaboration, WGIII, this conference.
- [13] Heidi Schellman for the DØ Collaboration, WGIII, this conference.
- [14] Robert Snihur for the DØ Collaboration, WGIII, this conference.
- [15] G. Marchesini et al., Comput. Phys. Commun. 67, 465 (1992).
- [16] Kristal Mauritz for the DØ Collaboration, WGII, this conference.
- [17] Kerstin Borras for the CDF Collaboration, WGII, this conference.
- [18] L. Montanet et al. (Particle Data Group), Phys. Rev. D 54, 1 (1996).
- [19] R. Hamberg, W.L. van Neerven and T. Matsuura, Nucl. Phys. B359, 343 (1991); W.L. van Neerven and E.B. Zijlstra, Nucl. Phys. B382, 11 (1992).
- [20] J.L. Rosner, M.P. Worah, and T. Takeushi, Phys. Rev. D 49, 1363 (94).
- [21] P. Arnold and R. Kauffman, Nucl. Phys. BB34938191.
- [22] C. Balasz and C. P. Yuan, Phys. Rev. D 56, 5558 (1997).
- [23] P. B. Arnold and M. H. Reno, Nucl. Phys. B319, 37 (1989).
- [24] Steve Kuhlmann for the CDF and DØ collaborations, WGIII, this conference.
- [25] W. Vogelsang and A. Vogt, Nucl. Phys. /bf B 453, 334 (1995).
- [26] H.U. Bengtsson and T. Sjorstrand, Comput. Phys. Commun. 46, 43 (1987).
- [27] Michael Begel for the E706 Collaboration, WGI, this conference.
- [28] L. Apanasevich et al., Phys. Rev. D 59, 74007 (1999).
- [29] J. F. Owens, Rev. Mod. Phys. 59, 465 (1987).
- [30] The DØ Collaboration, to be published in Phys. Rev. Lett..
- [31] Donald Isenhower for the E866 Collaboration, WGI, this conference.
-
[32]
http://www-cdf.fnal.gov/physics/new/
bottom/cdf4855/cdf4855.html. - [33] M. Gronau et al., Phys. Rev. D 47, 254 (94). CDF Collaboration FERMILAB-PUB-99/019-E.
- [34] P. Paganini et al., Phys. Scripta 58, 556 (1998). S. Mele CERN–EP–98–133, Aug. 1998, Submitted to Phys. Lett. B. A. Ali abd D. London, Nucl. Phys. Proc. Suppl. 54A, 297 (1997).
- [35] A. Sirlin, Phys. Rev. D 22, 971 (1980); W. Marciano and A. Sirlin, Phys. Rev. D 22, 2695 (1980); erratum-ibid. 31, 213 (1985).
- [36] S. Eidelmann and F. Jegerlehner, Z. Phys. C 67, 585 (1995).
-
[37]
http://www-cdf.fnal.gov/physics/ewk/
wmass_new.html -
[38]
http://www-d0.fnal.gov/public/wz/
wmass/wmass.html - [39] G. Degrassi, P. Gambino, and A. Sirlin, Phys. Lett. B394, 188 (1997).
- [40] J. H. Christenson et al., Phys. Rev. Lett.13,138 (1964)
- [41] B. Winstein and L. Wolfenstein, Rev. Mod. Phys. 65, 1113 (1993).
- [42] L. Wolfenstein, Phys. Rev. Lett.13,562 (1964).
- [43] S. Bertolini, J. O. Eeg, and M. Fabbrichesi, hep-ph/9802405 (to appear in Rev. Mod. Phys. )