Limit on Tau Neutrino Mass from
Abstract
From a data sample of 29058 decays observed in the CLEO detector we derive a 95% confidence upper limit on the tau neutrino mass of 28 MeV.
pacs:
14.60.Pq, 12.15.Ff, 23.40.BwM. Athanas,1 P. Avery,1 C. D. Jones,1 M. Lohner,1 C. Prescott,1 A. I. Rubiera,1 J. Yelton,1 J. Zheng,1 G. Brandenburg,2 R. A. Briere,2 A. Ershov,2 Y. S. Gao,2 D. Y.-J. Kim,2 R. Wilson,2 T. E. Browder,3 Y. Li,3 J. L. Rodriguez,3 H. Yamamoto,3 T. Bergfeld,4 B. I. Eisenstein,4 J. Ernst,4 G. E. Gladding,4 G. D. Gollin,4 R. M. Hans,4 E. Johnson,4 I. Karliner,4 M. A. Marsh,4 M. Palmer,4 C. Plager,4 C. Sedlack,4 M. Selen,4 J. J. Thaler,4 J. Williams,4 K. W. Edwards,5 A. Bellerive,6 R. Janicek,6 P. M. Patel,6 A. J. Sadoff,7 R. Ammar,8 P. Baringer,8 A. Bean,8 D. Besson,8 D. Coppage,8 R. Davis,8 S. Kotov,8 I. Kravchenko,8 N. Kwak,8 X. Zhao,8 L. Zhou,8 S. Anderson,9 V. V. Frolov,9 Y. Kubota,9 S. J. Lee,9 R. Mahapatra,9 J. J. O’Neill,9 R. Poling,9 T. Riehle,9 A. Smith,9 M. S. Alam,10 S. B. Athar,10 A. H. Mahmood,10 S. Timm,10 F. Wappler,10 A. Anastassov,11 J. E. Duboscq,11 K. K. Gan,11 C. Gwon,11 T. Hart,11 K. Honscheid,11 H. Kagan,11 R. Kass,11 J. Lorenc,11 H. Schwarthoff,11 E. von Toerne,11 M. M. Zoeller,11 S. J. Richichi,12 H. Severini,12 P. Skubic,12 A. Undrus,12 M. Bishai,13 S. Chen,13 J. Fast,13 J. W. Hinson,13 J. Lee,13 N. Menon,13 D. H. Miller,13 E. I. Shibata,13 I. P. J. Shipsey,13 S. Glenn,14 Y. Kwon,14,***Permanent address: Yonsei University, Seoul 120-749, Korea. A.L. Lyon,14 E. H. Thorndike,14 C. P. Jessop,15 K. Lingel,15 H. Marsiske,15 M. L. Perl,15 V. Savinov,15 D. Ugolini,15 X. Zhou,15 T. E. Coan,16 V. Fadeyev,16 I. Korolkov,16 Y. Maravin,16 I. Narsky,16 R. Stroynowski,16 J. Ye,16 T. Wlodek,16 M. Artuso,17 R. Ayad,17 E. Dambasuren,17 S. Kopp,17 G. Majumder,17 G. C. Moneti,17 R. Mountain,17 S. Schuh,17 T. Skwarnicki,17 S. Stone,17 A. Titov,17 G. Viehhauser,17 J.C. Wang,17 S. E. Csorna,18 K. W. McLean,18 S. Marka,18 Z. Xu,18 R. Godang,19 K. Kinoshita,19,†††Permanent address: University of Cincinnati, Cincinnati OH 45221 I. C. Lai,19 P. Pomianowski,19 S. Schrenk,19 G. Bonvicini,20 D. Cinabro,20 R. Greene,20 L. P. Perera,20 G. J. Zhou,20 S. Chan,21 G. Eigen,21 E. Lipeles,21 M. Schmidtler,21 A. Shapiro,21 W. M. Sun,21 J. Urheim,21 A. J. Weinstein,21 F. Würthwein,21 D. E. Jaffe,22 G. Masek,22 H. P. Paar,22 E. M. Potter,22 S. Prell,22 V. Sharma,22 D. M. Asner,23 A. Eppich,23 J. Gronberg,23 T. S. Hill,23 D. J. Lange,23 R. J. Morrison,23 H. N. Nelson,23 T. K. Nelson,23 J. D. Richman,23 D. Roberts,23 B. H. Behrens,24 W. T. Ford,24 A. Gritsan,24 H. Krieg,24 J. Roy,24 J. G. Smith,24 J. P. Alexander,25 R. Baker,25 C. Bebek,25 B. E. Berger,25 K. Berkelman,25 V. Boisvert,25 D. G. Cassel,25 D. S. Crowcroft,25 M. Dickson,25 S. von Dombrowski,25 P. S. Drell,25 K. M. Ecklund,25 R. Ehrlich,25 A. D. Foland,25 P. Gaidarev,25 R. Galik,25 L. Gibbons,25 B. Gittelman,25 S. W. Gray,25 D. L. Hartill,25 B. K. Heltsley,25 P. I. Hopman,25 D. L. Kreinick,25 T. Lee,25 Y. Liu,25 T. O. Meyer,25 N. B. Mistry,25 C. R. Ng,25 E. Nordberg,25 M. Ogg,25,‡‡‡Permanent address: University of Texas, Austin TX 78712. J. R. Patterson,25 D. Peterson,25 D. Riley,25 J. G. Thayer,25 P. G. Thies,25 B. Valant-Spaight,25 A. Warburton,25 and C. Ward25
1University of Florida, Gainesville, Florida 32611
2Harvard University, Cambridge, Massachusetts 02138
3University of Hawaii at Manoa, Honolulu, Hawaii 96822
4University of Illinois, Urbana-Champaign, Illinois 61801
5Carleton University, Ottawa, Ontario, Canada K1S 5B6
and the Institute of Particle Physics, Canada
6McGill University, Montréal, Québec, Canada H3A 2T8
and the Institute of Particle Physics, Canada
7Ithaca College, Ithaca, New York 14850
8University of Kansas, Lawrence, Kansas 66045
9University of Minnesota, Minneapolis, Minnesota 55455
10State University of New York at Albany, Albany, New York 12222
11Ohio State University, Columbus, Ohio 43210
12University of Oklahoma, Norman, Oklahoma 73019
13Purdue University, West Lafayette, Indiana 47907
14University of Rochester, Rochester, New York 14627
15Stanford Linear Accelerator Center, Stanford University, Stanford, California 94309
16Southern Methodist University, Dallas, Texas 75275
17Syracuse University, Syracuse, New York 13244
18Vanderbilt University, Nashville, Tennessee 37235
19Virginia Polytechnic Institute and State University, Blacksburg, Virginia 24061
20Wayne State University, Detroit, Michigan 48202
21California Institute of Technology, Pasadena, California 91125
22University of California, San Diego, La Jolla, California 92093
23University of California, Santa Barbara, California 93106
24University of Colorado, Boulder, Colorado 80309-0390
25Cornell University, Ithaca, New York 14853
I Motivation
In the Standard Model the tau lepton and the tau neutrino form the third generation weak doublet of leptons. Most observations are consistent with zero mass for each of the three types of neutrino, and with the conservation of lepton number for each of separately. These suppositions, however, should be tested, especially in the light of recent indications [1, 2] of oscillations among the neutrino species.
There are model dependent limits on the possible values of the tau neutrino mass. The SuperKamiokande experiment [2] measures the ratio of rates for and from decay products of particles produced in cosmic ray collisions in the atmosphere. The deficit in the rate, along with its dependence upon neutrino zenith angle and energy, can be interpreted as due to oscillation of the to with a maximal amplitude () and a frequency determined by eV2 at 90% confidence. This would imply, if the mass were much larger than the mass, that
Astrophysical observations and cosmological theory limit the energy density of the universe, thus restricting the sum of stable neutrino masses [3]. This leads to the limit
This limit not only depends on being stable, but also varies with the value of the Hubble constant and other inputs.
The possible effects of the tau neutrino on big-bang nucleosynthesis lead to either a low mass or to a decaying at higher mass [4]:
The width of the excluded region increases with the lifetime of the and also depends on the assumed abundance of light elements.
The Standard Model relations among the and masses and lifetimes and some branching fractions [5] imply
The popular see-saw mechanism for generating neutrino masses [6] postulates the relation
This would imply rather weak limits on the mass:
The model dependences in all of these limits on the mass argue for a more direct measurement. The observation of the decay of accelerator produced taus along with measurements of the energy and momentum of the detectable daughter products (all but the ) can constrain the possible values for , especially in cases when the effective mass of the detected particles is close to . Because the cross section for production is up to 15% of the total annihilation cross section, an electron-positron collider is a natural choice for the source of taus.
One looks for a hadronic decay mode with only one neutrino in the final state. Most of the previous measurements (see Table I) have been made with the higher multiplicity decay modes in which the effective mass of the hadrons is more likely to be close to the kinematic limit with the maximum sensitivity to . All such decay modes are strongly phase-space suppressed, however, and the branching fractions are very low. An alternative strategy, which we use in the present measurement, is to pick a decay mode with a lower hadron multiplicity but with a much larger branching fraction. Although the four-pion decay, , relative to the five-pion decay, produces a smaller proportion of events in which the effective hadronic mass is close to , the branching fraction is 4.2%, as compared to for the higher multiplicity modes.
II Data Sample and Event Selection
The experiment was performed using the Cornell Electron-positron Storage Ring and the CLEO II detector, described elsewhere [7]. Charged particle tracks were reconstructed in three nested cylindrical drift chambers in a solenoid field of 1.5 Tesla. The mean-squared resolution in momentum transverse to the beam was . Photon and electron showers were detected over 98% of steradians in an array of 7800 CsI scintillation counters with an energy resolution of ( in GeV) in the central region of polar angle, . Ionization, time of flight, and shower energy aided in lepton identification.
The data used in the present analysis were from 4.75 fb-1 of accumulated luminosity, two thirds at 10.58 GeV and one third at 10.52 GeV center of mass energies. This corresponds to 4.3 million pairs produced.
We determined event selection criteria using Monte Carlo simulated signal and background data samples. We selected the one-versus-three track topology with zero net charge, that is, events containing a three-charged-track tau decay candidate tagged by a single-prong decay in the opposite hemisphere. Tracks were accepted in the polar angle range . The three signal tracks each had to have and had to fail electron identification criteria [8]. The tag track had to have momentum greater than and had to be consistent with one of four possible decay modes:
or the charge conjugates. This resulted in a data sample of thousand tagged three-prong tau decay candidates.
On the three-prong side each event was required to have a , defined as two CsI calorimeter showers in the polar angle range , not matched to charged tracks, with lateral shower profiles consistent with photons, and with effective mass in the range MeV. The in the decay of the in the tag channel also had to satisfy these requirements, along with MeV for each photon and GeV. Non-photon calorimeter showers can make false candidates. These typically originate from nuclear interactions of the charged pions in the CsI crystals producing secondaries isolated from any charged track. If several candidates were found on the three-prong side of an event, we kept only the one with the highest energy. We rejected events with an extra shower of more than 300 MeV or, if photon-like in lateral shower shape, of more than 100 MeV. The selection cuts reduced the data sample to 31,305 events.
In order to minimize background from the two-photon process, for example with the final and escaping detection at small angles to the beam, we rejected events in which the net event momentum transverse to the beam was less than 150 MeV. The final data set included 29,058 events.
No particle identification information was used on the charged particles. That is, decay modes in which a substitutes for a were considered part of the signal. These modes contributed about 5% of the signal (see Table II). The four-pion final state includes , at 3% of the total.
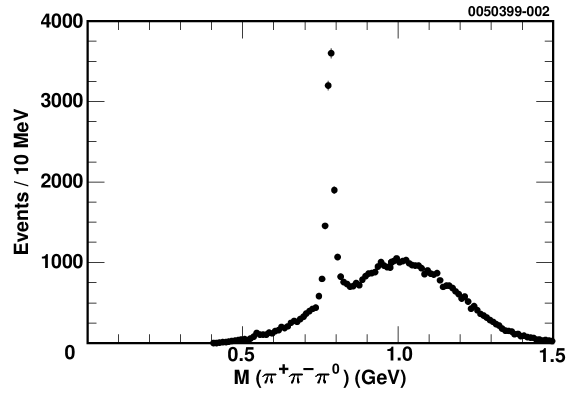
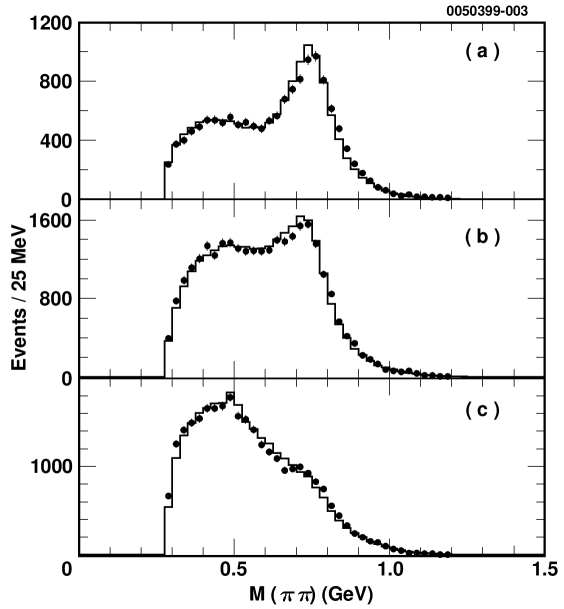
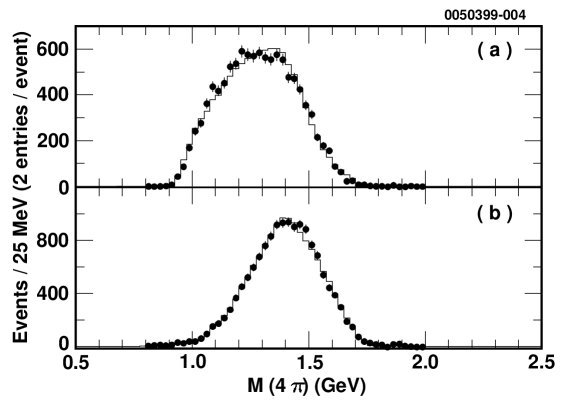
The bulk of the signal is (and charge conjugate). In about 53% of the events there is a combination (Fig. 1) with a mass consistent with the (there are two possibilities per event). The two-pion mass spectra (Fig. 2) for events with no show peaks in ( per event), (17% per event), and ( per event). The overall four-pion mass spectrum (Fig. 3) has a broad maximum around 1.2 to 1.4 GeV for the events, and a peak at 1.4 GeV for the rest of the events. There is no obvious resonance structure in , although the two four-pion spectra fit well each to a sum of , and with adjustable relative amplitudes and phases.
III Analysis
Conservation of energy and momentum imply that
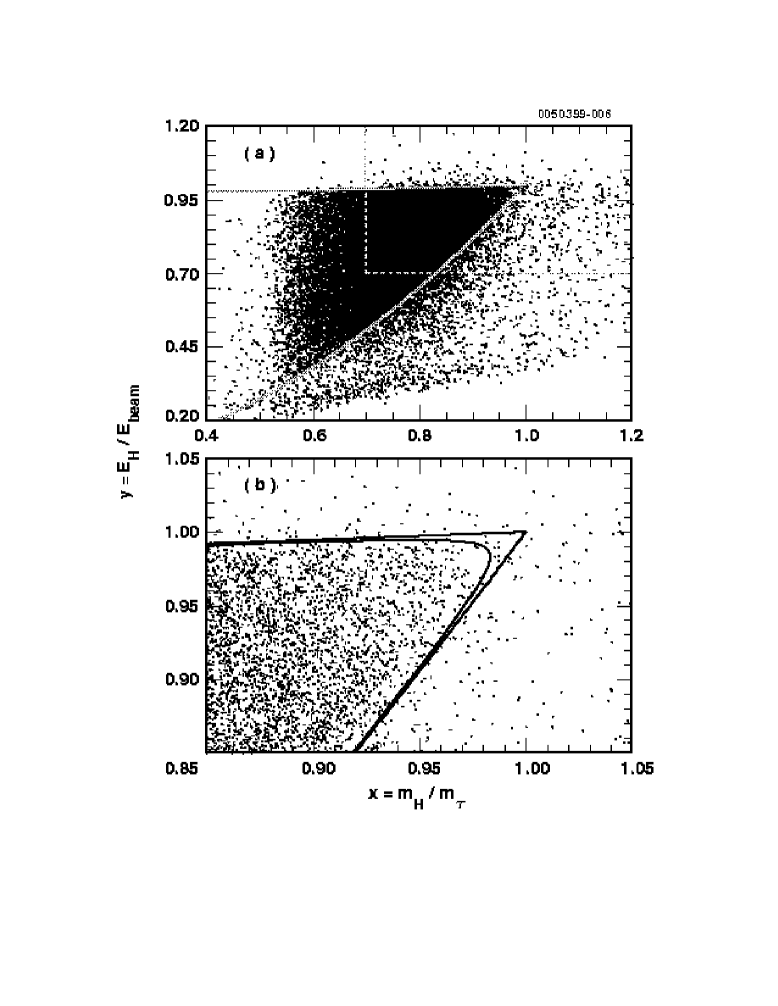
The beam energy and the energy and effective mass of the hadronic (four-pion) system are measured in each event, and MeV is known [9, 10]. Thus if we fix , for each allowed value of the scaled hadronic mass there is a range of kinematically allowed values of the scaled hadronic energy , where the limits are obtained by taking the last term to be at its limits. Figure 4 shows the distribution of the data in and the boundary curves for two values of . Even though there is background outside the kinematically allowed region, it is clear that the two-dimensional distribution of the data is sensitive to the value of . More precisely, the likelihood of the observed event distribution, including background, plotted for various assumed values, can give information on which values are consistent with experiment.
We define the likelihood for an individual event observed at as the probability density of observing such an event assuming to be the neutrino mass. contains terms for signal and backgrounds. The likelihood for the entire data sample is then the product of the event likelihoods:
Signal Likelihood. We first discuss the signal contribution to the single-event probability density . It can be expressed as the product of the spectral function (decay probability density) and detection efficiency at the true , convolved with the experimental resolution function derived from data for that event:
For convenience we have expressed in terms of the spectral function for and a weight function that takes account of the dependence of on . The weight function is determined from the known effect of a non-zero neutrino mass on the phase space and the kinematic boundary. It is zero outside the allowed region.
The spectral function is obtained by adjusting a physics motivated 14-parameter function [8] to match distributions in the simulated data and the real data over the range , where we have verified by Monte Carlo that the choice of does not bias the determination of . The function so determined is then used in the entire range. It includes adjustable amplitudes and phases for and for in all charge combinations. The and mass spectra are each a superposition of , and resonances. The masses and widths of the resonances are fixed. We adjust the parameters by comparing distributions in simulated data, including the effects of detector acceptance and resolution, and in real data with estimated tau and non-tau backgrounds subtracted. Figures 2 and 3 illustrate the goodness of the fit.
We compute the resolution function separately for each event. The scale of the spreading in and , including correlation, is obtained by propagating the resolution error matrices from the individual track and shower fits. We obtain a parametrized non-Gaussian shape from Monte Carlo. The width and shape lead to distributions that match data for the reconstructed mass of , and . The projected distributions of r.m.s. resolutions in hadronic mass and energy peak at 11 and 17 MeV in the region near the kinematic endpoint. By using the resolution function appropriate for each event instead of an averaged one, we diminish the effect of fluctuations from poorly measured events near the kinematic boundary.
We evaluate the integral for each event by Monte Carlo, using a GEANT [11] simulation of physical processes in the CLEO detector. That is, we first generate about 1 million simulated signal events using the KORALB event generator[12], tagged , according to the distribution . Then for each observed real event and for each assumed value of we form the following sum over all the Monte Carlo events that contribute:
We take account of the efficiency factor by omitting the Monte Carlo events that are not detected by the simulated CLEO detector or recognized by the event selection criteria. The Monte Carlo integration technique enables us to include in the effect of initial state radiation, . Radiative events have a lower effective causing them to be produced with lower apparent . Some of them can be seen in Fig. 4 below the lower no-radiation kinematic limit. The Monte Carlo also includes the appropriate number of events from the and -for- substitution modes (see Table II).
Background Likelihood. We distinguish three types of significant background: (a) events from the two-photon process that are not eliminated by our transverse momentum cut, (b) events that do not contain our signal modes, and (c) non- hadronic events from ().
The two-photon events, such as in which the hadronic state has enough transverse momentum to be accepted, form a background at low scaled hadron energy that is difficult to model reliably. Since this kinematic region is insensitive to , the best strategy is to eliminate it from the likelihood fit. The detector efficiency is also less accurately modeled at low and low , so we restrict the fit to 0.7, 0.7. Within this region the two-photon background can be neglected, and the detailed choice of boundary has no influence on the limit. The cut reduces the number of data events used in the fit to 16,577.
Tau decays of higher or lower multiplicity can masquerade as our signal mode if particles escape undetected and/or secondaries in the CsI crystal array are misinterpreted as photons from a . We evaluate these and other mis-reconstruction effects by Monte Carlo simulation of the response of the CLEO detector to 12 million events generated with the known branching fractions. Of the accepted data events in the fit region, 7.3% are from tau background. They are mainly with a spurious .
Although most hadronic annihilation events are rejected by our one-versus-three charged track criterion, some of them can survive. The contamination in our data sample was evaluated by a 36-million event Monte Carlo simulation using the LUND[13] generator. The simulation has been extensively tuned to produce results that agree with experiment. In particular, we have verified the agreement between data and Monte Carlo for the events satisfying the one-versus-three topology but having a tag with an energy that could not come from decay, and for the events that have values well above the kinematic limit for the signal mode. The background accounts for 3.1% of the accepted data events in the fit region.
The calculation of the background contribution to the individual event likelihood is similar to the calculation of . However, since the expected background event distribution (the analog of ) can be expressed only in terms of observed , it is not appropriate to integrate over the experimental resolution function; its effect is already contained in the distribution. As the distribution is not an analytic function, but a collection of simulated events with a rather smooth distribution, we approximate the value of for the -th data event by the number (appropriately weighted) of and background Monte Carlo events per unit area in the vicinity of . This is of course independent of .
We sum the signal and background likelihoods for each event and take the product over all events in the region , to form the net likelihood . This is repeated for a range of assumed values to obtain .***A Poisson coefficient expressing the dependence of the number of observed events on (as used in ref. [14]) is not used here because the large number of events in the fit region of this work is insensitive to the neutrino mass scale in question. The overall normalization of is arbitrary.
IV Results
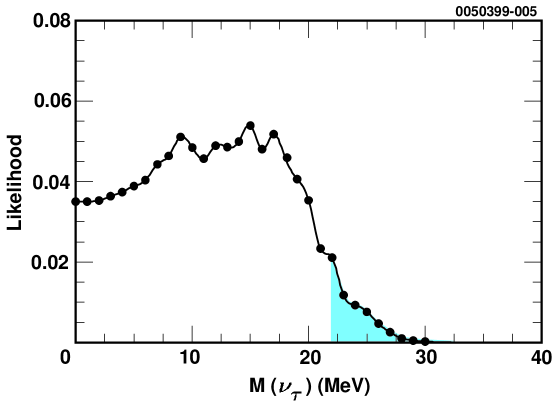
Figure 5(a) shows the likelihood as a function of assumed neutrino mass. The integral under the curve beyond 22 MeV is 5% of the total. Before interpreting this as a 95% upper limit on , however, we have to consider systematic uncertainties that could affect the limit.
The CLEO charged particle momentum measurement scale is uncertain by about 0.05%, and the energy scale is uncertain by 0.25%. This shows up as a potential mismatch between Monte Carlo and data, resulting in a distortion in . Variations in scale of these magnitudes cause a shift of 5.0 MeV in the 95% limit, when the two effects are combined in quadrature.
The four-pion spectral function was determined by varying the contributions of the , , and to match the data below , then extrapolating into the region sensitive to . †††Note that if we were to force the spectral function to agree with the data all the way to the kinematic end point (), we would get a (biased) 95% limit of 17 MeV for . This is significant in that it represents the lowest limit one could a priori expect to obtain with the given statistical accuracy and background, assuming . The resulting likelihood function (Fig. 5) is sensitive mainly to the parameters describing the . If we vary the amplitude within the experimental accuracy of our matching and the mass and width within their experimental errors, we can raise the 95% likelihood limit by 4 MeV.
The effects of other systematic uncertainties have been similarly evaluated. The resulting shifts of the 95% limit on are listed in Table III. Assuming that the various effects are independent, we combine the limit shifts in quadrature to get a net systematic shift of 6.4 MeV. Following the practice in reports of previous experiments on limits, we add this shift linearly to the raw limit from Fig. 5:
An important difference between this measurement and mass limits from previous experiments is the size of the event sample used. We observe 543 events in the sensitive portion of the kinematically allowed region, . This and the fact that we include background in the fit lead to a limit that has little sensitivity to chance fluctuations in the population of individual events near the endpoint. Although this experiment has its own statistical and systematic uncertainties that prevent a significant improvement in the limit value, the analysis is quite complementary to previous low statistics experiments and confirms their conclusions.
Both this measurement and the previous CLEO measurement [14] using show a broad likelihood maximum near the higher end of the allowed range of the tau neutrino mass. Since such a behavior is not unlikely even if (as verified by Monte Carlo experiments), we do not regard it as significant. It does imply, however, that combining the results of the two CLEO measurements to make a joint likelihood curve does not significantly improve the mass limit.
V Acknowledgments
We gratefully acknowledge the effort of the CESR staff in providing us with excellent luminosity and running conditions. J.R. Patterson and I.P.J. Shipsey thank the NYI program of the NSF, M. Selen thanks the PFF program of the NSF, M. Selen and H. Yamamoto thank the OJI program of DOE, J.R. Patterson, K. Honscheid, M. Selen and V. Sharma thank the A.P. Sloan Foundation, M. Selen and V. Sharma thank Research Corporation, S. von Dombrowski thanks the Swiss National Science Foundation, and H. Schwarthoff thanks the Alexander von Humboldt Stiftung for support. This work was supported by the National Science Foundation, the U.S. Department of Energy, and the Natural Sciences and Engineering Research Council of Canada.
REFERENCES
- [1] S. P. Mikheyev and A. Y. Smirnov, Sov. J. Nucl. Phys. 47, 2220 (1993); C. Athanassopoulos et al., Phys. Rev. Lett. 75, 2650 (1995) and 77, 3082 (1996).
- [2] Y. Fukuda et al., Phys. Rev. Lett. 81, 1562 (1998).
- [3] S.S. Gershtein and Ya.B. Zeldovich, JETP Lett. 4, 174 (1966); R. Cowsik and J. McClelland, Phys. Rev. Lett. 29, 669 (1972); A.S. Szalay and G. Marx, Astron. and Astrophys. 49, 437 (1976); P.J.E. Peebles, Physical Cosmology, Princeton University Press, Princeton, 1993.
- [4] M. Kawasaki et al., Nucl. Phys. B 419, 105 (1994); J.B. Rehm, G.G. Raffelt, and A. Weiss, Astronomy and Astrophysics 327, 443 (1997).
- [5] J. Swain and L. Taylor, in “Proceedings of the Fourth Workshop on Tau Lepton Physics,” ed. by J. Smith and W. Toki, Nucl. Phys. B (Proc. Suppl.) 55, 121 (1997).
- [6] M. Gell-Mann, P. Ramond, and R. Slansky, in “Supergravity,” ed. by D. Freedman and P. van Nieuwenhuizen, North Holland, Amsterdam (1979); T. Yanagida, in “Proceedings of the Workshop on Unified Theory and Baryon Number in the Universe,” ed. by O. Sawada and A. Sugamoto, KEK, Tsukuba, Japan (1979); R. Mohapatra and G. Senjanovic, Phys. Rev. Lett. 44, 912 (1980); ibid., Phys. Rev. D 23, 161 (1981).
- [7] Y. Kubota et al. (CLEO), Nucl. Instrum. Methods Phys. Res., Sec. A 320, 66 (1992).
- [8] D. S. Crowcroft, Cornell University Ph.D. thesis, August, 1998.
- [9] Particle Data Group, Eur. Phys. J. C3, 1 (1998).
- [10] J.Z. Bai et al. (BES), Phys. Rev. D 53, 20 (1996).
- [11] R. Brun et al, GEANT v. 3.15, CERN DD/EE/84-1.
- [12] KORALB (v.2.2) / TAUOLA (v.2.4): S. Jadach and Z. Was, Comput. Phys. Commun. 36, 191 (1985); 64, 267 (1991); S. Jadach, J.H. Kühn, and Z. Was, ibid. 64, 275 (1991); 70, 69 (1992), 76, 361 (1993).
- [13] LUND 7.3: S. Sjöstrand, CERN-TH-6488-92 (1992).
- [14] CLEO Collaboration, R. Ammar et al. , Phys. Lett. B431, 209 (1998).
- [15] ALEPH Collaboration, R. Barate et al., Eur. Phys. J. C2, 395 (1998).
- [16] OPAL Collaboration, K. Ackerstaff et al., Eur. Phys. J. C5, 229 (1998).
- [17] ARGUS Collaboration, H. Albrecht et al., Phys. Lett. B292, 221 (1992).
| Experiment | Ref. | Decay | MeV |
|---|---|---|---|
| ALEPH | ref. [15] | 25.7 | |
| 23.1 | |||
| OPAL | ref. [16] | 43.2 | |
| 35.3 | |||
| ARGUS | ref. [17] | 31 | |
| CLEO | ref. [14] | 30 | |
| this analysis | 28 |
| Decay mode | % of signal |
|---|---|
| 92 | |
| 3 | |
| 1.6 | |
| 1.5 | |
| 1.1 | |
| 0.5 | |
| 0.2 |
| Source | MeV |
|---|---|
| energy scale | 3.7 |
| Track momentum scale | 3.3 |
| Spectral function | 4.0 |
| and background corrections | 0.8 |
| Monte Carlo statistics | 0.5 |
| Resolution function | 0.4 |
| Quadrature sum | 6.4 |