Effect on a Hadron Shower Leakage on the Energy Response and Resolution of Hadron TILE Calorimeter
Y.A. Kulchitsky, V.S. Rumyantsev
Institute of Physics, Academy of Sciences, Minsk, Belarus
& JINR, Dubna, Russia
J.A. Budagov, V.B. Vinogradov
JINR, Dubna, Russia
G. Karapetian, M. Nessi
CERN, Geneva, Switzerland
A.A. Bogush
Institute of Physics, Academy of Sciences, Minsk, Belarus
Abstract
The hadronic shower longitudinal and lateral leakages and its effect on the pion response and energy resolution of iron-scintillator barrel hadron prototype calorimeter with longitudinal tile configuration with a thickness of nuclear interaction lengths have been investigated. The results are based on pion beam data at incidence angle at impact point in the range from to which were obtained during test beam period in May 1995 with setup equipped scintillator detector planes placed behind and back of the calorimeter. The fraction of the energy of pions at leaking out at the back of this calorimeter amounts to and agrees with the one for a conventional iron-scintillator calorimeter. Unexpected behaviour of the energy resolution as a function of leakage is observed: lateral leakage lead to improving of energy resolution in compare with the showers without leakage. The measured values of longitudinal punchthrough probability and for two different hit definitions of leaking events agree with the earlier measurement for our calorimeter and with the one for a conventional iron-scintillator calorimeter with the same nuclear interaction length thickness respectively. Due to more soft for hit definition in the leakage detectors the measured value of longitudinal punchthrough probability more corresponds to the calculated iron equivalent length .
1 Introduction
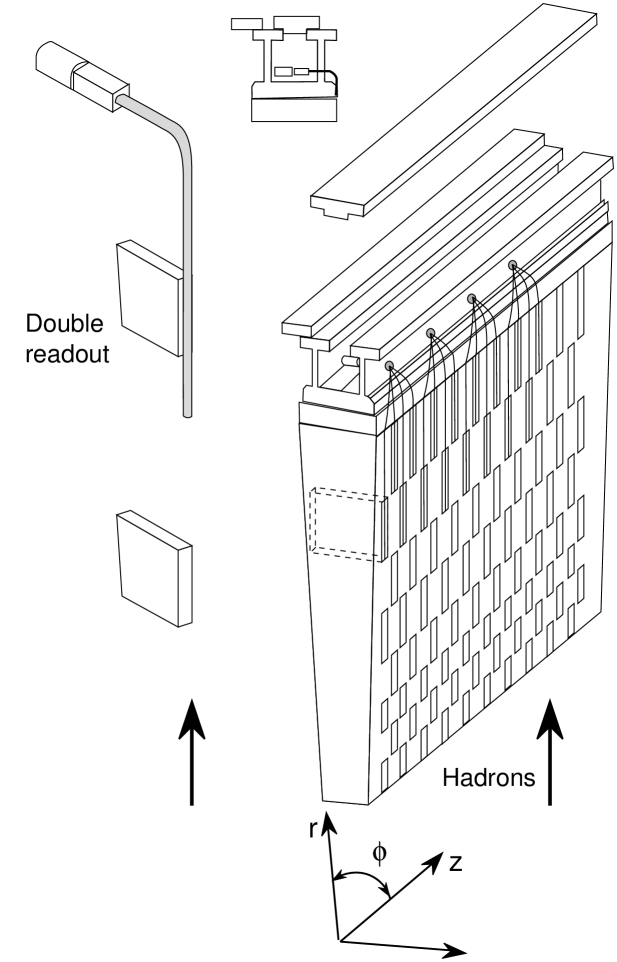
Due to limited dimensions of calorimeters one from important questions of calorimetry concerns the energy leakage and related with it the deterioration of energy resolution, appearance of tails in the energy distributions and ultimately the deterioration of the quality obtained physics information. In this article we report on the results of the experimental study of hadronic shower leakage effects on the pion response and energy resolution of barrel hadron prototype calorimeter [1]. Because this calorimeter has innovative concept of longitudinal segmentation of active and passive layers (see Fig. 1), the measurement of hadron showers leakage is of special interest [2]. This investigation was performed on the basis of data from pion exposure of the prototype calorimeter at the beam of the at different impact points in the range from to with step ( scan) at incident angle which were obtained in May 1995. Earlier some results related with leakage for this calorimeter were obtained in [3], [4], [5].
2 The Prototype Calorimeter
The prototype calorimeter is composed of five sector modules, each spanning in azimuth, in the axial () direction, in the radial direction, and with a front face of [3]. The iron structure of each module consists of 57 repeated “periods”. Each period is thick and consists of four layers. The first and third layers are formed by large trapezoidal steel plates (master plates), thick and spanning the full radial dimension of the module. In the second and fourth layers, smaller trapezoidal steel plates (spacer plates) and scintillator tiles alternate along the radial direction. The spacer plates are thick and of 11 different sizes. Scintillator tiles are thickness. The iron to scintillator ratio is 4.67:1 by volume. The calorimeter thickness at incidence angle corresponds to of iron equivalent (9.4 nuclear interaction length) [5].
Radially oriented fibres collect light from the tiles at both of their open edges and bring it to photo-multipliers () at the periphery of the calorimeter. Each views a specific group of tiles, through the corresponding bundle of fibres. With this readout scheme three-dimensional segmentation is immediately obtained.
Tiles of 18 different shapes all have the same radial dimensions (). The prototype calorimeter is radially segmented into four depth segments by grouping fibres from different tiles. Proceeding outward in radius, the three smallest tiles, are grouped into section , into section , into section and into section . The readout cell width in direction is about .
3 Test Beam Layout
The five modules have been positioned on a scanning table, able to allow high precision movements along any direction. Upstream of the calorimeter, a trigger counter telescope was installed, defining a beam spot of diameter. Two delay-line wire chambers, each with , readout, allowed to reconstruct the impact point of beam particles on the calorimeter face to better than [7]. For the detection of the hadronic shower longitudinal and lateral leakages backward () and side () “” punchthrough detector were placed behind and at the right side of the calorimeter modules [8]. Basic elements of “” are plastic scintillator detectors with dimensions which are read-out by 2-inch photomultipliers . The tag of given (longitudinal or lateral) leakage is at least one hit in corresponding “”. Due to the number of photoelectrons in any scintillator counter of walls is roughly per minimum ionising particle “” detected charged particles with high efficiency. As a result we have for each event 200 values of charges from properly calibrated [3] with pedestal subtracted.
4 Results
runs contained events with various coordinates have been analysed. The treatment was carried out using program [9].
The scintillator detector planes behind and back of the calorimeter give us possibility to select the event samples at different conditions: “no leakage”, only “longitudinal leakage”, only “lateral leakage”, “longitudinal and lateral leakages” simultaneously.
In this section the following issues are discussed:
-
1.
punchthrough probability,
-
2.
energy leakage,
-
3.
the effect of leakage on energy resolution.
First of all we determine the value of punchthrough probability.
4.1 Longitudinal punchthrough probability
By definition [8], [10], [11] the total hadronic punchthrough probability is the ratio of the number of events giving at least one hit in the punchthrough detector to the total number of trigger beam particles. It seems that the information needed is simple: hit or no hit. But there are some problems in definition of hit (see, for example, discussion [10]). In Fig. 2 our spectra one of “” counter ( in Fig. 3 [8]) in beam (top) and in beam (bottom) are shown. Spectrum in beam look similar to simulated distribution for iron-scintillator calorimeter [11] as obtained by Monte Carlo calculations with (Fig. 14 from [10]). The region left from minimum ionising single particle distribution is related with the contribution of neutrons as punchthrough particles [10].
We used two cuts:
-
1.
, where — the beginning of Landau distribution for -counter,
-
2.
(naturally after pedestal subtraction).
Note that the results of are not so much distinguished from a cut used in [5] .
We think that is more correct since it does not reject events with leakage. In following for the spectra analysis we use this .
The results are given in Table 1, where in the last raw longitudinal punchthrough probability for different cuts corrected on value of acceptance of the shower leakage detector [5] are presented.
| Type | Alias | |||
| % | % | % | ||
| no leak. | 72.0 | 62.0 | ||
| lon. leak. | 10.0 | 9.4 | ||
| lat. leak. | 14.0 | 22.6 | 61. | |
| lon. & lat. leak. | 3.6 | 6.0 | 67. | |
| all long. leak. | 13.6 | 15.4 | 13. | |
| punchthrough prob. | 18.1. | 20.1. |
As can be seen from this Table is more soft relative to leakage and leads to decreasing of the events sample “no leakage” and to increasing of event sample with leakage. Especially the events sample with “longitudinal and lateral leakage” are increased (on ).
4.2 Energy response and leakage
There are a few methods for evaluating of an energy leakage in calorimetry. For example, in [13] an additional “leakage” calorimeter was used for this purpose special. In [14], [15] the shower containment was measured by using the abundant longitudinal segmentation information. Since we do not have such possibilities the following method was used. We reconstruct the sum of initial energies of showers, , by using the detected energies of the event sample “no leakage”, , and the fraction of these events, :
| (1) |
where , — number of the event sample “no leakage”, — number of the event sample “all longitudinal leakage”.
The relative missing leakage energy is equal to:
| (2) |
where — energies of the event sample “longitudinal leakage”.
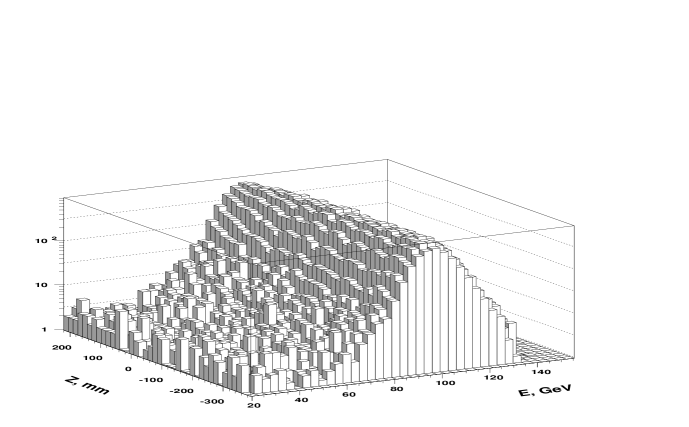
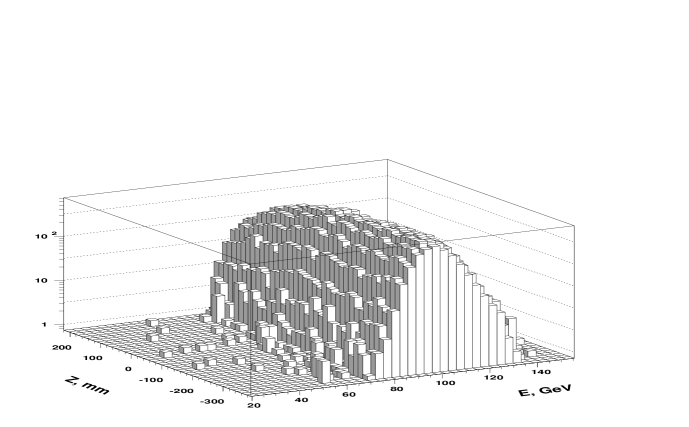
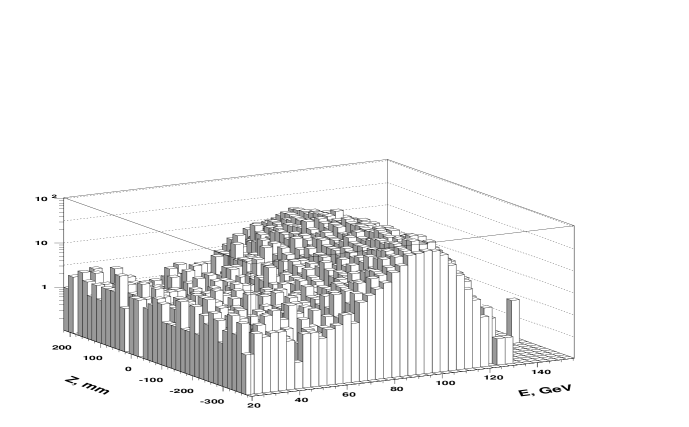
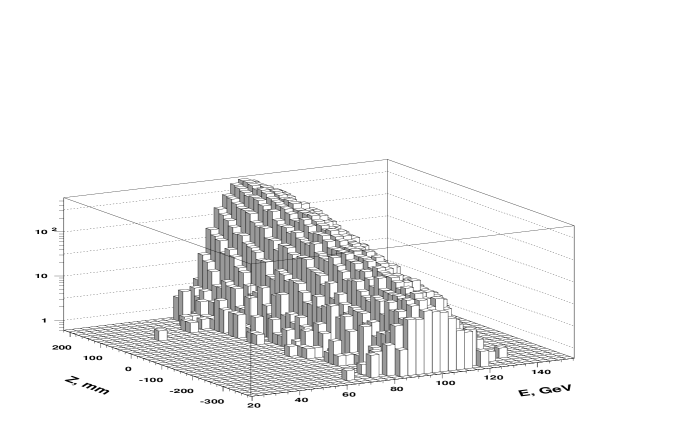
In Fig.’s 3 and 4 two-dimensional spectra of energy responses as a function of coordinate and energy are shown. Fig.’s 5 and 6 show the corresponding energy responses for events with all at different leakage conditions. To map the energy in scale the constant equal to / was used, where is the mean energy response for event sample “no leakage”. From these figures general behaviour of energy response can be observed. It is seen that distributions for event samples “no leakage” and “lateral leakage” have almost behaviour, the distribution for event sample “longitudinal leakage” have the clear low energy tail and in the distribution for event sample “lateral leakage” the maximum amplitude increases with increasing of . The obtained mean responses, relative resolutions as well as the values of leakages and tails are given in Table 2, where
| (3) |
“no leakage”, “longitudinal leakage”, “lateral leakage”, “longitudinal and lateral leakages”, “all events”. The estimate of tail is defined as an excess of the events over curve in the region more than one sigma.
| Type | % | E | Low tail | High tail | |||
|---|---|---|---|---|---|---|---|
| Events | % | % | % | % | % | ||
| no leak. | 62.0 | 100. | 7.4 | 0.0 | 0.0 | 0.0 | 2.60.05 |
| lon. leak. | 9.4 | 91.0 | 10.4 | 41. | 9.0 | 7.10.2 | 0.0 |
| lat. leak. | 22.6 | 96.8 | 7.2 | 3.2 | 0.0 | 1.10.05 | |
| lon. & lat.leak. | 6.0 | 88.3 | 10.7 | 45. | 11.7 | 6.10.2 | 0.0 |
| all events | 100. | 97.7 | 8.3 | 13. | 2.3 | 1.50.03 | 1.30.02 |
| Type | % | E | Low tail | High tail | |||
|---|---|---|---|---|---|---|---|
| Events | % | % | % | % | % | ||
| no leak. | 71.3 | 100. | 7.3 | 0.0 | 0.0 | 0.0 | 2.70.2 |
| lon. leak. | 11.1 | 91.0 | 9.9 | 35. | 9.0 | 6.70.7 | 0.0 |
| lat. leak. | 14.2 | 98.8 | 7.1 | 1.2 | 0.0 | 1.70.3 | |
| lon. & lat.leak. | 3.3 | 89.5 | 8.8 | 20. | 10.5 | 12.2. | 0.0 |
| all events | 100 | 98.4 | 9.8 | 7.9 | 1.6 | 1.50.1 | 1.30.1 |
Fig.’s 7 and 8 show the energy distributions for event samples with various leakage conditions at . The characteristics of these distributions are given in Table 3. The event samples — “any leakage”, “longitudinal leakage”, “longitudinal and lateral leakages” have the low energy tails, the event samples — “no leakage” and “lateral leakage” have the high energy tails. The events sample with leakage naturally have the low energy tail. The high energy tail in the event sample “no leakage” was explained in [16] by contribution of showers with unusually large electromagnetic component. The unexpected high energy tail in the event sample “lateral leakage” may be explained as these events are the events of type “no leakage” with some leakage unsufficient to cut the high energy tail.
In Fig. 9 are shown the mean energy responses for events with different types of leakage obtained by averaging of energy spectra (top) and fits (bottom) as a function of coordinate at different leakage conditions. In Table 4 are given the results of averaging of these dependences in the uniformity ranges.
| Type | E | |||||
|---|---|---|---|---|---|---|
| % | % | % | % | |||
| no leak. | 100.0.02 | 99.70.02 | 8.00.02 | 7.40.02 | 0.0 | 0.0 |
| lon. lk. | 91.10.12 | 94.00.08 | 16.20.1 | 9.70.07 | 8.90.1 | 31.00.8 |
| lat. lk.∗ | 98.30.06 | 98.10.06 | 7.60.03 | 7.30.03 | 1.70.1 | - |
| all ev.∗ | 98.50.02 | 98.80.02 | 9.90.02 | 8.00.02 | 1.50.1 | 8.10.4 |
| ∗ For events with . | ||||||
The fraction of the energy leaking out from the backward side of this calorimeter calculated by the formula (2) amounts to and agrees with the value for measured in [15].
It should be noted that of the events have the energy longitudinal leakage and of the events of energy () leaking out at average. The latter estimate is extracted from the low energy tail in Fig. 6 (top). This fact must be taken into account in searching of new particles in future experiments.
We also considered the question concerning nonuniformity response of calorimeter. As can be seen in Fig. 9 the energy response as a function of coordinate from event sample “no leakage” is more uniform than the one for other event types. It is allows to estimate the more extended range of uniformity (from to ) than in [3] which appears equal to ().
4.3 Influence of leakage on the energy resolution
Fig. 10 shows the relative energy resolutions obtained by fitting of spectra (top) and the relative energy resolutions (/E) obtained by averaging of spectra (bottom) as a function of coordinate at different leakage conditions. Fig. 11 shows the same normalised to average value of () over the uniformity range for events without leakage. One can see that due to the tails the resolutions obtained by averaging are much greater (approximately in two times for events with longitudinal leakage) than ones obtained by fitting. The results of averaged by in their uniformity range of Fig.’s 9, 10, 11 are given in Table 4. As can be seen longitudinal energy leakage amounts , but deterioration of energy resolution for the same case amounts . The general degradation of the resolution with increasing of leakage is in agreement with earlier observations [13], [16], [17], [18]. Moreover, our energy resolution degradation is in reasonable agreement with the parameterisation proposed by [19] on the basis of the data from collaboration [20]:
| (4) |
where and — energy and energy resolution for events without leakage, and — energy and energy resolution for events with “longitudinal leakage”. In our case for the value of energy resolution degradation from (4) we obtain .
In the case of lateral leakage the unexpected inverse behaviour is observed: energy leakage leads to some improving of the resolution. Let us consider this in more detail. In Fig. 12 two distributions of the lateral leakage are shown: lateral energy leakage (top), energy resolution () (bottom) for the event sample with lateral leakage as a function of coordinate.
Fig. 13 presents the energy resolution as a function of lateral leakage for this event sample. As can be seen the energy resolution improves with increasing lateral energy leakage at least to the value of lateral energy leakage equal to at where energy resolution is improving to .
This phenomenon can be explained as follows. The hadronic shower consists of electromagnetic and pure hadronic parts and the electromagnetic part in lateral direction places in the central core [17], [21]. So by cutting some lateral hadronic part we “improve” the shower properties, make it less fluctuating. However this may be the specific property of our calorimeter.
5 Conclusions
We have investigated the hadronic shower longitudinal and lateral leakages and its effect on the pion response and energy resolution on the basis of pion beam data at incidence angle at impact points in the range from to .
Some results are following:
-
•
The fraction of the energy of pions at leaking out at the back of this calorimeter amounts to and agrees with the one for a conventional iron-scintillator calorimeter.
-
•
Unexpected behaviour of the energy resolution as a function of leakage is observed: lateral leakage leads to improving of energy resolution in compare to events with the showers without leakage.
- •
6 Acknowledgements
This work is the result of the efforts of many people from ATLAS Collaboration. The authors are greatly indebted to all Collaboration for their test beam setup and data taking.
Authors are grateful Peter Jenni and Nikolai Russakovich for their attention and support of this work. We are indebted to Martin Bosman, Mateo Cavalli-Sforza, Ana Henriques and Stanislav Tokar for the valuable discussions and constructive advices. The authors would like to thank Stanislav Nemecek for giving the numerical value of acceptance for “muon wall” for at and valuable discussions.
References
- [1] ATLAS Collaboration, CERN/LHCC/94-93, ATLAS Technical Proposal for a General-Purpose experiment at the Large Hadron Collider CERN, 1994, CERN, Geneva, Switzerland.
- [2] O. Gildemeister, F. Nessi-Tedaldi and M. Nessi, Proc. 2nd Int. Conf. on Cal. in HEP, Capri, 1991, Italy.
- [3] E. Berger et al., CERN/LHCC 95-44, Construction and Performance of an Iron-Scintillator Hadron Calorimeter with Longitudinal Tile Configuration, 1995, CERN, Geneva, Switzerland.
- [4] M. Bosman, J. Pilcher, H. Plothow-Besch, M. Cobal et al., Effect of the Tile Calorimeter thickness in the ATLAS Barrel Calorimeter Performance, ATLAS Internal Note, TILECAL-No-71, 1995, CERN, Geneva, Switzerland.
- [5] M. Lokajicek, S. Nemecek et al., Measurement of pion showers longitudinal leakage in the TILECAL prototype, ATLAS Internal Note, TILECAL-No-64, 1995, CERN, Geneva, Switzerland.
- [6] J.A. Budagov, Y.A. Kulchitsky, V.B. Vinogradov, M. Nessi et al., ATLAS Internal Note, TILECAL-No-72, 1996, CERN, Geneva, Switzerland; preprint JINR, E1-95-513, 1995, Dubna, Russia.
- [7] F. Ariztizabal et al., NIM A349 (1994) 384.
- [8] M. Lokajicek, S. Nemecek et al., Scintillation detector “muon wall” for measurements of charged particles leakage from the TILECAL prototype, ATLAS Internal Note, TILECAL-No-63, 1995, CERN, Geneva, Switzerland.
- [9] I. Efthymiopoulos, A. Solodkov, The TILECAL Program for Test Beam Data Analysis, User Manual, 1995, CERN, Geneva, Switzerland.
- [10] H. Fesefeldt et al., NIM A292 (1990) 279.
- [11] F.S. Merrit et al., NIM A245 (1986) 27.
- [12] RD5 Collaboration, Z.Phys. C60 (1993) 1; CERN-PPE/95-61, 1995, CERN, Geneva, Switzerland.
- [13] D. Acosta et al., NIM A308 (1991) 481.
- [14] H. Abramowicz et al., NIM 180 (1981) 429.
- [15] E. Huges, Proceedings of the First Int. Conf. on Calorimetry in HEP, p. 525, 1990, FNAL, Batavia, USA.
- [16] U. Amaldi, Phys. Scripta 23 (1981) 409.
- [17] F. Barreiro et al., NIM A292 (1990) 259.
- [18] A.M. Henriques, Dissertation, Univ. of Lisbon, 1993, Lisbon, Portugal.
- [19] D. Green et al., Depth requirements of SSC calorimeters, Solenoidal Detector Collaboration Note SDC-91-16, 1991, Dallas, USA.
- [20] F. Sculli, Calorimeter Workshop, May 1975, Fermilab, USA.
- [21] D. Acosta et al., NIM A316 (1992) 184.
 |
 |
 |
 |
 |
 |
 |
 |
 |
 |
 |
 |
 |
 |
 |
 |
 |
 |
 |
 |
 |
 |
 |