Recent Electroweak Results from the Tevatron
Abstract
Recent electroweak results from the CDF and DØ Collaborations at the Fermilab Tevatron Collider are presented. After a brief description of the DØ measurements of production cross sections, width, mass and decays, the CDF result on distribution is outlined. The comprehensive search for anomalous gauge couplings by DØ in 1992-96 data is presented along with a detailed description of the channel.
I Introduction
The CDF [1] and DØ [2] collaborations at the Fermilab Tevatron collider collected data during Run I (1992-96) at TeV corresponding to an integrated luminosity of about 130 for each experiment. The large number of and bosons detected in the electron and muon channels were used to make precise measurements of their properties. The decay was studied by both experiment to measure the ratio . Using the Run I data, DØ has made a comprehensive search for anomalous trilinear gauge couplings in 12 different diboson channels and has combined them to produce some of the most stringent anomalous gauge coupling limits in the world so far.
Run I was divided into three different sections: Run 1A - 1992-93 (); Run 1B - 1993-95 (); Run 1C - 1995-96 (). After a brief review of and properties in Section II, the DØ search for anomalous gauge couplings in the diboson final states is presented in Section III.
II Electroweak Measurements
A and Boson Production
Due to cleaner signatures and lower backgrounds, the and bosons are detected via their leptonic decays: and . The event selection requires an electron (muon) with 25 (20) GeV/c and 25 (20) GeV in the event. For selection, the requirement is replaced by that of a similar second lepton. The backgrounds for the electron sample are mainly due to QCD fakes (5.7%), decays (1.8%) and one-legged decays (0.6%). The total background for the sample is 19.8% including cosmic muons. The and samples contain 4.8% and 11.6% backgrounds respectively with additional contributions from Drell-Yan pairs and combinatorics.
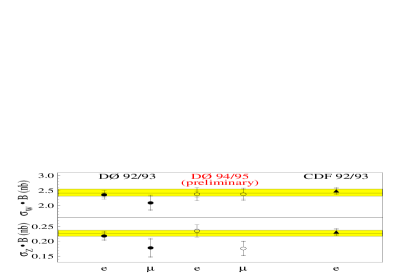
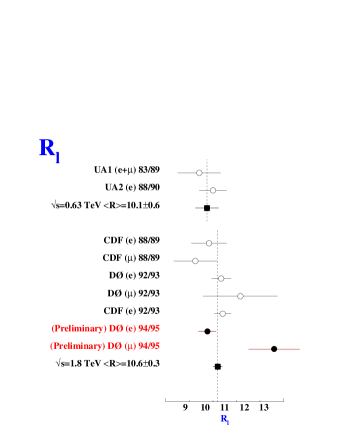
The recent and cross section results from CDF and DØ are shown in Figure 1 and are compared to the theoretical QCD prediction [3]. When the ratio of and cross sections is computed many uncertainties cancel and an indirect measurement of the width can be made:
With the measured ratio of , a value of is obtained from the above equation by using the a theoretical calculation of , the precise measurement of from LEP, and the theoretical computation of . A comparison of measurements is shown in Figure 1 along with the Tevatron average. An updated and expanded production results can be found in reference [4].
B Mass
The boson mass is a fundamental parameter of the Standard Model. In the on shell scheme:
where is the Z boson mass, is the fine structure constant, is the weak mixing angle, is the Fermi coupling constant and denotes the radiative corrections. The is sensitive to masses of particles such as the Higgs boson, top quark and other new particles. Therefore, a precision measurement of the can be used for constraining the Higgs mass or probing the presence of new physics beyond the SM [5].
The mass is measured using the decay with a total luminosity of . As an unknown amount of energy goes down the beam pipe in the forward and backward directions, the remains uncertain. Hence, the mass is determined using a likelihood fit to the transverse mass . A similar procedure is applied to and as cross checks.
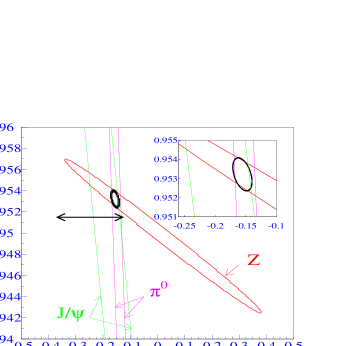
The event selection and backgrounds are similar to the cross section measurement. Event selection with a high quality isolated electron in the central region with GeV/c, 25 GeV and hadronic recoil 15-20 GeV/c leads to a final sample of about 28,000 events. The depends on the recoil momentum of the electron and hadrons which relies on the detailed understanding and modelling of the leptonic and hadronic energy scales. The DØ electromagnetic energy scale was calibrated using the constraints from decays and as shown in Figure 2 where and are given by . A complete list of uncertainities contributing to the mass measurement is listed in Table I.
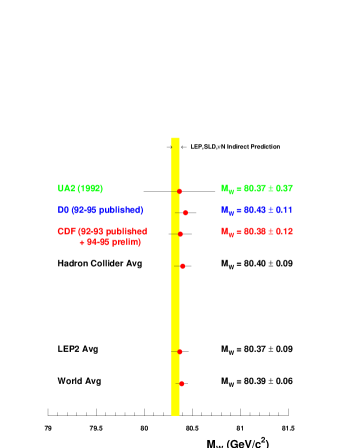
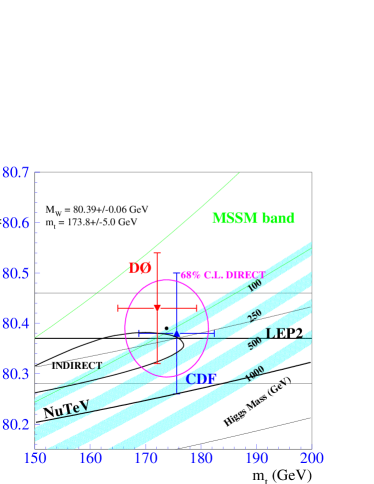
The fit to the distribution is shown in Figure 2. The arrows indicate the fitted region for the final measurement and the shaded region represents background in the sample. The results from the and fits using the Run 1B data are and GeV/ respectively. Combining with the 1A measurement, DØ 1A + 1B: GeV/. A summary of direct measurements is shown in Figure 3 along with the world average. Figure 3 also illustrates the constraints imposed by the direct measurements of and by CDF and DØ on the mass of the Higgs boson. Also shown are the indirect SLC/LEP2 and NuTev [6] measurements and the prediction of the Minimal Supersymmetric Model (MSSM). An update DØ mass measurements including forward detectors can be found in reference [4].
| Source | Fit | Fit | Source | Fit | Fit |
|---|---|---|---|---|---|
| Statistics | 70 | 85 | Electron Energy Scale | 65 | 65 |
| Calorimeter Linearity | 20 | 20 | Calorimeter Uniformity | 10 | 10 |
| Electron Energy Resolution | 25 | 15 | Electron Angle Calibration | 30 | 30 |
| Electron Removal | 15 | 15 | Selection Bias | 5 | 10 |
| Hadronic Recoil Modelling | 30 | 20 | Input and PDF’s | 25 | 70 |
| Radiative Decays | 15 | 15 | Backgrounds | 10 | 20 |
| Total Statistical | 95 | 105 | Total Systematics | 70 | 90 |
![[Uncaptioned image]](/html/hep-ex/9903038/assets/x4.png)
C and
Both CDF and DØ have measured production in the mode where decays hadronically. The signature of hadronic decay of the is an isolated narrow jet composed of highly boosted decay products. The event selection requires GeV/c and 25 GeV. The signal and QCD backgrounds ( 20%) are estimated using the profile distribution (fractional in the two hottest towers of the jet). The DØ preliminary results are nb and .
The CDF collaboration having a silicon vertex detector has used the decay to measure . The technique is based on the difference in electron impact parameter distributions in a sample of single electron events composed of decays, decays and QCD backgrounds. A likelihood fit to the branching fraction is performed using where the relevant impact parameter distributions are extracted from Monte Carlo and from QCD data. The results are and consistent with hadronic decay measurements and universality.
D Distribution
The CDF collaboration has measured the distribution in the decay mode using Run I data (). The measurement goals are to test perturbative QCD at large ( 20 GeV/c) and differentiate gluon resummation techniques [7] (such as q-t-space vs b-space) at small ( 10 GeV/c). Moreover the knowledge of the production is essential for the search for new physics and is a source of systematics for the measurements of , etc. The event selection demands an electron with 25 GeV/c and 25 GeV. The major backgrounds ( 15%) are due to QCD electron fakes, and the one-legged decays of .
![[Uncaptioned image]](/html/hep-ex/9903038/assets/x7.png)

The distribution using qt-space gluon resummation technique is shown in Figure 4. Figure 4 also displays the ratio (data-theory)/theory vs for both resummation techniques. The theory distributions used are obtained by adding the single boson backgrounds and are smeared with detector resolutions while the data distributions are after the subtraction of the QCD background. Both resummation techniques agree with data up to 120 GeV. At higher region, there appears to be some discrepancy as in the case of CDF data [8]. The recently completed DØ measurements can be found in reference [9].
III Search for Anomalous Gauge Couplings
The effective CP conserving Lagrangian for the description of
anomalous gauge couplings (AGC) is given by [10]:
where V = Z, . If CP violating terms are allowed,
three additional terms will appear in the above Langrangian. The
overall couplings are defined as = e
and = e cot. At tree level in the SM, the parameters
are uniquely determined: . For
on-shell photons, and are fixed by
electromagnetic gauge invariance while and may, however,
differ from their SM values. The deviations from tree level SM values
can be cast as: . Most theoretical arguments suggest that these
anomalous couplings are significant at where
is the scale of new physics. To avoid unitarity violations
the coupling parameters should be expressed as form factors such as:
with as the form factor
scale. The tree level Feynman diagrams for
production at the Tevatron are shown in
Figure 5.
Limits on these couplings are usually obtained under the assumption of equal couplings for and , and . In the literature, another set of relations is frequently used, the HISZ relations [11] where the and couplings are related by: .
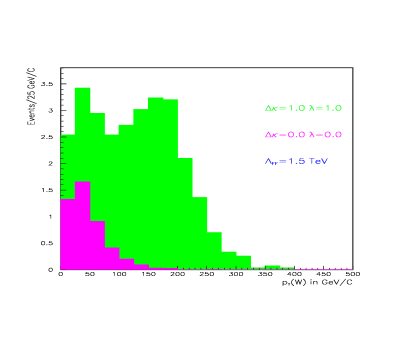
The evidence for non SM physics contributions will be an enhancement in the high region [12]. Figure 5 illustrates the predicted number of events in the mode (for Run 1B) vs the as a comparison of SM and non SM physics (for and ). Therefore, a study of the spectrum of production will provide a sensitive test of the and couplings.
![[Uncaptioned image]](/html/hep-ex/9903038/assets/x9.png)
A
The 1994-95 data with were used in the search for anomalous production in the mode . The event selection requires a high muon ( 20 GeV/c), 20 GeV and at least two good jets with 20 GeV/c. There is no differentiation between the two processes and due to limited mass resolution of the calorimeter. The invariant mass of the two highest jets in the event is required to be between 50 and 110 GeV/ along with a constraint on the transverse mass 40 GeV/. The final event count is while the SM prediction is events.
The major sources of backgrounds are from QCD multijet and jet events with . The QCD multijet background is due to misidentifying a muon contained in one of the jets as an isolated muon and where there is significant . This background is estimated from data using a control sample to determine muon fake probability [13]. The jets contribution is computed using a Monte Carlo sample generated with VECBOS, HERWIG [14] (hadronization) and 0GEANT [15] for detector simulation. Normalization of this background is determined by comparing the number of expected events outside the dijet mass window after the subtraction of the QCD multijet contribution. The final background contributions are (QCD multijet), ( jets) and (others) without systematics. The total background contribution to the final sample are .
| 95% C.L. Limits | TeV | Unitary Bounds | TeV | Unitary Bounds |
|---|---|---|---|---|
| ) | -0.45, 0.46 | -0.82 0.82 | -0.43, 0.44 | -0.46, 0.46 |
| ) | -0.62, 0.78 | -1.17, 1.17 | -0.60, 0.74 | -0.66, 0.66 |
| ) | -0.44, 0.46 | -0.82, 0.82 | -0.42, 0.44 | -0.46, 0.46 |
| ) | -0.75, 0.99 | -2.17, 2.17 | -0.71, 0.96 | -1.22, 1.22 |
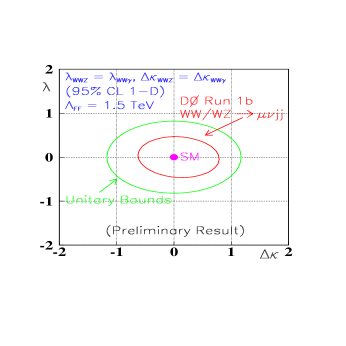
The comparison of the final data sample and the total background as a function of is shown in Figure 6. The data and background distributions are consistent with each other signalling no evidence of AGC. This agreement is translated into AGC limits by means of a binned maximum likelihood method with convoluting Gaussian errors for the prediction and background uncertainities. The 95% C. L. limits for the coupling parameters and are tabulated in Table II for the cases of equal and couplings and the HISZ relations. The contour constraining the coupling parameters in the plane is illustrated in Figure 6 for and .
![[Uncaptioned image]](/html/hep-ex/9903038/assets/x11.png)
B Overview of the DØ Diboson Projects
The DØ collaboration has done a comprehensive search [16] for anomalous gauge couplings in the four diboson final states in twelve different decay modes using Run I data. A detailed listing of the diboson final states and the relevant decay channels including the status of the searches is given in Table III. The limits from all different channels have been combined to produce the final AGC coupling limits from DØ in Run I.
C Run I DØ Combined Anomalous Coupling Limits
The combined limit of channel along with 11 other channels listed in Table III has been produced. This involves performing a simultaneous binned maximum likelihood fit to the observed number of events and the expected number of signal and background distributions: spectrum in the channels, distribution in modes, spectrum in the channels and to the observed number of events in the after a careful account of correlated and uncorrelated uncertainities in different data sets and modes. The one-dimensional 95% C.L. axis limits for the various coupling cases are given in Table IV.
| Diboson State | Channel | Coupling | Status |
|---|---|---|---|
| Published | |||
| ’93-94 Data: published (’94-95 Data: in progress) | |||
| Published | |||
| Published | |||
| Completed | |||
| Published | |||
| Completed | |||
| Combined Limit | All completed | Completed except ’94-95 |
IV Summary and Outlook
The CDF and DØ collaborations have done a number of world class measurements of electroweak parameters using 1992-96 data such as , GeV (indirect), GeV, . The diboson channels , have been completed. Combined with other DØ channels previously announced, these provide some of the most stringent limits on the anomalous coupling parameters. Looking towards future, the Main Injector is close to operation. The CDF and DØ detectors are undergoing major upgrades. We expect much larger data sets with much improved detectors in Run II. Both collaborations are looking forward to an exciting Run II with many precision measurements and new discoveries.
| 95% C.L. Limits | TeV | TeV |
|---|---|---|
| ) | -0.20, 0.20 | -0.18, 0.19 |
| ) | -0.27, 0.42 | -0.25, 0.39 |
| ) | -0.20, 0.20 | -0.18, 0.19 |
| ) | -0.31, 0.56 | -0.29, 0.53 |
| ) | -0.26, 0.29 | -0.25, 0.27 |
| ) | -0.37, 0.55 | -0.34, 0.51 |
| ) | -0.46, 0.65 | -0.44, 0.61 |
| ) | -0.27, 0.25 | -0.25, 0.24 |
| ) | -0.57, 0.74 | -0.54, 0.69 |
V Acknowledgement
This work would not have been possible without the help of my DØ and CDF colleagues. This work is also supported in part by the U.S. Department of Energy Grant DE-FG03-94ER40837.
REFERENCES
- [1] F. Abe et. al. (CDF Collaboration), Nuc. Inst. Meth. Phys. Res. A271, 387 (1988).
- [2] S. Abachi et. al. (DØ Collaboration), Nuc. Inst. Meth. Phys. Res. A338, 185 (1994).
- [3] R. Hamburg et al. Nucl. Phys. B359, 343 (1991); W. L. van Neervan and E. B. Zijlstra, Nucl. Phys. B382, 11 (1992).
- [4] S. Eno for DØ Collaboration, Talk presented at the Les Renontres de Physique de la Vallee d’ Aoste, LaThuille, Italy, February 28 - March 6, 1999. The latest CDF results can be seen at http://www-cdf.fnal.gov/physics/ewk/ewk.html.
- [5] S. Abachi et. al. (DØ Collaboration), Phy. Rev. Lett. 75, 1456 (1995).
- [6] K. S. McFarland et al., Proc. of the XXXIII Rencontre de Moriond, March 1998, Les Arcs, France.
- [7] P. B. Arnold, R. P. Kaufman, Nucl. Phys. B349, 381 (1992); J. Collins, D. Soper, and G. Sterman, Nucl. Phys. B250, 199 (1985); R. K. Ellis and S. Veseli, Nucl. Phys. B511, 649 (1998); R. K. Ellis et al., Nucl. Phys. B503, 309 (1997).
- [8] Robert Wagner, private communication.
- [9] M. Mostafa for DØ Collaboration, Talk presented at the APS Meeting, Atlanta, GA, March 21-26, 1999. See also at http://www-d0.fnal.gov/public/d0_physics_v2.html.
- [10] K. Hagiwara, R. D. Peccei, D. Zeppenfeld, and K. Hikasa, Nucl. Phys. B282, 2253 (1987); K. Hagiwara, J. Woodside, and D. Zeppenfeld, Phys. Rev. D41, 2113 (1990).
- [11] K. Hagiwara et al., Phys. Rev. D48, 2182 (1993).
- [12] K. Gaemers and G. Gounaris, Z. Phys. C1, 259 (1979).
- [13] B. Abbot et al., (DØ Collaboration), Phys. Rev. D54, 052001 (1998).
- [14] G. Marchesini et al., Phys. Comm. 67, 465 (1992).
- [15] F. Carminati et al., GEANT Users Guide, CERN Program Library Long Writeup WSO13 91993), unpublished.
- [16] S. Abachi et al., (DØ Collaboration), Phys. Rev. Lett., 75, 1023 (1995); Phys. Rev. Lett., 75, 1028 (1995); Phys. Rev. Lett., 75 1034(1995); Phys. Rev. Lett., 77, 3303 (1996); Phys. Rev. Lett., 78, 3634 (1997); Phys. Rev. Lett., 781, 3640 (1997); Phys. Rev., D56, 6742 (1997); S. Abbott et al., (DØ Collaboration), Phys. Rev. Lett., 79, 1441 (1997); Phys. Rev., D57 3817 (1998); Phys. Rev., D58, Rapid Comm. 051101 (1998); Phys. Rev., D58, Rapid Comm. 31102 (1998).