Study of Photonuclear Interaction of Muons in rock
with the MACRO experiment.
E. Scapparone for the MACRO Collaboration
INFN - Laboratori Nazionali del Gran Sasso
S.S.17 km 18+910, 61070, Assergi (AQ), Italy
Talk at Xth International Symposium on Very High
Energy Cosmic Ray Interactions
July 12 - 17, 1998
To be published in Nucl. Phys. B, Proc. Suppl.
Study of Photonuclear Interaction of Muons in Rock
with the MACRO Experiment
Abstract
We present first results about the measurement of the charged hadrons production by atmospheric muons in the rock above MACRO. A comparison between the measured rate with the Monte Carlo expectation is presented.
1 Introduction
The inelastic muon-nucleus interaction was studied at accelerators, in the range of large transfer () mainly to measure the nucleon structure functions (deep inelastic scattering experiments). However, the bulk of interactions are characterized by low () and can be described with the exchange of a quasi-real photon between the muon and the nucleon and they are often referred to as photo-nuclear interaction of muons. Recently, it has been stressed that nuclear interactions of muons are an important source of background for many underground experiments. A comparison between experimental measurements about the hadrons production by muons and Monte Carlo (MC) simulations is mandatory to test the reliability of theoretical models. In fact, uncertainties do exist on the cross section calculation for the process, mainly due to the extrapolation of photo-nuclear cross section at high energies and in the simulation of the hadronic final state, because the smallness of the does not allow the use of perturbative QCD. The aim of the present work is to compare real data collected by the large area underground experiment MACRO [1], taking data at Gran Sasso laboratory, with GEANT 3.21 and with FLUKA97, the latter based on the cross section calculated by Bezrukov and Bugaev[3] and on DPM model[4] for the sampling of the final state.
2 The Detector
A description of MACRO is given elsewhere[1]. We remind here that MACRO operates at an average depth of 3800 hg/cm2, where the average residual energy of muons is about 300 GeV. The horizontal area of MACRO is about 1000 m2 and charged tracks can be reconstructed by means of a streamer tube system, in two projective views, with a space point accuracy of 1 cm. The upper part of MACRO is in practice a thin detector, imposing a low threshold on secondary particles. The lower part, thanks to the rock absorbers, allows to stop particles and to measure their range up to few hundreds of MeV. We consider events in which the muon interacts in the rock above the apparatus and both the muon and at least one charged hadron are observed in the horizontal planes of the tracking detector. An example is shown in Fig.1, in which a muon enters the apparatus from above, along with at least one charged hadron.
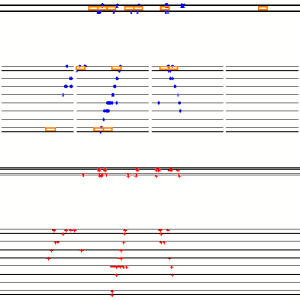 |
Muon tagging is performed using the standard MACRO muon tracking while the additional tracks have been recognized with a specialized algorithm, looking for shorter tracks pointing towards the main track around a common vertex region contained in the rock above the detector. In practice we select charged hadrons with a minimum kinetic energy around 150 MeV.
3 The physical process and its simulation
We have chosen FLUKA as a main reference to generate the underground muon events, taking into account the following steps. The direction of incident muons is sampled according to the local angular distribution measured by MACRO and properly unfolded. As far as muon residual energy at a depth (in km w.e.) is concerned, we chose to sample it according to[5]
| (1) |
where =3.5,b=0.4(km w.e. and 540 GeV.
Given the direction, the slant depth of rock crossed by the muon can be obtained from the map of the mountain overburden. In the simulation, muons are allowed to interact in a m thick layer of rock positioned all around the experimental hall. This thickness corresponds to about for hadrons, and this is enough to fully contain hadronic showers. If a photo-nuclear interaction occurs in the region of rock described above, the muon and secondary particles are transported through the rock, along with e.m. and hadronic showers possibly produced. If both the muon and at least one additional particle reach the tunnel, the event is stored and a full simulation of the apparatus response is performed using the GEANT 3.21 package[6]. The simulated data are treated with the the same analysis instruments of real data. In order to make a comparison with a different model, we have repeated the event generation in the rock with GEANT. One of the most important differences is in the total cross section, as shown in Fig. 2.

For a more detailed discussion of the differences between FLUKA and GEANT-GHEISHA for this process, see [7].
4 Data Analysis
The main difficulty in our analysis is to achieve the necessary rejection factor against the physical background. Such a background is largely dominated by two processes: 1) the e.m. interactions of muons in the rock (bremsstrahlung and pair production, which have a much larger cross section than the photonuclear reaction); 2) multiple muon events in which one of the muons stops inside the detector. An example of e.m. background event is shown in Fig. 3.
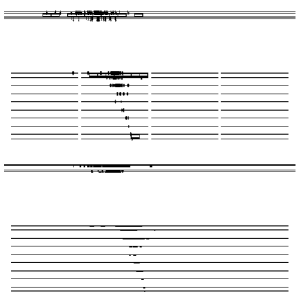

This background has been extensively studied with our simulation tools. In the case of the e.m. interactions, the mean angular separation between the muon and the additional tracks is less than the corresponding separation observed in photonuclear interactions. Besides that, e.m. events often show very large clusters of fired tubes near the muon track. These features are used to achieve a rejection factor against e.m. events at the level of 4.5 10-6, maintaining the recognition efficiency for hadronic events at the level of 55%. In order to reject the muon bundle backgrounds, additional cuts based on the parallelism of tracks have to be considered. We have studied the events generated with the HEMAS code[8] using for the primary cosmic ray spectrum and mass composition the results from the best fit reproducing the MACRO data themselves[9] The rejection factor achieved for muon bundle background at the level of 1.510-4, at the price of a slight reduction of the selection efficiency, which is now at 47%.
5 Results
We have analysed a data sample corresponding
to about 11000 hours of full running of the detector.
With the above selection criteria, we have found
1938 candidate events over a total sample of
9544318 muon events.
From our knowledge of the background, we expect a
contamination by 11 events from the
e.m. interactions in the rock, and by 107 events muon bundles
surviving the cuts.
We can express the results in terms of the ratio
of the selected +hadrons events
to the number of muon events in the same live time.
We then compare the experimental results to the MC prediction having
used the same selection criteria.
After the subtraction of the background, we find for
in real data and in the MC simulations the following results:
- ,
- ,
- .
The systematic error on the experimental data is due to the uncertainties on
background subtraction, while in the simulation is
dominated by the uncertainties on the muon energy spectrum.
Fig. 4 shows the charged hadron multiplicty distribution. A good agreement
between the real data and FLUKA is obtained, while the GEANT distribution
is flatter, reflecting the spectrum harder than FLUKA[7].
From this preliminary measurement, we can conclude that the MACRO experiment
can measure of the charged hadron (Ekin150 MeV)
production in the rock at the desired level of accuracy.
The FLUKA predictions, based on the Bezrukov and Bugaev model,
are in very good agreement with data, while the GEANT-GHEISHA
model gives absolute predictions lower by an order of magnitude.
References
- [1] The MACRO Coll., Nucl. Instr. Meth. A324(1993) 337.
- [2] A.Fassó et al.,Proc. SARE-3, KEK-Tsukuba, KEK report 97-5 (1997)32.
- [3] L.Bezrukov and E.Bugaev,Sov. J. Nucl. Phys, 33(5) (1981)6.
- [4] A.Capella et al,Phys.Rev.Lett.58(1987)2015.
- [5] T.Gaisser,Cosmic Rays and Particle Physics, Cambridge Univ. Press,(1990).
- [6] R.Brun et al.,CERN GEANT User’s guide, DD/EE 84-1(1992)
- [7] G.Battistoni et al.,Nucl. Inst. Meth. A394(1997) 136.
- [8] C.Forti et al.,Phys. Rev. D42(1992) 3668.
- [9] The MACRO Coll.,Phys. Rev. D563(1997) 1418.