EUROPEAN LABORATORY FOR PARTICLE PHYSICS (CERN)
ALEPH 98-048
CONF 98-022
Abstract Registration Number 1038
Parallel session: 1,12
Plenary session: 1,14
PRELIMINARY
Determination of the
LEP center-of-mass energy
from Z events
The ALEPH Collaboration
Abstract
Radiative returns to the Z resonance (Z events) provide a method to determine the centre-of-mass energy of the high energy colliders and already at LEP2. The method is applied for the data collected with the ALEPH detector in 1997 at 181-184 GeV, using events.
ALEPH contribution to 1998 Summer Conferences
Contact person: Eugeni Graugés (Eugeni.Grauges@cern.ch)
1 Introduction
One of the main goals of LEP2 is the direct measurement of the W mass with an accuracy of 30-50 MeV, due to its implications in the validation of the Standard Model. At the same time, this requires a very precise determination of the LEP centre-of-mass energy, i.e., below 30 MeV. LEP1 was ensured to get this accuracy due to the availability of beam transverse polarisation to apply the Resonant Depolarisation (RD) method for energy measurement.
At LEP2 this is not anymore the case and, starting from a precise calibration of the RD method at low (LEP1) energies, an extrapolation to higher energies is made, within which some precision may be lost.
Lately, an additional possibility has been considered, either as a cross-check on the previous method cited or as an alternative measurement if enough precision is proven . It consists in determining the LEP centre-of-mass energy by means of an offline analysis of the recorded events.
Although at LEP2 the colliding energy is far above from the Z peak, the physics processes that take place are very sensitive to it. The presence of the so-called “Radiative Return Events”, where the initial colliding particles (electron or positron) radiate photons before interacting among themselves, is the responsible for such sensitivity. The Initial State Radiation (ISR) is mostly collinear to the beam pipe thus, lost and not detected. Therefore, the effective centre-of-mass energy is reduced from the nominal one (), leading to a “scanning” of the effective centre-of-mass energy (), in which the Z resonance appears naturally. By analysing the two fermions final state processes it is possible to determine the effective centre-of-mass energy and, the very precise knowledge of the Z mass and width can be used as a strong constraint to perform a fit to the line shape in order to extract the LEP centre-of-mass energy.
In summer 1997 the nominal LEP centre-of-mass energy was raised up to 181, 182, 183 and 184 GeV, and an integrated luminosity of 56.812 pb-1 was collected by ALEPH. This note describes a LEP centre-of-mass measurement by a line shape fit to the final state processes.
The production cross-section at these energies is large enough, more than 5000 events expected, to allow a measurement of the LEP centre-of-mass with an accuracy of 1 per mil. The events are selected making use of very simple cuts which nevertheless lead to a high purity with a reasonable signal efficiency. After possible ISR photons non-collinear with the beam are identified, the events are forced into two jets. At this point, the effective centre-of-mass energy is extracted from the jet angles to improve the resolution and to provide at the same time, a natural kinematical limit to the events. Finally, the experimental distributions 111The variable is equivalent to since the relation . For technical reasons distribution is prefered than distribution, to perform the fit. are compared with Monte Carlo reweighted distributions to extract the value of the LEP centre-of-mass energy.
2 Monte Carlo samples
A sample of 100,000 events at a nominal CM energy of 182.675 GeV fully simulated using KORALZ [2] were used to perform the data fit. Monte Carlo samples at 183 GeV with integrated luminosities very much larger that of the data, were simulated for all background reactions. The PYTHIA [3] generator was used to generate WW, ZZ and Zee events. Two photon () reaction into hadrons were simulated with the PHOT02 [4] generator. Also for calibration of the method purposes, samples of 350,000 at 183 GeV and 20,000 either at 182 as well as 184 GeV fully simulated with PYTHIA generator were used.
3 Event selection and reconstruction algorithm
At = 183 GeV the main backgrounds to the process are , , and . In order to discriminate between signal and background, the following cuts were applied.
-
•
Aleph standard candidate selection: This selection is performed using the ALEPH Energy Flow algorithm [5] associated to a charged track preselection, which requires at least 5 TPC tracks satisfying the following cuts: At least 4 TPC hits, the track originated from within a cylinder with radius 2 cm and length 10 cm, centered around the interaction point, 0.95. In addition the total energy of all TPC tracks satisfying the previous cuts, should have more than 10% of the nominal centre-of-mass energy.
-
•
Total visible invariant mass greater 50 GeV
-
•
Number of charged tracks greater than 7
After that, ISR photon non collinear with the beam pipe and entering into the detector are identified as a thin electromagnetic jet. The remaining part of the events are then forced into two jets using the DURHAM-P algorithm. To reconstruct the effective centre-of-mass energy , it is assumed that the ISR photons are emitted along the beam pipe, boosting the centre-of-mass in that direction (except for the cases in which such ISR photons are indentified inside the detector, in which case their direction is taken as the boost direction). Under that approximation the magnitude of the boost can be computed from the measured directions (polar angles and ) of the jets with respect to direction opposite to the photon. Assuming no Final State Radiation (FSR) and following the method described in [6], the effective centre-of-mass energy can be expressed as:
| (1) |
where
| (2) |
and
| (3) |
Once , or equivalently , is reconstructed only the events included in the following -window are selected:
| (4) |
Using the MC samples generated for this study, the expected observable cross-section for each process are summarised in Table 1
| Processes | (pb) |
|---|---|
| 59.1 | |
| WW | 1.9 |
| ZZ | 0.8 |
| 1.1 | |
| Zee | 1.5 |
| Purity | 91.8% |
4 LEP Centre-of-Mass Energy measurement.
The LEP centre-of-mass energy is determined from the 181, 182, 183 and 184 datasets separately and then combined taking into account the relative luminosity of each dataset. In each case, a Monte carlo reweighting procedure developed earlier [7] is employed to find the value of Ecm which best fits the reconstructed distribution. Selected Monte Carlo (KORALZ) signal events from the large sample at a reference energy of 182.675 GeV are reweighted using the differential production cross-section 222Since we are reweighting MC events, both the reconstructed (as obtained in the data) and the true (from the effective centre-of-mass energy after ISR) are available event by event.
| (5) |
according to the parameter to be fitted, Ecm. Background Monte Carlo samples are included in the fit, but they are not reweighted, i.e., their energy dependence is not taken into account. This may introduce an additional source of systematic error which is estimated in section 7.6
The statistical error in Ecm is computed from the single fits to the data distributions.
In the present analysis of the 1997 data, the reweighting procedure is applied to the distribution. A log-likelihood fit is performed with fixed bins of 0.01 over the range of 0.60-0.88.
5 The results
| Nominal | Data | Expected | Integrated |
| dataset | events | events | Luminosity (pb-1) |
| 181 | 17 | 11 | 0.166 |
| 182 | 267 | 253 | 3.924 |
| 183 | 3375 | 3269 | 50.795 |
| 184 | 123 | 124 | 1.927 |
| All | 3782 | 3657 | 56.812 |
| Nominal | Ecm | -Ecm | +Ecm |
| dataset | (GeV) | (GeV) | (GeV) |
| 181 | 183.486 | -2.839 | 3.472 |
| 182 | 180.294 | -0.608 | 0.629 |
| 183 | 182.541 | -0.219 | 0.221 |
| 184 | 185.711 | -1.432 | 1.604 |
| Combined | 182.496 | -0.206 | 0.210 |
The number of events found in the data after the selection cuts at each nominal energy dataset, as well as the corresponding number of expected events is summarized in table 2. Also the integrated luminosity for each data taking period is provided.
The LEP centre-of-mass energy values and the statistical errors obtained from single fits to the different datasets is summarized in table 3, as well as the value coming from their combination taking into account the integrated luminosity of each dataset.
In table 4, the LEP centre-of-mass energy values obtained for ALEPH by means of the standard LEP energy calibration procedure (i.e., extrapolation from RD) are summarized for each nominal energy dataset. Also their combination, according to the respective luminosity of each data taking period, is quoted.
| Nominal | Ecm |
|---|---|
| dataset | (GeV) |
| 181 | 180.826 0.050 |
| 182 | 181.708 0.050 |
| 183 | 182.691 0.050 |
| 184 | 183.801 0.050 |
| Combined | 182.652 0.050 |
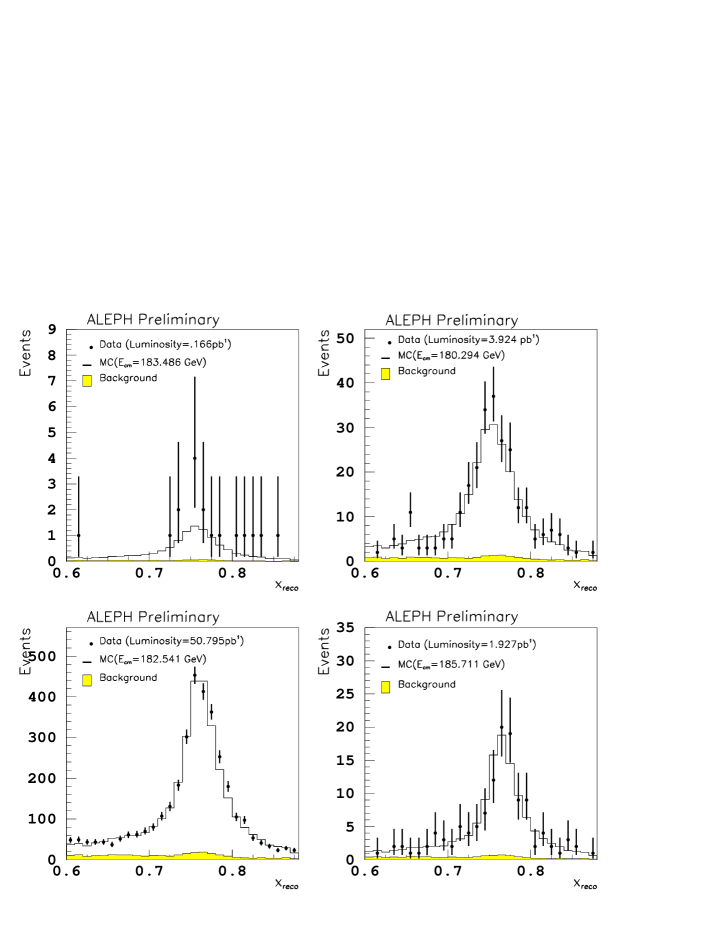
Figure 1 shows the reconstructed () distribution for the selected events in each nominal dataset, compared with the Monte Carlo reweighted prediction using the LEP centre-of-mass energy wich best fits the data. The of the histograms range from 36 up to 48 over 28 degrees of freedom.
6 Linearity of the reweighting technique
A critical test of the reweighting method is to ensure that the fitted energy agrees with the true energy, when performing a fit to a Monte Carlo sample. The linearity of the fitted energy with the true input energy is studied for this channel using three independent Monte Carlo samples with different input energies. The fitted values from these distributions have slope consistent with a value of one, 1.0010.102, and a non significant offset of 0.0550.060 GeV is observed (see figure 2).

7 Systematic uncertainties
7.1 Calorimeter calibrations
During the 1997 data taking the uncertainties in the global calibrations of ECAL and HCAL energy were assessed to be 0.9% and 2% respectively. Adjusting the data in each direction for ECAL and HCAL by these uncertainties, the errors are estimated by the shift obtained fitting the energy in each case. These are 39 MeV/c2 and 55 MeV/c2 respectively. The larger of the shifts obtained from the fit is quoted in each case.
7.2 Jet angle calibration
Z peak data are used to map the response of the detector to hadronic jets as a function of polar angles. The observed difference in the directions of the two jets between data and Monte Carlo as a function of is used to implement the corresponding correction to the data. The shift obtained from the fit of , which is 8 MeV, is taken as the systematic error.
7.3 MC statistics
The finite number of Monte Carlo events used as a reference in the reweighting method contributes with a systematic uncertainty of 35 MeV.
7.4 Initial State Radiation
ISR is featured in KORALZ up to O(), i.e. up to second order in the leading-log approximation, in the YFS [8] style. The effect of the missing higher order terms in the LEP centre-of -mass energy have been studied here by degrading KORALZ to O(), and checking how large the pure O() correction is. This effect, about 18 MeV, is quoted as an upper limit to the systematic effect in the LEP centre-of-mass energy determination coming from these missing higher order terms.
7.5 ISR-FSR interference
There exists no Monte Carlo, for the time being, giving a good representation of Initial-Final State interference for quarks final state. However an evaluation of the order of magnitude of the effect has been performed for muon final state using an O() simulation [9]. An upper limit of 50 MeV on Ecm could be given. Although the effect is presumably much smaller for quarks because of i) their charge ii) the interplay of gluon emission and fragmentation, these 50 MeV are taken as a preliminary systematic error.
7.6 Background contamination
The expected background remaining after selection cuts is 8.2%. Although small, the background contamination also depends on the centre-of-mass energy. Since, in our case, the background is not reweighted as the signal is, this is introducing an additional source of systematic error on top of the intrinsic discrepancy between data and Monte Carlo at a given centre-of-mass energy. This effect can affect either the background shape, as well as its normalization. Therefore to estimate the systematic error coming from the background we assume uncertainties both in the total normalization and in the background shape.
7.6.1 Total normalization
Assuming a very conservative 10% uncertainty in the total background normalization, the reference MC sample has been adjusted in each direction. The larger of the shifts obtained is 32 MeV, and is quoted as the systematic error.
7.6.2 Background shape
To estimate the systematic error coming from the background shape very conservative uncertainties of 10% are assumed for each background process independently. Again, adjusting in each direction the normalization of each background process, the shifts are obtained in each case and summarized in table 5. Also here, the larger of the uncertainties from the shifts applied are quoted in each case. The total systematic error due to the uncertainty of the background shape is estimated to be 37 MeV
| Processes (10%) | Deviation(MeV) |
|---|---|
| WW | 35 |
| ZZ | 9 |
| 5 | |
| Zee | 4 |
| Total | 37 |
7.7 Summary of the systematic errors
Table 6 lists all systematic errors considered.
| Source | Ecm(MeV) |
|---|---|
| Calorimeter calibrations | 67 |
| MC statistics | 35 |
| ISR | 18 |
| ISR-FSR Interference | 50 |
| Background Contamination | 49 |
| Jet angle calibration | 8 |
| Total | 105 |
8 Summary and conclusions
A Monte Carlo reweighting technique is used to measure the LEP centre-of-mass energy from events. It is based on the direct comparison of the distributions (=1- ) reconstructed from the data with those from Monte Carlo weighted events. Selection cuts are applied to the data to study radiative return events in the final state channel, in order to get the maximum compromise between purity of the sample and signal efficiency of the most sensitive events (whose is around the Z resonance). The resulting distribution for each nominal energy dataset collected by ALEPH is compared with reweighted Monte Carlo distributions, and the values of the LEP centre-of-mass energy are extracted in a binned log-likelihood method. Combining all the measurements at different taking into account their respective integrated luminosity, the average LEP centre-of-mass energy at ALEPH for the high energy run of 1997, is measured to be:
| (6) |
This result is consistent with the estimate from the LEP energy working group [10] weighted over the ALEPH luminosity events: Ecm=182.652 0.050 GeV. With the expected increase in statistics at LEPII and with refined experimental techniques akin to those used for the W mass determination [11], the technique described here should provide an alternative measurement of the LEP center-of-mass energy, with competitive errors. Already, if only this evaluation of the LEP centre-of-mass-energy were used in the W mass determination, the systematic error on MW coming from the beam energy scale would be 102 MeV, which is smaller than the experimental error of 139 MeV on MW from the same data sample [11].
References
- [1]
- [2] S. Jadach et al., Comput. Phys. Commun. 79 (1994) 503.
- [3] T. Sjostrand, Comput. Phys. Commun. 82 (1994) 74.
- [4] ALEPH Collaboration, An experimental study of hadrons at LEP, Phys. Lett.B313 (1993) 509.
-
[5]
ALEPH Coll., Nucl. Inst. and Meth. A294(1990) 121;
ALEPH Coll., Nucl. Inst. and Meth. A360(1995) 481. - [6] ALEPH Coll., Phys. Lett. B399 (1997) 329.
- [7] ALEPH Coll., Phys. Lett. B422 (1998) 384.
-
[8]
D.R. Yennie, S.C. Frautschi and H. Suura, Annuals of
Phys. 13 (1961) 379.
S. Jadach and B.F.L. Ward, TPJU-15/88 (1988). - [9] S. Jadach, communication to the LEP Energy Working Group, 12 June 1998.
- [10] ”LEP energy calibration above the W pair production threshold”, LEP energy Working group, contribution to ICHEP98, Vancouver, Abstract 352.
- [11] ALEPH coll., Measurement of the W mass in collisions at 183 GeV, contribution to ICHEP98, Vancouver, Abstract 899.