Neutrino telescopes under the ocean: The case for ANTARES
Abstract
Neutrino telescopes offer an alternative way to explore the Universe. Several projects are in operation or under construction. A detector under the ocean is very promising because of the very accurate angular resolution that it provides. The ANTARES project is intended to demonstrate the feasibilty of such a detector.
1 INTRODUCTION
High energy cosmic neutrinos should provide a new means to explore the sky. Due to the weakness of their interaction with matter and the absence of their interaction with the electromagnetic radiations, neutrinos can travel in the Universe without being absorbed. On the contrary, because photons interact with matter, with the infra-red (IR) radiation and with the cosmic microwave background (CMB), the Universe is opaque for high energy gamma rays.
Charged cosmic rays such as protons are deflected by the galactic and extra-galactic magnetic fields. So, only UHE protons, above eV, are rigid enough to point back to their source. Nevertheless, at these extreme energies protons also suffer from interactions with IR radiations and with the CMB which limit their free path-length to about 50 Mpc. At greater distances protons continuously lose energy and become less and less rigid.
Therefore, it appears that the only way to explore the Universe in the high energy range and at great distances is to detect neutrinos.
2 DETECTION OF HIGH ENERGY NEUTRINOS
High energy muon neutrinos can be detected by searching for long-range muons produced in charged current exchange interactions of neutrinos with the matter surrounding the detector. Due to the increase of the cross-section with the neutrino energy and to the increase of the muon path-length with the muon energy, the probability to detect a muonic neutrino aimed towards the detector is an increasing function of the neutrino energy. This means that high energy neutrinos will be statistically enhanced. Moreover, the angle between the neutrino and the produced muon is very small for high energy neutrinos. So the direction of the parent neutrino is well determined.
Despite its increase with the neutrino energy, the cross-section remains small and, moreover, the neutrino flux is expected to be a decreasing function of the neutrino energy with a differential E-2 behaviour. The detector area must be large enough to provide sufficient sensitivity to detect cosmic sources over the widest possible solid angle on a reasonable time scale. For this reason a volume of detection of 1 km3 is needed.
At the surface of the Earth the main source of background is the flux of particles produced in the cascades initiated in the atmosphere by primary cosmic rays. The major component is downward-going muons which can be rejected by selecting only upward-going particles. In order to suppress particles produced in the back-scattering of atmospheric muons, the detector must be well shielded. The remaining source of physical background is the flux of upward-going neutrinos produced in the atmospheric cascades.
The most economic way to realise a km-scale well-shielded detector is to build a 3-D array of optical modules in the deep ocean or in polar ice. In these media high energy muons crossing the detector produce C̆erenkov light at an angle . The reconstruction of the muon direction is performed by using the information on the arrival times of the photons recorded by the optical modules.
3 THE ANTARES PROJECT
The main advantages of deploying the detector in the ocean compared to ice are the long scattering length and low scattering angle of light in water, the possibility to deploy on different sites located at different latitudes and the possibility to find sites at great depth. Nevertheless, several questions must be answered. In particular tests are needed to master the deployment and connection operations in the deep sea. Moreover the environmental parameters like the optical background rate, the bio-fouling rate and the water transparency must be measured. The ANTARES project [1] has two goals:
-
1.
Realisation of apparatuses capable of measuring environmental parameters such as optical background, bio-fouling and water transparency;
-
2.
Construction and deployment of a 3-D prototype (“Demonstrator”) scalable to a cubic kilometer detector.
These operations are performed off Toulon (France), 30 km from the shore at 2350 m depth. When the feasibility of a large detector has been demonstrated, further steps towards a cubic kilometer will be proposed.
3.1 The demonstrator
The deployment of a large network of optical modules in the deep ocean is one of the major problems to be solved. A very detailed programme has been defined in the ANTARES project to proceed by steps in order to ensure the good quality of the procedures and to reduce causes of failures.
The final prototype will consist of three strings, equipped with about 30 optical modules each, electrically interconnected through a junction box which will be linked to the shore via an electro-optical cable. The signals delivered by each optical module will be transmitted to the shore station through the optical fibers of the electro-optical cable.
The 40 km long electro-optical cable was successfully deployed in May 98. Mechanical tests of the first string started in July 98 and finished in September. Connection-deconnection tests are foreseen for the end of 98. A first string equipped with 8 optical modules, electronics, and positioning and slow-control systems will be deployed by the end of 98 and connected to the electro-optical cable. The first fully equipped string is foreseen for 99.
3.2 Environmental parameters
The site where the final very large detector will be installed must have very good properties from all points of view. The ANTARES collaboration is constructing a system of autonomous detectors capable of measuring the sea quality at any depth down to 4 000 m in order to chose the site and the characteristics of the final detector.
3.2.1 Optical background
The optical background has two main components: a continuous component due to C̆erenkov light produced by electrons emitted in the decay of the 40K present in the sea water and a variable component due to the bio-luminescence emitted by bacteria and fishes.
Several deployments of 350 m long strings at 2 350 m depth have been performed. Each string supports several PMTs (1-3) and other monitors such as currentmeters, thermometers, compasses and tiltmeters. Each string is equipped with a data-logger, an acoustical modem to transmit data to the boat, and a system of releases for recovery. The power is supplied by lithium batteries. Figure 1 shows an example of the variations of the counting rate recorded with our system during a period of medium activity.

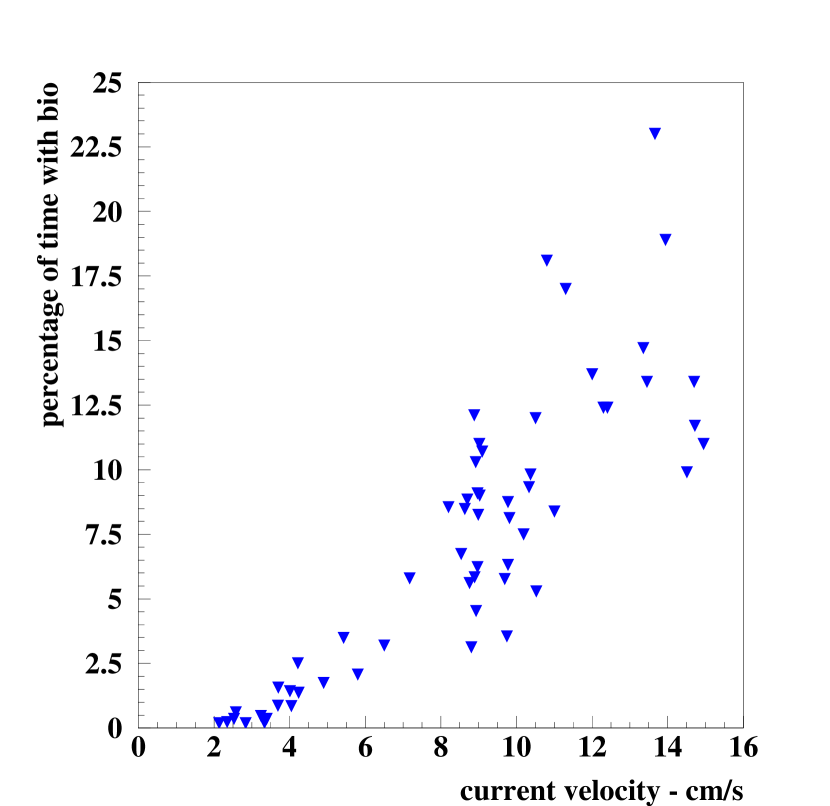
The pulse height threshold used to measure the counting rate was set to a value corresponding to 1/3 of the mean amplitude for a single photo-electron. The figure clearly shows the bio-luminescent activity consisting of bursts of light lasting a few seconds. The continuous background due to the 40K decay is also visible with a frequency of 40 kHz. The fraction of time during which the counting rate exceeded the 40K background by at least 15% was found to be strongly correlated to the current speed, as shown in figure 2.
The measurement performed simultaneously with two PMTs 40 m apart showed a very little time correlation, suggesting that the size of the region where the bio-luminescence is active is generally less than 40 m.
3.2.2 Bio-fouling
The measurement of the bio-fouling of the glass sphere which will house the PMT is a long term operation. It has been performed twice for periods of 3 and 8 months. The system was a string equipped with two glass spheres; one of them (A) housed a system of light diodes (LED) which were continuously monitored, and the other one (B) housed several PIN diodes located at different lattitudes of the sphere. During the first deployment the frame supporting the spheres was oriented vertically with the sphere A in the upper position emitting light downwards towards the sphere B.
The result of this measurement, of 3 months duration, is shown in figure 3.

The counting rate of upward-facing PIN decreased by 60% in 3 months while the rates of the PINs located at other lattitudes decreased less. The counting rates are highly discontinuous and increase suddenly in the presence of high water current velocity. This suggests that i) the bio-fouling covered only a small angular region on the top of the glass sphere and ii) the bio-fouling was partially removed by the water current probably because it was not strongly glued on the glass.
A second measurement was performed after orienting the frame horizontally. The result of this 8-month-long measurement is shown in figure 4. Taking into account that the LED sphere suffers the same fouling as the PIN sphere, one can estimate that the horizontal region of the glass sphere loses only about 1.5% of transparency in one year.

3.2.3 Water transparency
The light attenuation as a function of the distance from the source was measured using a 350 m long mooring string incorporating a 33 m long rigid structure holding an optical module at one end facing a motorised trolley carrying a light source along the structure. Continuous light sources (LEDs) emitting at different wavelengths are used. The measured attenuation length is 393 m for a wavelength of 466 nm. In July 98 a pulsed light source was used to disentangle the contributions from light absorption and from light scattering. The analysis is in progress.
3.3 Optical modules
Different large photocathode photomultipliers are being tested (EMI and Hamamatsu 8” tubes). Larger tubes (10” and 11”) are also foreseen. A dark box equipped with a mechanical system allowing a blue LED to scan the photocathode area is used to measure the response of the phototubes as a function of the position of the light spot. A water tank is used to study the overall response of the optical module to the C̆erenkov light emitted by cosmic muons in water.
3.4 Data transmission
The optical module signals will be transmitted to the shore through the optical fibers of the electro-optical cable. Analog data transmission will be used first and replaced later by digital transmission of data from a signal sampling device based on an ASIC chip currently under development. The electro-optical cable, deployed in May 98, is equipped with four mono-mode fibers. The measured attenuation is 0.33 dB/km at a wavelength of 1 310 nm.
3.5 Positioning and slow control
The knowledge of the relative position of the optical modules should match the size of the photocathodes of the PMTs (20 cm). This will be achieved by sonar triangulation between an external base and acoustic detectors along the strings. Adjustment of the PMT voltages, recording of the environmental parameters, and measurement of the detector geometry will be managed by the slow-control system. These monitoring data will be transmitted to the shore through the electro-optical cable.
3.6 Software
A software package has been developed to simulate the neutrino interaction in the medium surrounding the detector, the muon tracking, the C̆erenkov light emission and the detector response. The optical background and the distortions of the detector by the water currents are also simulated.
4 TOWARDS A CUBIC KILOMETER DETECTOR
The development of a cubic kilometer detector is a very complex challenge which must be reached by steps. The ANTARES collaboration envisages an intermediate stage consisting of a detector of 0.1 km2 made of a network of about 1000 PMTs. The software packages developped for the ANTARES project have been used to estimate the performance expected for this intermediate stage. Different detector layouts have been considered, all made of 15 strings equipped with a total of about 1000 PMTs. The results are quite similar for the different layouts.
The reconstruction algorithm applied to simulated events shows that the angular resolution for reconstructed tracks will be better than 0.2∘. Moreover, for muons with energies that trigger a km-scale detector (above 1-10 TeV), the angle between the muon and the parent neutrino is smaller than 0.1∘. Figure 5 shows the distribution of the angle betwen the direction of the muon entering the detector and the direction of the reconstructed track for muons induced by simulated neutrinos with a E-2 energy spectrum.

5 EXTRAPOLATION OF THE EGRET CATALOGUE
Powerful extra-galactic objects such as AGNs or topological defects could contribute to a diffuse flux of high energy neutrinos significantly larger than the flux of atmospheric neutrinos at high energy [3, 4].
Moreover, due to the extremely low angle between the muon and the parent neutrino and to the good quality of the muon direction measurement, the atmospheric neutrino background contaminating each individual source can be reduced to a very low level by selecting very small angular regions of the sky. In that way, a signal of only a few events could be significant. The sensitivity of the detector to muon neutrinos can be estimated from measured low-energy gamma-ray fluxes by assuming that i) the low energy gamma-rays are of hadronic origin and ii) the emitted gamma-rays have a differential energy spectrum .
With these assumptions the muon neutrino flux is about 40% of the flux of gammas at the production source. Using the 2nd EGRET catalog [2] for sources measured during the P12 period, the derived neutrino flux has been extrapolated to the energies where the neutrino detector is sensitive.
Although no individual extra-galactic source can be detected with an exposure of 0.1 kmyear, a statistically significant effect can be detected by adding the contributions of all the extra-galactic sources. A calculation made for the 43 identified AGN gives a total number of 8-67 events (depending on the value of the differential spectral index used: respectively 2.2 and 2) to be compared to a total background of 2.7 events.
A possible scenario would be to start with a 0.1 km2 detector made of about 15 strings equipped with about 1000 optical modules. If a statistical enhancement correlated with the positions of the AGN sources could be detected on a time scale of the order of one year this would motivate the construction of the cubic kilometer detector.
6 CONCLUSIONS
The sky survey with high energy neutrinos is essential in order to obtain new information complementary to that obtained from low energy gamma-rays and short distance high energy gamma-rays and ultra high energy protons. This requires a detector at the kilometer scale which can only be developed in stages. The construction of a deep ocean prototype and a programme of measurement of environmental parameters is the first step necessary to demonstrate the feasibility of such a detector.
Studies performed by the ANTARES collaboration indicate that a detector in the ocean can determine the origin of each event with a very fine angular resolution. This is a major advantage of the underwater technique, making it possible to reduce the background from known point sources to very low level.
References
- [1] The ANTARES proposal and contributions to conferences by the ANTARES Collaboration can be found in the ANTARES Web pages: http://antares.in2p3.fr/antares/
-
[2]
The Second EGRET Catalog of High-Energy Gamma-Ray
Sources,
http://cossc.gsfc.nasa.gov/cossc/egret/egret
catalog/cattex.html -
[3]
F. W. Stecker, C. Done, M. H. Salamon and P. Sommers,
Phys. Rev. Lett. 66 (1991) 2697 and
Phys. Rev. Lett. 69 (1992) 2738(E);
L. Nellen, K. Mannheim and P. L. Biermann Phys. Rev. D 47 (1994) 5270;
A. P. Szabo and R. J. Protheroe,
Astropart.Phys. 2 (1994) 375;
K. Mannheim, Astropart.Phys. 3 (1995) 295;
R. J. Protheroe, High Energy Neutrinos from Blazars, Accretion Phenomena and Related Outflows, IAU Colloq. 163, 1996, ADP-AT-96-7. -
[4]
P. Bhattacharjee, Ch. T. Hill
and D. N. Schramm, Phys. Rev. Lett. 69 (1992) 567;
G. Sigl, S. Lee, D. N. Schramm and P. Coppi, Phys. Lett. B 392 (1997) 129.