EUROPEAN LABORATORY FOR PARTICLE PHYSICS
CERN–EP/98–124 July 20, 1998
Measurement of the Longitudinal Cross-Section using the Direction of the Thrust Axis in Hadronic Events at LEP
OPAL Collaboration
Abstract
In the process , one of the effects of gluon emission is to modify the form of the angular distribution of the thrust axis, an effect which may be quantified by the longitudinal cross-section. Using the Opal detector at LEP, we have determined the longitudinal to total cross-section ratio to be at the parton level, in good agreement with the expectation of QCD computed to . Comparisions at the hadron level with Monte Carlo models are presented. The dependence of the longitudinal cross-section on the value of thrust has also been studied, and provides a new test of QCD.
Submitted to Phys. Lett. B
The OPAL Collaboration
G. Abbiendi2, K. Ackerstaff8, G. Alexander23, J. Allison16, N. Altekamp5, K.J. Anderson9, S. Anderson12, S. Arcelli17, S. Asai24, S.F. Ashby1, D. Axen29, G. Azuelos18,a, A.H. Ball17, E. Barberio8, R.J. Barlow16, R. Bartoldus3, J.R. Batley5, S. Baumann3, J. Bechtluft14, T. Behnke27, K.W. Bell20, G. Bella23, A. Bellerive9, S. Bentvelsen8, S. Bethke14, S. Betts15, O. Biebel14, A. Biguzzi5, S.D. Bird16, V. Blobel27, I.J. Bloodworth1, M. Bobinski10, P. Bock11, J. Böhme14, D. Bonacorsi2, M. Boutemeur34, S. Braibant8, P. Bright-Thomas1, L. Brigliadori2, R.M. Brown20, H.J. Burckhart8, C. Burgard8, R. Bürgin10, P. Capiluppi2, R.K. Carnegie6, A.A. Carter13, J.R. Carter5, C.Y. Chang17, D.G. Charlton1,b, D. Chrisman4, C. Ciocca2, P.E.L. Clarke15, E. Clay15, I. Cohen23, J.E. Conboy15, O.C. Cooke8, C. Couyoumtzelis13, R.L. Coxe9, M. Cuffiani2, S. Dado22, G.M. Dallavalle2, R. Davis30, S. De Jong12, L.A. del Pozo4, A. de Roeck8, K. Desch8, B. Dienes33,d, M.S. Dixit7, J. Dubbert34, E. Duchovni26, G. Duckeck34, I.P. Duerdoth16, D. Eatough16, P.G. Estabrooks6, E. Etzion23, H.G. Evans9, F. Fabbri2, M. Fanti2, A.A. Faust30, F. Fiedler27, M. Fierro2, I. Fleck8, R. Folman26, A. Fürtjes8, D.I. Futyan16, P. Gagnon7, J.W. Gary4, J. Gascon18, S.M. Gascon-Shotkin17, G. Gaycken27, C. Geich-Gimbel3, G. Giacomelli2, P. Giacomelli2, V. Gibson5, W.R. Gibson13, D.M. Gingrich30,a, D. Glenzinski9, J. Goldberg22, W. Gorn4, C. Grandi2, E. Gross26, J. Grunhaus23, M. Gruwé27, G.G. Hanson12, M. Hansroul8, M. Hapke13, K. Harder27, C.K. Hargrove7, C. Hartmann3, M. Hauschild8, C.M. Hawkes5, R. Hawkings27, R.J. Hemingway6, M. Herndon17, G. Herten10, R.D. Heuer8, M.D. Hildreth8, J.C. Hill5, S.J. Hillier1, P.R. Hobson25, A. Hocker9, R.J. Homer1, A.K. Honma28,a, D. Horváth32,c, K.R. Hossain30, R. Howard29, P. Hüntemeyer27, D.E. Hutchcroft5, P. Igo-Kemenes11, D.C. Imrie25, K. Ishii24, F.R. Jacob20, A. Jawahery17, H. Jeremie18, M. Jimack1, C.R. Jones5, P. Jovanovic1, T.R. Junk6, D. Karlen6, V. Kartvelishvili16, K. Kawagoe24, T. Kawamoto24, P.I. Kayal30, R.K. Keeler28, R.G. Kellogg17, B.W. Kennedy20, A. Klier26, S. Kluth8, T. Kobayashi24, M. Kobel3,e, D.S. Koetke6, T.P. Kokott3, M. Kolrep10, S. Komamiya24, R.V. Kowalewski28, T. Kress11, P. Krieger6, J. von Krogh11, T. Kuhl3, P. Kyberd13, G.D. Lafferty16, D. Lanske14, J. Lauber15, S.R. Lautenschlager31, I. Lawson28, J.G. Layter4, D. Lazic22, A.M. Lee31, D. Lellouch26, J. Letts12, L. Levinson26, R. Liebisch11, B. List8, C. Littlewood5, A.W. Lloyd1, S.L. Lloyd13, F.K. Loebinger16, G.D. Long28, M.J. Losty7, J. Ludwig10, D. Liu12, A. Macchiolo2, A. Macpherson30, W. Mader3, M. Mannelli8, S. Marcellini2, C. Markopoulos13, A.J. Martin13, J.P. Martin18, G. Martinez17, T. Mashimo24, P. Mättig26, W.J. McDonald30, J. McKenna29, E.A. Mckigney15, T.J. McMahon1, R.A. McPherson28, F. Meijers8, S. Menke3, F.S. Merritt9, H. Mes7, J. Meyer27, A. Michelini2, S. Mihara24, G. Mikenberg26, D.J. Miller15, R. Mir26, W. Mohr10, A. Montanari2, T. Mori24, K. Nagai8, I. Nakamura24, H.A. Neal12, B. Nellen3, R. Nisius8, S.W. O’Neale1, F.G. Oakham7, F. Odorici2, H.O. Ogren12, M.J. Oreglia9, S. Orito24, J. Pálinkás33,d, G. Pásztor32, J.R. Pater16, G.N. Patrick20, J. Patt10, R. Perez-Ochoa8, S. Petzold27, P. Pfeifenschneider14, J.E. Pilcher9, J. Pinfold30, D.E. Plane8, P. Poffenberger28, J. Polok8, M. Przybycień8, C. Rembser8, H. Rick8, S. Robertson28, S.A. Robins22, N. Rodning30, J.M. Roney28, K. Roscoe16, A.M. Rossi2, Y. Rozen22, K. Runge10, O. Runolfsson8, D.R. Rust12, K. Sachs10, T. Saeki24, O. Sahr34, W.M. Sang25, E.K.G. Sarkisyan23, C. Sbarra29, A.D. Schaile34, O. Schaile34, F. Scharf3, P. Scharff-Hansen8, J. Schieck11, B. Schmitt8, S. Schmitt11, A. Schöning8, M. Schröder8, M. Schumacher3, C. Schwick8, W.G. Scott20, R. Seuster14, T.G. Shears8, B.C. Shen4, C.H. Shepherd-Themistocleous8, P. Sherwood15, G.P. Siroli2, A. Sittler27, A. Skuja17, A.M. Smith8, G.A. Snow17, R. Sobie28, S. Söldner-Rembold10, M. Sproston20, A. Stahl3, K. Stephens16, J. Steuerer27, K. Stoll10, D. Strom19, R. Ströhmer34, B. Surrow8, S.D. Talbot1, S. Tanaka24, P. Taras18, S. Tarem22, R. Teuscher8, M. Thiergen10, M.A. Thomson8, E. von Törne3, E. Torrence8, S. Towers6, I. Trigger18, Z. Trócsányi33, E. Tsur23, A.S. Turcot9, M.F. Turner-Watson8, R. Van Kooten12, P. Vannerem10, M. Verzocchi10, H. Voss3, F. Wäckerle10, A. Wagner27, C.P. Ward5, D.R. Ward5, P.M. Watkins1, A.T. Watson1, N.K. Watson1, P.S. Wells8, N. Wermes3, J.S. White6, G.W. Wilson16, J.A. Wilson1, T.R. Wyatt16, S. Yamashita24, G. Yekutieli26, V. Zacek18, D. Zer-Zion8
1School of Physics and Astronomy, University of Birmingham,
Birmingham B15 2TT, UK
2Dipartimento di Fisica dell’ Università di Bologna and INFN,
I-40126 Bologna, Italy
3Physikalisches Institut, Universität Bonn,
D-53115 Bonn, Germany
4Department of Physics, University of California,
Riverside CA 92521, USA
5Cavendish Laboratory, Cambridge CB3 0HE, UK
6Ottawa-Carleton Institute for Physics,
Department of Physics, Carleton University,
Ottawa, Ontario K1S 5B6, Canada
7Centre for Research in Particle Physics,
Carleton University, Ottawa, Ontario K1S 5B6, Canada
8CERN, European Organisation for Particle Physics,
CH-1211 Geneva 23, Switzerland
9Enrico Fermi Institute and Department of Physics,
University of Chicago, Chicago IL 60637, USA
10Fakultät für Physik, Albert Ludwigs Universität,
D-79104 Freiburg, Germany
11Physikalisches Institut, Universität
Heidelberg, D-69120 Heidelberg, Germany
12Indiana University, Department of Physics,
Swain Hall West 117, Bloomington IN 47405, USA
13Queen Mary and Westfield College, University of London,
London E1 4NS, UK
14Technische Hochschule Aachen, III Physikalisches Institut,
Sommerfeldstrasse 26-28, D-52056 Aachen, Germany
15University College London, London WC1E 6BT, UK
16Department of Physics, Schuster Laboratory, The University,
Manchester M13 9PL, UK
17Department of Physics, University of Maryland,
College Park, MD 20742, USA
18Laboratoire de Physique Nucléaire, Université de Montréal,
Montréal, Quebec H3C 3J7, Canada
19University of Oregon, Department of Physics, Eugene
OR 97403, USA
20CLRC Rutherford Appleton Laboratory, Chilton,
Didcot, Oxfordshire OX11 0QX, UK
22Department of Physics, Technion-Israel Institute of
Technology, Haifa 32000, Israel
23Department of Physics and Astronomy, Tel Aviv University,
Tel Aviv 69978, Israel
24International Centre for Elementary Particle Physics and
Department of Physics, University of Tokyo, Tokyo 113, and
Kobe University, Kobe 657, Japan
25Institute of Physical and Environmental Sciences,
Brunel University, Uxbridge, Middlesex UB8 3PH, UK
26Particle Physics Department, Weizmann Institute of Science,
Rehovot 76100, Israel
27Universität Hamburg/DESY, II Institut für Experimental
Physik, Notkestrasse 85, D-22607 Hamburg, Germany
28University of Victoria, Department of Physics, P O Box 3055,
Victoria BC V8W 3P6, Canada
29University of British Columbia, Department of Physics,
Vancouver BC V6T 1Z1, Canada
30University of Alberta, Department of Physics,
Edmonton AB T6G 2J1, Canada
31Duke University, Dept of Physics,
Durham, NC 27708-0305, USA
32Research Institute for Particle and Nuclear Physics,
H-1525 Budapest, P O Box 49, Hungary
33Institute of Nuclear Research,
H-4001 Debrecen, P O Box 51, Hungary
34Ludwigs-Maximilians-Universität München,
Sektion Physik, Am Coulombwall 1, D-85748 Garching, Germany
a and at TRIUMF, Vancouver, Canada V6T 2A3
b and Royal Society University Research Fellow
c and Institute of Nuclear Research, Debrecen, Hungary
d and Department of Experimental Physics, Lajos Kossuth
University, Debrecen, Hungary
e on leave of absence from the University of Freiburg
1 Introduction
Measurements of event shape variables in hadronic annihilations were amongst the earliest QCD studies performed at LEP [1, 2]. Such observables may be calculated using perturbative QCD, and are hence useful for the measurement of the strong coupling strength, . They are also useful inputs for testing and tuning Monte Carlo models of hadronic processes. An additional test of QCD is provided by the angular dependence of these event shape distributions, which arises because of gluon emission. However, these effects are small, and therefore require the high statistics samples of hadronic decays which are now available from the later years of LEP I running.
At the Born level, with no gluon emission, the spin-1 created from unpolarised beams will decay to spin- quarks with an angular distribution of the form where is the angle between the quark and the e- beam, together with a parity violating term proportional to . This simple picture is modified by QCD effects such as the emission of gluons and subsequent hadronization. The primary quark direction is not directly observable; instead the principal event axis can conveniently be specified by the thrust axis [3]. The thrust variable is defined by
| (1) |
where the sum runs over the particles in the event. The axis which maximizes the expression in parentheses is called the thrust axis. For a three-particle final state, the thrust lies in the range , while for a high multiplicity isotropic distribution of particles the range of extends down to . The general form for the distribution of the polar angle of the thrust axis, , is
| (2) |
where the parity violating terms are absent, since equation (1) shows that the sense of the thrust axis is arbitrary. The terms and are referred to as the longitudinal and transverse cross-sections respectively; the total cross-section . The terminology reflects the fact that a longitudinally polarized , i.e. having spin component zero along the collision axis, would yield a dependence in its decay to fermions, though in the present case this component of the angular distribution is being generated entirely by final state QCD radiation. Note that the longitudinal and transverse cross-sections considered here are not the same as the homonymous quantities which can be extracted from measurement of fragmentation functions in single hadron production [4, 5]. In the present study, we determine from an analysis of the angular distribution of the thrust axis. We also study the dependence of on the value of thrust, .
In ref. [6], the longitudinal cross-section has been computed analytically to as a function of thrust:
| (3) |
where is the Born cross-section, i.e. the cross-section in the absence of QCD radiation, and the colour factor . In contrast to the overall thrust distribution at , which diverges as [7], the longitudinal cross-section remains finite as . The following prediction for the longitudinal cross-section has been obtained [6]:
| (4) |
where the term is obtained by integration of equation (3), and the relative size of the next-to-leading term is governed by the value of , obtained from numerical integration of the QCD matrix elements. Note that the contribution is very small, of order 1% of the term, leading one to hope that higher order corrections to might also be small, and therefore that a comparison with data is worthwhile. In the present study, we actually determine the ratio of the longitudinal to the total cross-section, for which the QCD prediction is:
| (5) |
where we have used the expression for the total cross-section, .
2 Experimental Procedure
The Opal detector has been described in detail elsewhere [8, 9]. For the present analysis, the essential components are the central tracking detectors and the electromagnetic calorimeter. The tracking system consists of a silicon microvertex detector and three drift chamber systems, all of which lie within an axial magnetic field of 0.435 T. The acceptance of the tracking system, with the quality cuts adopted below, is roughly .‡‡‡ The Opal coordinate system is defined so that is the coordinate parallel to the e- beam, is the coordinate normal to this axis, is the polar angle with respect to and is the azimuthal angle about the -axis. The electromagnetic calorimeter is constructed from lead glass blocks, with a barrel covering and endcaps extending the acceptance to .
Hadronic decays were selected using standard cuts described in ref. [10]. Tracks to be used in the analysis were selected according to the following criteria: transverse momentum greater than 0.1 GeV/, at least 40 reconstructed points in the main drift chamber, extrapolation to the nominal collision point within 2 cm in - and 25 cm in and measured momentum less than 65 GeV/. Energy clusters in the electromagnetic calorimeter were required to have at least 0.25 GeV observed energy, and in the endcap region to contain at least two lead glass blocks. Background from two-photon and events was reduced to a negligible level by demanding at least seven charged tracks, and the number of poorly contained events was reduced by demanding . With these cuts, approximately 2.1 million events were selected from the data recorded in 1993–5, with energies within GeV of the peak.
Simulated events were used to correct the data for the effects of detector resolution and acceptance. The parton shower Monte Carlo Jetset 7.4 [11], with parameters tuned to Opal data [12], was used for this purpose. The events were processed through a simulation of the Opal detector [13], and reconstructed in the same way as data. Approximately 5.6 million simulated events were used in the analysis.
The thrust value and the direction of the thrust axis were computed from the parameters of the observed tracks and clusters. To account for the possible double counting of energy, a standard algorithm [14] was employed. In essence, the procedure involved removing from each energy cluster in the calorimeter the expected energy deposition from any associated charged particles. The experimental resolution on introduced by the detection procedure is typically around 0.015.
The value of was then histogrammed for all events, and also in several separate bins of thrust. The effects of detector acceptance and resolution were corrected using a simple bin-by-bin technique. Each bin in the distribution in data was multiplied by a correction factor, evaluated from the ratio between the corresponding distributions in simulated events at the hadron level and the detector level. The hadron level distribution is computed using the particles remaining after those particles having mean lifetimes shorter than s have decayed. The detector level distribution is calculated using the simulated track and cluster parameters. Alternatively, the data may be corrected to the parton level by using the quarks and gluons resulting from the parton shower instead of the hadrons in the simulated events. In general, the parton level results are more appropriate for comparing with perturbative QCD calculations, while the hadron level results involve less model dependence, and can be compared directly with Monte Carlo models including hadronization.
The corrected distributions were then fitted to the form:
| (6) |
using a least method to determine . A typical fit to a particular bin of thrust is shown in fig. 1, which yielded . The values of for the fits are good; e.g. 79 for 90 degrees of freedom in the example shown.
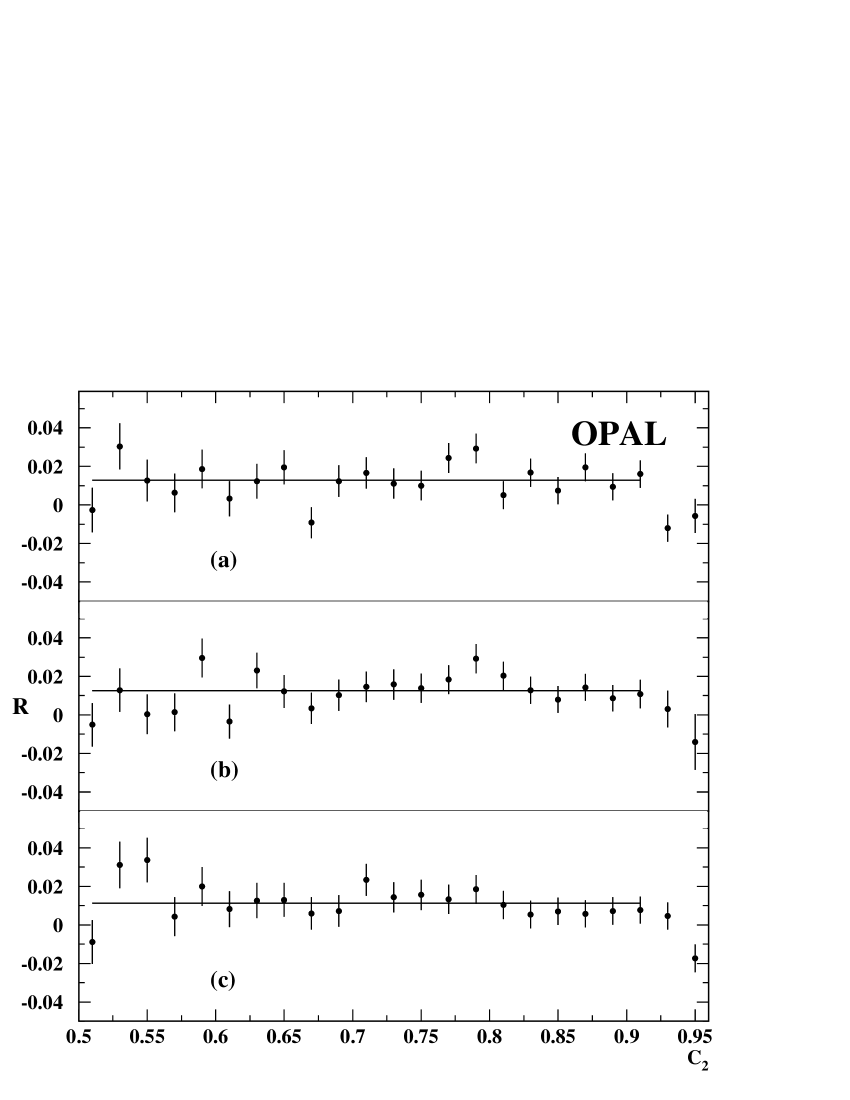
The choice of the range of in which to fit is important. The largest possible range should be used in order to minimize the statistical errors. However, problems could be anticipated around the region , corresponding to the transition between the barrel and endcap detection systems of Opal, and for , where there is a gap in acceptance close to the beam directions. The correction factors increase rapidly for , and accordingly, we restrict the fits for the determination of to the region . To check that no other regions of are significantly biasing the results, the data were considered in pairs of narrow bins of width centred at and . The corrected numbers of events in the two bins, and respectively, can be used to determine the ratio
| (7) |
where , assuming that the value of the function at the centre of the bin is approximately equal to the mean across the bin. In this way, 25 statistically independent measurements of were made. Any anomalous values of would indicate that the corresponding regions of were introducing a bias. In Fig. 2 we show plots of against for various combinations of tracking and calorimetry. The measurements are seen to be compatible with a constant value for .
Systematic errors on are assessed by making the following changes to the analysis:
-
•
Repeat the analysis using tracks only and calorimeter clusters only.
-
•
The cuts for selecting charged tracks are modified: the transverse momentum cut was increased to 0.2 GeV/, the cut on reconstructed points was modified to 20 and the cuts on the extrapolation to the nominal collision point were tightened to 1 cm in - and 10 cm in , and the analysis repeated.
-
•
Energy clusters in the electromagnetic calorimeter were all required to contain at least two lead glass blocks.
The changes in the overall longitudinal cross-section under each of these checks are given in Table 1. The largest change seen in under any of these variant analyses was taken as the systematic error. The largest systematic error arose from the use of calorimeter clusters only, and was found to be associated particularly with the region of high thrust, . The differences between the longitudinal cross-sections at the parton and hadron levels as predicted by the Jetset and Herwig [15] models are equal within errors. Therefore, no systematic error associated with hadronization was assigned.
| Change in analysis | |
|---|---|
| Tracks only | |
| Calorimetry only | |
| Track cut | |
| Track cut | |
| Track points cut | |
| Track cut | |
| Cluster blocks cut |
3 Results
The values found for in the data, integrated over all thrust, corrected to the parton and hadron level respectively are:
The difference between these values reflects the influence of hadronization. We note that the values corrected to the parton and hadron levels are very close, showing that the effect of hadronization on / is, according to the Jetset model, rather small (). An essentially identical difference between parton and hadron levels is predicted by the Herwig model. A current world average value for the strong coupling is [16] . Using equation (5), this yields a prediction at of , where the error arises predominantly from the uncertainty in . This prediction is most appropriately compared with the parton level measurement, which is in excellent agreement with the expectation from QCD.
The measured values for the differential cross-section, , corrected to the hadron level, are presented in Table 2 and Fig. 3(a). Systematic errors have been assessed using the same method as for the overall longitudinal cross-section. In contrast to the overall differential thrust distribution, which is strongly peaked towards corresponding to two-jet events, the longitudinal cross-section displays a broad distribution. The statistical errors on the longitudinal cross-section become larger as , reflecting the fact that the longitudinal cross-section becomes a smaller proportion of the total. The measured value for is negative, though consistent with zero within statistical errors. In Fig. 3(b) we show the longitudinal to total cross-section ratio, , as a function of thrust. The increasing importance of the longitudinal component of the cross-section as thrust decreases is apparent. The ratio is seen to approach the value , corresponding to isotropic orientation of the thrust axis (c.f. equation (2)), for the lowest values of .
| 0.60–0.65 | 0.013 | 0.33 | 0.04 | 0.13 | ||
| 0.65–0.70 | 0.028 | 0.231 | 0.020 | 0.019 | ||
| 0.70–0.75 | 0.037 | 0.126 | 0.013 | 0.031 | ||
| 0.75–0.80 | 0.048 | 0.088 | 0.009 | 0.032 | ||
| 0.80–0.85 | 0.052 | 0.052 | 0.007 | 0.010 | ||
| 0.85–0.90 | 0.045 | 0.023 | 0.005 | 0.003 | ||
| 0.90–0.95 | 0.032 | 0.007 | 0.003 | 0.002 | ||
| 0.95–1.0 | 0.022 | 0.002 | 0.002 | 0.005 | ||
We also show in Figs. 3(a,b) the predictions of the
Jetset [11] (version 7.4), Herwig [15]
(version 5.9) and Ariadne [17] (version 4.08)
parton shower Monte Carlo models.
The parameter sets for Jetset and Herwig are obtained from
fitting to Opal data as described in ref. [12],
except that for Herwig the cluster mass cutoff CLMAX was increased to 3.75 GeV
to improve the modelling of the average charged multiplicity, and the
parameters
for Ariadne are taken from the Opal tuning of ref. [1].
The model predictions
have limited statistical precision, so they are represented by bands
indicating their uncertainties. Both parts of Fig. 3
show similar effects, as expected because a description of the overall
thrust distribution was one of the constraints used in tuning the models.
The Jetset prediction describes the
data well, and indicates that the longitudinal cross-section tends to
fall towards . The Herwig prediction is
in less good agreement with the data,
particularly in the intermediate region around .
The Ariadne model, with the parameters used here, gives a sizeable
overestimate of the longitudinal cross-section at almost all values of .
Other parameter sets for Ariadne, e.g. the defaults or those
given in ref. [18], show essentially the same behaviour.
The overall values of at the hadron level
for the three models are 0.0112 (Jetset), 0.0060 (Herwig)
and 0.0335 (Ariadne), showing again that only Jetset is compatible with
the Opal data.
The measured values for the differential cross-section,
, corrected to the parton level, are presented
in Fig. 4. The differences with respect to the hadron level
distribution (Fig. 3(a)) are small.
The prediction of QCD (equation (3)),
taking =0.119, is shown by the dashed line.
The distribution as a function of thrust
is poorly described, with the calculation significantly
underestimating the data at low thrust.
This is qualitatively the
behaviour predicted in ref. [6], and contrasts with the
case of the longitudinal cross-section integrated over thrust,
where the and calculations are very close, and in good agreement
with data, as noted above.
The QCD prediction for the differential cross-section
may be obtained numerically using the program
EVENT2 [19], and is indicated by the dotted band in
Fig. 4. This calculation gives a much improved
prediction of , though the data
still lie above the prediction for the lowest thrust values, .
At high values of , especially above ,
the errors on the EVENT2
predictions (and on the data) become too large
for any clear conclusion to be drawn, and in consequence
we have not been able to use EVENT2 to validate the calculation
of ref. [6].
4 Summary
In this paper, we have presented a determination of the longitudinal cross-section in hadronic electron-positron annihilations on the peak. The values obtained:
are in good agreement with the prediction of QCD, and also with the only previously published measurement of this quantity [18]. The dependence of the longitudinal cross-section on thrust has been investigated. Good agreement with the Jetset parton shower Monte Carlo model is observed. The Herwig and Ariadne models, with the parameter set tuned to Opal data, show less good agreement. Comparing with fixed order QCD predictions, we find that the QCD prediction differs significantly from the data, while an calculation shows much better agreement. Thus, in contrast to the integrated longitudinal cross-section, the differential cross-section exhibits significant higher order effects.
5 Acknowledgements
We particularly wish to thank the SL Division for the efficient operation
of the LEP accelerator at all energies
and for their continuing close cooperation with
our experimental group. We thank our colleagues from CEA, DAPNIA/SPP,
CE-Saclay for their efforts over the years on the time-of-flight and trigger
systems which we continue to use. In addition to the support staff at our own
institutions we are pleased to acknowledge the
Department of Energy, USA,
National Science Foundation, USA,
Particle Physics and Astronomy Research Council, UK,
Natural Sciences and Engineering Research Council, Canada,
Israel Science Foundation, administered by the Israel
Academy of Science and Humanities,
Minerva Gesellschaft,
Benoziyo Center for High Energy Physics,
Japanese Ministry of Education, Science and Culture (the
Monbusho) and a grant under the Monbusho International
Science Research Program,
German Israeli Bi-national Science Foundation (GIF),
Bundesministerium für Bildung, Wissenschaft,
Forschung und Technologie, Germany,
National Research Council of Canada,
Research Corporation, USA,
Hungarian Foundation for Scientific Research, OTKA T-016660,
T023793 and OTKA F-023259.
References
- [1] Opal Collaboration, M.Z. Akrawy et al., Z. Phys. C47 (1990) 505.
-
[2]
Aleph Collaboration, D. Decamp et al., Phys. Lett. B234 (1990) 209;
Delphi Collaboration, P. Aarnio et al., Phys. Lett. B240 (1990) 271;
L3 Collaboration, B. Adeva et al., Z. Phys. C55 (1992) 39. -
[3]
S. Brandt et al., Phys. Lett. 12 (1964) 57;
E. Farhi, Phys. Rev. Lett. 39 (1977) 1587. - [4] Opal Collaboration, R. Akers et al., Z. Phys. C68 (1995) 203.
- [5] P. Nason and B.R. Webber, Nucl. Phys. B421 (1994) 473.
- [6] B. Lampe, Phys. Lett. B301 (1993) 435.
- [7] A. de Rujula, J. Ellis, E. G. Floratos and M. K. Gaillard, Nucl. Phys. B138 (1978) 387.
- [8] Opal Collaboration, K. Ahmet et al., Nucl. Instr. and Meth. A305 (1991) 275.
-
[9]
P.P. Allport et al., Nucl. Instr. and Meth.
A324 (1993) 34;
P.P. Allport et al., Nucl. Instr. and Meth. A346 (1994) 476. - [10] Opal Collaboration, G. Alexander et al., Z. Phys. C52 (1991) 175.
-
[11]
T. Sjöstrand, Comp. Phys. Commun. 39 (1986) 347;
T. Sjöstrand, Comp. Phys. Commun. 43 (1987 ) 367;
M. Bengtsson and T. Sjöstrand, Nucl. Phys. B289 (1987) 810. - [12] Opal Collaboration, G. Alexander et al., Z. Phys. C69 (1996) 543.
- [13] J. Allison et al., Nucl. Instr. and Meth. A317 (1992) 47.
- [14] Opal Collaboration, K. Ackerstaff et al., Phys. Lett. B389 (1996) 616.
-
[15]
G. Marchesini and B.R. Webber, Nucl. Phys. B310 (1988) 461;
G. Marchesini et al., Comp. Phys. Commun. 67 (1992) 465. - [16] Particle Data Group; C. Caso et al, Eur. Phys. J. C3 (1998) 1.
- [17] L. Lönnblad, Comp. Phys. Commun. 71 (1992) 15.
- [18] Aleph Collaboration, R. Barate et al., Phys. Rep. 294 (1998) 1.
-
[19]
S. Catani and M.H. Seymour, Nucl. Phys. B485 (1997) 291;
erratum Nucl. Phys. B510 (1997) 503.