Search for the decay
Abstract
We report on a search for the rare decay in the KTeV experiment at Fermilab. We searched for two-photon events whose kinematics were consistent with an isolated coming from the decay . One candidate event was observed, which was consistent with the expected level of background. An upper limit on the branching ratio was determined to be at the confidence level.
pacs:
PACS numbers: 11.30.Er, 12.15.Hh, 13.20.Eb, 14.40AqEFI-98-21, FERMILAB-Pub-98/178-E
(EFI-98-21, FERMILAB-Pub-98/178-E, Submitted to Phys. Rev. Lett.)
The rare decay has attracted considerable attention for the purpose of understanding the phenomenology of CP violation because the decay rate results almost entirely from a direct CP violating amplitude [2, 3]. In the Wolfenstein parameterization of the CKM matrix [4, 5], the decay rate is proportional to the square of the parameter , the value of which governs the scale of all CP violating phenomena in the Standard Model. The reliability of the decay rate calculation makes the decay one of the best tools to determine the value of [6, 7]. The predictions for the branching ratio are in the range of using current knowledge of Standard Model parameters, where the theoretical contribution to the uncertainty is on the order of [6]. Therefore, observation of the decay near the predicted rate would provide quantitative evidence in support of the Standard Model description of CP violation, while observation outside the predicted rate would be evidence of new physics [8].
Although the decay is very clean theoretically, it is very challenging experimentally. The experimental difficulty arises from searching for a single isolated in the presence of the much more abundant ’s from and decays. The most sensitive search conducted thus far used the Dalitz decay, , to identify the , and set an upper limit of on the branching ratio [9]. While requiring a Dalitz decay provides a more unambiguous experimental signature, this technique is at least two orders of magnitude less sensitive than a direct search using due to the smaller branching ratio and lower experimental acceptance. A search using is the most viable method of reaching the predicted sensitivity, and is the motivation for the experiment presented here.
The first search for the decay using the decay mode was conducted in the KTeV experiment at Fermilab with data collected in a one-day special run. A plan view of the KTeV detector is shown in Figure 1. For this measurement, a single neutral beam was produced by an 800 GeV proton beam that struck a cm long beryllium-oxide target. The neutral beam was collimated to be in solid angle ( at 159 m downstream of the target), which was narrower than the nominal KTeV beam size of . The narrower beam provides a tighter constraint on the decay position in the plane transverse to the beam direction, which improves our ability to measure the transverse momentum of the . The beam entered an evacuated decay volume which extended from m to m downstream of the target. The downstream end of the volume was closed by a vacuum window made of Kevlar and Mylar with a total thickness of radiation lengths. The vacuum was maintained below torr. The neutral beam was composed of neutrons and with the relative ratio of . A small component of other long-lived neutral particles, such as , , , and was also present. The beam flux of neutral hadrons resulting from protons per spill on target was approximately . The average kaon momentum was .
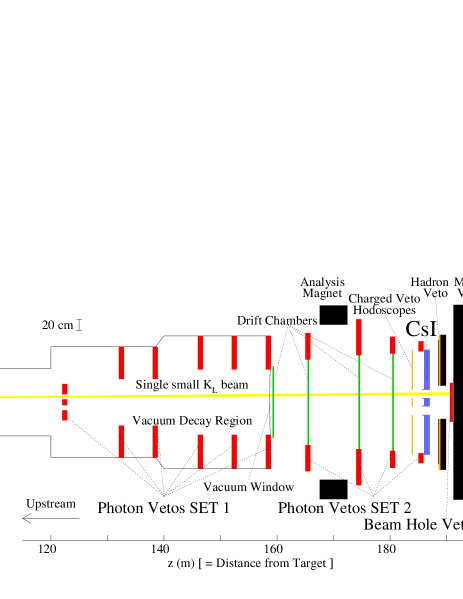
The most crucial detector elements for this analysis are a pure CsI electromagnetic calorimeter and a photon veto system. The calorimeter is comprised of 3100 blocks in a m by m square array, which is 27 radiation lengths deep. The energy resolution for electrons with an energy between 2 and 60 GeV in this data set is approximately . The calorimeter has two square holes which allow for the passage of two kaon beams used by the and other rare kaon decay measurements made by the KTeV experiment [10]. The photon veto system is composed of eleven sets of lead/scintillator sandwich detectors (the set-1, set-2 and the beam hole veto). The photon veto detector located the farthest upstream has two beam holes and defines the upstream fiducial decay volume at m. This veto detector is followed by nine sets of photon veto detectors which provide hermetic photon coverage up to an angle of 100 mr with respect to the beam direction. The last photon veto detector is the beam hole veto (BHV) which is located in the beam region and comprises part of the beam dump. The BHV is designed to identify photons and neutrons passing through the beam holes of the calorimeter. The BHV is longitudinally segmented into three sections which are each 10 radiation lengths ( interaction lengths) deep. The two upstream sections are used to identify photons and measure their energy, and the downstream section is used to identify neutrons. For this analysis, the charged spectrometer, which consists of four planar drift chambers and an analyzing magnet with a momentum kick of 205 , is used to veto events with a charged particle. Upstream of the calorimeter, there are charged veto hodoscopes used to veto events containing a charged particle. Downstream of the calorimeter, another set of hodoscopes (the hadron veto), preceded by 10 cm of lead, is used to veto events with a hadron that hits the calorimeter. Farther downstream, there are three meters of iron followed by a hodoscope (the muon veto), which is used to veto events with a muon.
The trigger was designed to accept and decays. The latter decay mode was used to measure the kaon flux of the experiment. The calorimeter was required to have an energy deposit greater than 5 GeV. All of the hodoscopes were required to have no activity. Events with an energy deposit above MeV in the photon veto detectors were rejected. A hardware cluster counter processor [11] selected events with two or four isolated clusters of energy in the calorimeter with at least one block in each cluster having an energy greater than 1 GeV.
In the offline analysis, candidate events are selected by requiring exactly two photons in the final state, each with energy greater than 1 GeV. Events with more than two clusters of energy above GeV in the CsI calorimeter are rejected. Nearby photons with overlapping energy deposits in the calorimeter could reconstruct as a single cluster. These events are rejected by requiring the transverse profile of each of the clusters to be consistent with that of a single electromagnetic shower. To detect low energy photons which miss the calorimeter, an energy threshold of 70 MeV is imposed on the set-1 photon veto system located inside the evacuated volume (see Figure 1). An energy threshold of 5 MeV is applied to the set-2 photon veto system located downstream of the vacuum window. The lower threshold on the set-2 photon vetos is imposed in order to detect the lower energy particles which may result from neutron interactions in the detector. An energy threshold of 1 GeV is applied to each section of the beam hole veto to eliminate events in which a photon or a neutron passing through the CsI beam holes hits the detector. Events containing hits in drift chambers are eliminated in order to remove backgrounds containing a charged particle that misses the charged veto hodoscopes.
After the initial event selection, the z position of the decay vertex of the event is calculated by requiring that the reconstructed two-photon mass is consistent with a . The z position is expressed as:
where is the z position of the calorimeter, is the distance between the two photons in the calorimeter, is the mass and is the energy of the -th photon. The transverse momentum of the two photons relative to the beam direction, , is also calculated by assuming that the decay occurred at the transverse center of the beam. An unbalanced distribution is a characteristic feature of the decay , as shown in Figure 2. Figure 2 also shows a scatter plot of the spectrum versus the z decay vertex for data. Neutral pions which are produced by neutron interactions in the vacuum window at m can be clearly seen. The events clustered around and m are consistent with decays, where the resulting can have a as high as . To reduce these backgrounds, only those decays which have a reconstructed z vertex between 125 and 157 m and between 160 and 260 are selected. The cut at 260 corresponds to the kinematic limit for decays, allowing for resolution effects. The requirements on the z vertex and decrease the signal acceptance by ; 177 out of 18,586 events pass these requirements.

Additional background results from events which decay upstream of the photon veto detector at m. In these events, two photons from different ’s pass through the beam holes of this detector while the remaining photons go undetected. The decay vertex position of such events which are misreconstructed as a can be shifted downstream into the fiducial region. These events can be identified by their large horizontal transverse momentum, , because these photons pass through the two horizontally separated beam holes of the detector. The ratio of is required to be less than in order to suppress this background.
Most of the ’s which decay in the detector are produced in the target and are eliminated by the cut described above. A small fraction of the observed decays, however, are the result of decays which yield ’s with a larger than those from primary ’s. Since the ’s have higher momentum than kaons on average, the background is suppressed by requiring the total energy in the calorimeter to be less than 35 , which results in a loss in sensitivity for the decay . The background can be further suppressed by eliminating events with very asymmetric photon energies. The ratio of the maximum photon energy to the minimum photon energy is required to be less than 6.
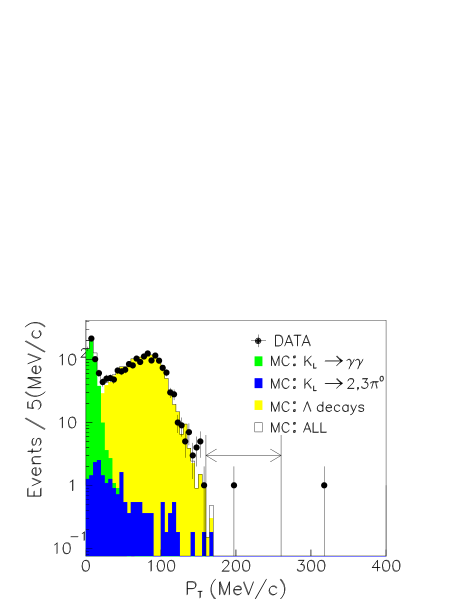
Figure 3 shows the distribution for events passing all cuts except for the cut. One event remains in the signal region, and another event appears in the region above the window. As discussed below, these two remaining events are consistent with background events from neutron interactions. Neutrons which interact with material such as the vacuum window or the drift chambers can produce one or more ’s or ’s. Interactions which produce ’s are potential background sources since the z vertex is miscalculated due to the mass assignment. Interactions which produce multiple ’s are additional background sources since the z vertex can be misreconstructed inside the fiducial volume when only two photons from different ’s are detected.
The background from neutron interactions that produce either ’s or multiple ’s was estimated by removing the requirement on the BHV and then determining how many of these events have an undetected neutron. Even when the neutron is not detected, one of the photons from multiple ’s can hit the BHV, and must be accounted for in the background estimate. Using a clean sample of decays, the BHV efficiency for a neutron was measured to be and in the upstream and downstream sections, respectively. When the BHV cut is removed, 37 events remain. The number of events detected in the downstream section (31) is consistent with the expectation from neutrons, but the number of events detected in the upstream section (26) is larger than the expectation from neutrons. The excess in the upstream section is assumed to be due to an extra photon hitting the BHV in of the events. Using the neutron detection efficiency in all sections of the BHV () and the probability that an extra photon hits the BHV, the background estimate is events. Therefore, we conclude that the one observed event in the signal region is consistent with background from neutron interactions. The background from neutron interactions also accounts for the event with above the signal region.
In addition to the neutron interaction background, background from , , and decays are estimated from Monte Carlo simulations with 7 times the statistics of the data. The distribution below 160 is well reproduced by the simulation, as shown in Figure 3. The background level from decays is estimated to be events in the signal region. The background level from and decays is estimated to be events which are already included in the estimate of the neutron interaction background due to the existence of a neutron in the decay.
To determine the number of kaon decays in the fiducial volume of the detector, we select a sample of decays using selection criteria similar to those used for the decay. The sample consists of 4326 events with an estimated background of 44 events. From a Monte Carlo simulation, the detector acceptances for the decays and are determined to be and , respectively, for kaon energies between 10 and 230 GeV within the decay region between 120 and 160 m. The total systematic error is determined to be , including uncertainties in the acceptance calculation due to possible trigger bias, energy measurement and the treatment of accidental activity in the detector.
Using [12], the number of kaon decays for the experiment is measured to be . The single event sensitivity for the decay is . Conservatively assuming that the last remaining event is signal, the upper limit on the branching ratio is determined to be at the confidence level, where both statistical and systematic errors are included [13]. The sensitivity of this search represents a factor of improvement relative to the best previous limit [9]. Further improvement using this technique will require a significant reduction in the amount of material in the beam.
We gratefully acknowledge the support and effort of the Fermilab staff and the technical staffs of the participating institutions for their vital contributions. This work was supported in part by the U.S. Department of Energy, The National Science Foundation and The Ministry of Education and Science of Japan. In addition, A.R.B., E.B. and S.V.S. acknowledge support from the NYI program of the NSF; A.R.B. and E.B. from the Alfred P. Sloan Foundation; E.B. from the OJI program of the DOE; K.H., T.N. and M.S. from the Japan Society for the Promotion of Science. P.S.S. acknowledges receipt of a Grainger Fellowship.
REFERENCES
- [1] To whom correspondence should be addressed. Electronic address: nakaya@fnal.gov
- [2] J. Ellis et al., Nucl. Phys. B109, 213 (1976).
- [3] L. Littenberg, Phys. Rev. D39, 3322 (1989).
- [4] M. Kobayashi and K. Maskawa, Prog. Theor. Phys. 49, 652 (1973).
- [5] L. Wolfenstein, Phys. Rev. Lett. 51, 1945 (1983).
- [6] A. Buras, Phys. Lett. B333, 476 (1994).
- [7] G. Buchalla and A. Buras, Phys. Rev. D54, 6782 (1996).
- [8] Y. Grossman and Y. Nir, Phys. Lett. B398, 163 (1997).
- [9] M. Weaver et al., Phys. Rev. Lett. 72, 3758 (1994).
- [10] K. Arisaka et al., “KTeV Design Report” Fermilab Report FN580 (1992).
- [11] C. Bown et al., Nucl. Instrum. Methods A369, 248 (1996).
- [12] Particle Data Group, Phys. Rev. D54, S1 (1996).
- [13] R. D. Cousins, Nucl. Instrum. Methods A320, 331 (1992).