Continuum Charged Spin Alignment
at GeV
Abstract
A measurement of the spin alignment of charged mesons produced in continuum events at GeV is presented. This study using 4.72 fb-1 of CLEO II data shows that there is little evidence of any spin alignment.
G. Brandenburg,1 R. A. Briere,1 A. Ershov,1 Y. S. Gao,1 D. Y.-J. Kim,1 R. Wilson,1 H. Yamamoto,1 T. E. Browder,2 Y. Li,2 J. L. Rodriguez,2 T. Bergfeld,3 B. I. Eisenstein,3 J. Ernst,3 G. E. Gladding,3 G. D. Gollin,3 R. M. Hans,3 E. Johnson,3 I. Karliner,3 M. A. Marsh,3 M. Palmer,3 M. Selen,3 J. J. Thaler,3 K. W. Edwards,4 A. Bellerive,5 R. Janicek,5 D. B. MacFarlane,5 P. M. Patel,5 A. J. Sadoff,6 R. Ammar,7 P. Baringer,7 A. Bean,7 D. Besson,7 D. Coppage,7 C. Darling,7 R. Davis,7 S. Kotov,7 I. Kravchenko,7 N. Kwak,7 L. Zhou,7 S. Anderson,8 Y. Kubota,8 S. J. Lee,8 J. J. O’Neill,8 R. Poling,8 T. Riehle,8 A. Smith,8 M. S. Alam,9 S. B. Athar,9 Z. Ling,9 A. H. Mahmood,9 S. Timm,9 F. Wappler,9 A. Anastassov,10 J. E. Duboscq,10 D. Fujino,10,***Permanent address: Lawrence Livermore National Laboratory, Livermore, CA 94551. K. K. Gan,10 T. Hart,10 K. Honscheid,10 H. Kagan,10 R. Kass,10 J. Lee,10 M. B. Spencer,10 M. Sung,10 A. Undrus,10,†††Permanent address: BINP, RU-630090 Novosibirsk, Russia. A. Wolf,10 M. M. Zoeller,10 B. Nemati,11 S. J. Richichi,11 W. R. Ross,11 H. Severini,11 P. Skubic,11 M. Bishai,12 J. Fast,12 J. W. Hinson,12 N. Menon,12 D. H. Miller,12 E. I. Shibata,12 I. P. J. Shipsey,12 M. Yurko,12 S. Glenn,13 Y. Kwon,13,‡‡‡Permanent address: Yonsei University, Seoul 120-749, Korea. A.L. Lyon,13 S. Roberts,13 E. H. Thorndike,13 C. P. Jessop,14 K. Lingel,14 H. Marsiske,14 M. L. Perl,14 V. Savinov,14 D. Ugolini,14 X. Zhou,14 T. E. Coan,15 V. Fadeyev,15 I. Korolkov,15 Y. Maravin,15 I. Narsky,15 V. Shelkov,15 J. Staeck,15 R. Stroynowski,15 I. Volobouev,15 J. Ye,15 M. Artuso,16 F. Azfar,16 A. Efimov,16 M. Goldberg,16 D. He,16 S. Kopp,16 G. C. Moneti,16 R. Mountain,16 S. Schuh,16 T. Skwarnicki,16 S. Stone,16 G. Viehhauser,16 J.C. Wang,16 X. Xing,16 J. Bartelt,17 S. E. Csorna,17 V. Jain,17,§§§Permanent address: Brookhaven National Laboratory, Upton, NY 11973. K. W. McLean,17 S. Marka,17 R. Godang,18 K. Kinoshita,18 I. C. Lai,18 P. Pomianowski,18 S. Schrenk,18 G. Bonvicini,19 D. Cinabro,19 R. Greene,19 L. P. Perera,19 G. J. Zhou,19 M. Chadha,20 S. Chan,20 G. Eigen,20 J. S. Miller,20 M. Schmidtler,20 J. Urheim,20 A. J. Weinstein,20 F. Würthwein,20 D. W. Bliss,21 G. Masek,21 H. P. Paar,21 S. Prell,21 V. Sharma,21 D. M. Asner,22 J. Gronberg,22 T. S. Hill,22 D. J. Lange,22 R. J. Morrison,22 H. N. Nelson,22 T. K. Nelson,22 D. Roberts,22 B. H. Behrens,23 W. T. Ford,23 A. Gritsan,23 J. Roy,23 J. G. Smith,23 J. P. Alexander,24 R. Baker,24 C. Bebek,24 B. E. Berger,24 K. Berkelman,24 K. Bloom,24 V. Boisvert,24 D. G. Cassel,24 D. S. Crowcroft,24 M. Dickson,24 S. von Dombrowski,24 P. S. Drell,24 K. M. Ecklund,24 R. Ehrlich,24 A. D. Foland,24 P. Gaidarev,24 L. Gibbons,24 B. Gittelman,24 S. W. Gray,24 D. L. Hartill,24 B. K. Heltsley,24 P. I. Hopman,24 J. Kandaswamy,24 P. C. Kim,24 D. L. Kreinick,24 T. Lee,24 Y. Liu,24 N. B. Mistry,24 C. R. Ng,24 E. Nordberg,24 M. Ogg,24,¶¶¶Permanent address: University of Texas, Austin TX 78712. J. R. Patterson,24 D. Peterson,24 D. Riley,24 A. Soffer,24 B. Valant-Spaight,24 C. Ward,24 M. Athanas,25 P. Avery,25 C. D. Jones,25 M. Lohner,25 S. Patton,25 C. Prescott,25 J. Yelton,25 and J. Zheng25
1Harvard University, Cambridge, Massachusetts 02138
2University of Hawaii at Manoa, Honolulu, Hawaii 96822
3University of Illinois, Urbana-Champaign, Illinois 61801
4Carleton University, Ottawa, Ontario, Canada K1S 5B6
and the Institute of Particle Physics, Canada
5McGill University, Montréal, Québec, Canada H3A 2T8
and the Institute of Particle Physics, Canada
6Ithaca College, Ithaca, New York 14850
7University of Kansas, Lawrence, Kansas 66045
8University of Minnesota, Minneapolis, Minnesota 55455
9State University of New York at Albany, Albany, New York 12222
10Ohio State University, Columbus, Ohio 43210
11University of Oklahoma, Norman, Oklahoma 73019
12Purdue University, West Lafayette, Indiana 47907
13University of Rochester, Rochester, New York 14627
14Stanford Linear Accelerator Center, Stanford University, Stanford, California 94309
15Southern Methodist University, Dallas, Texas 75275
16Syracuse University, Syracuse, New York 13244
17Vanderbilt University, Nashville, Tennessee 37235
18Virginia Polytechnic Institute and State University, Blacksburg, Virginia 24061
19Wayne State University, Detroit, Michigan 48202
20California Institute of Technology, Pasadena, California 91125
21University of California, San Diego, La Jolla, California 92093
22University of California, Santa Barbara, California 93106
23University of Colorado, Boulder, Colorado 80309-0390
24Cornell University, Ithaca, New York 14853
25University of Florida, Gainesville, Florida 32611
I Introduction
There have been numerous theoretical [1, 2, 3, 4, 5, 6, 7] and experimental [8, 9, 10, 11, 12, 13, 14, 15] studies of the fragmentation of heavy quarks. The energy distribution and flavor dependence of heavy quark hadronization have been modeled by fragmentation functions. The role that spin plays in the hadronization process is still being investigated and is not well understood at this time[16, 17, 18, 19, 20, 21, 22]. To increase the understanding of this role, a precise measurement of the probabilities of a meson being directly produced in each of the available spin states is needed.
At CLEO, the fragmentation of charm quarks can be analyzed by making measurements of primary hadrons containing charm quarks from continuum annihilations. CLEO has previously published results of charmed meson energy distributions [8] as well as the spin alignment of charged mesons[18]. In this paper an updated measurement of the charged spin alignment using the entire CLEO II dataset is presented.
II Polarization, Alignment, and
According to the quark model, a meson is composed of two spin valence quarks that can combine to form four spin states in the absence of orbital angular momentum, i.e. four -wave states. Writing these in the basis of total angular momentum, , and its -component, , they are the vector states , , , and the pseudoscalar state , where the -direction can be arbitrarily chosen. The probability of an -wave meson being produced in a vector state is often described by the ratio defined as
where and are the respective probabilities of the meson being created in the pseudoscalar and vector states.
The helicity formalism is useful in the context of describing the angular distributions and correlations in the production and decay of particles with non-zero spin. For a particle with momentum , the helicity is defined as
which in the case of a spin-1 particle is just the -component of the spin when the -direction has been chosen as the flight direction of the meson. The helicity density matrix is often used to organize information about the spin of a particle. The diagonal elements of this matrix , with , represent the probability that the particle has helicity .
Simple statistical expectations are that all helicity states of a spin particle are equally populated, but production and fragmentation dynamics can lead to either polarized or aligned particles. A system of particles is polarized if there is a net angular momentum, i.e. for some helicity , and it is aligned if there is a nonuniform population of states, but for all . Since the production and fragmentation processes in this analysis conserve parity and the CESR beams are unpolarized, it is expected that the mesons from are unpolarized, but it is possible for the mesons to be aligned.
To measure the spin alignment of a vector meson, the angular distribution of its decay products is analyzed, but because the angular distributions of the and states are degenerate, the values of and cannot be distinguished and only one variable, e.g. , is accessible. From the definition above, the vector meson is aligned if differs from . For the case of a vector meson decaying to two pseudoscalar mesons, the angular distribution can be written
where is defined as the angle of a daughter pseudoscalar in the parent vector meson rest frame, with respect to the direction of motion of the parent vector meson in the rest frame of the production process. In our case, the production rest frame of a directly produced in charm fragmentation from annihilation coincides with the lab frame.
By using the variable
the angular distribution can be expressed as
where is a normalization factor equal to . The value of can range between and , where the angular distribution would be isotropic if , proportional to if and proportional to if .
Whereas the naive statistical expectation is that all four -wave meson states are created in equal proportions, i.e. () and , there are other models that have been presented where the alignment and vary as a function of momentum[23, 24]. Heavy quark symmetry predicts that vector mesons containing a single heavy quark are produced unaligned, but there have been suggestions that the value of may depend upon the mass difference of the vector and pseudoscalar mesons[3, 25]. It has also been suggested that is directly related to the spin alignment [26] and in the previous CLEO spin alignment analysis, a value for was calculated using this relationship [18]. However, the validity of the statistical model is assumed when deriving this relationship. We feel that a determination of for mesons warrants an independent measurement which is the topic of a current CLEO analysis. The results of the analysis will be presented in a future paper.
III Detector and Event Selection
The CLEO II detector is a general purpose charged and neutral particle detector and is described in detail elsewhere [27]. The dataset used in this analysis consists of 3.11 fb-1 of data collected at the resonance and 1.61 fb-1 of data collected about 60 MeV below the resonance. This corresponds to approximately 5 million continuum events.
The in this analysis is required to decay through the channel with the decaying either through the mode or (inclusion of charge conjugate modes is implied throughout this paper). The in the decay is kinematically limited to having a momentum less than 456 MeV/ in the lab frame of reference, and is referred to as the “slow” pion.
All tracks used in this analysis are required to have an impact parameter within 5 mm of the interaction point in the plane transverse to the beam pipe and within 50 mm in the direction of the beam pipe. Tracks are also required to have a momentum less than 6 GeV/ and an r.m.s. residual less than 1 mm for their hits. Particle ID is not used since there is little gain for this particular analysis and it introduces the possibility of additional systematic errors. For a pair of photons to be considered as a candidate , they must each have an energy of at least 100 MeV, be within the “good” barrel of the detector (), have a shower shape in the crystal calorimeters consistent with that of a photon, combine to be within 20 MeV/ of the neutral pion mass, and have , where is the decay angle of the photon in the rest frame, with respect to the direction of motion in the lab frame.
For the mode, the is reconstructed by taking all possible pairs of oppositely charged tracks in an event, assigning the kaon mass to one and the pion mass to the other (or vice versa), adding their four-momenta, and then calculating the invariant mass. The is reconstructed by adding the four-momentum of a candidate slow in the event to the four-momentum of the candidate . The mass difference, , between the candidate and is required to be within 2.5 MeV/ of the world-average mass difference of 145.42 MeV/ [28].
The is spinless and the decay products have an isotropic angular distribution. However, due to the jet-like nature of continuum events, the background from random track combinations tends to have , where is the decay angle of the in the rest frame, relative to the motion in the lab frame. A requirement that is added to improve the signal-to-background ratio.
For the mode, the four-momentum of a candidate is added to the four-momenta of two oppositely charged tracks to form candidate ’s in the event. Mass difference and kaon decay angle requirements are the same as described above.
IV Fitting
To test models that predict that the alignment varies as a function of the momentum of the , the data are broken up into six bins in the range 0.25 to 1.0, where is a Lorentz-invariant variable defined as
where , and is the world-average value for the mass of a .
For each range, a sideband subtraction is performed. The sideband region is from 9 MeV/ to 12 MeV/ above the mean of the peak and the ratio for the sideband subtraction is determined by fitting the data with a bifurcated double Gaussian for the signal plus a background function and integrating the background shape for the signal and sideband regions. The fits used to determine the sideband ratios are shown in Figures 1 and 2.
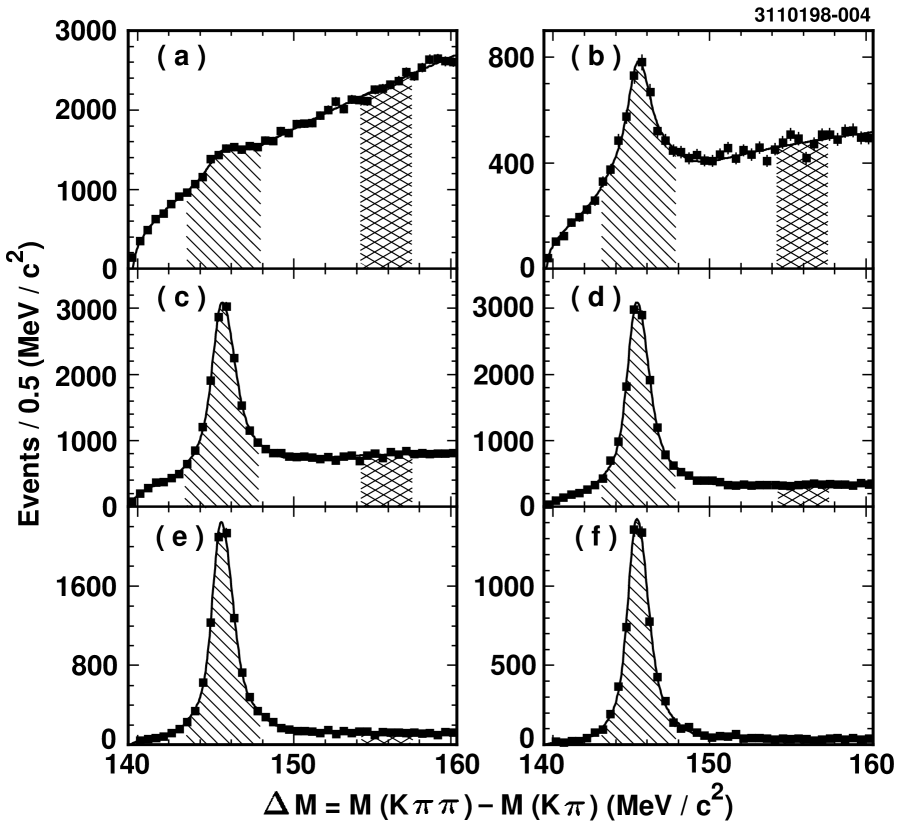
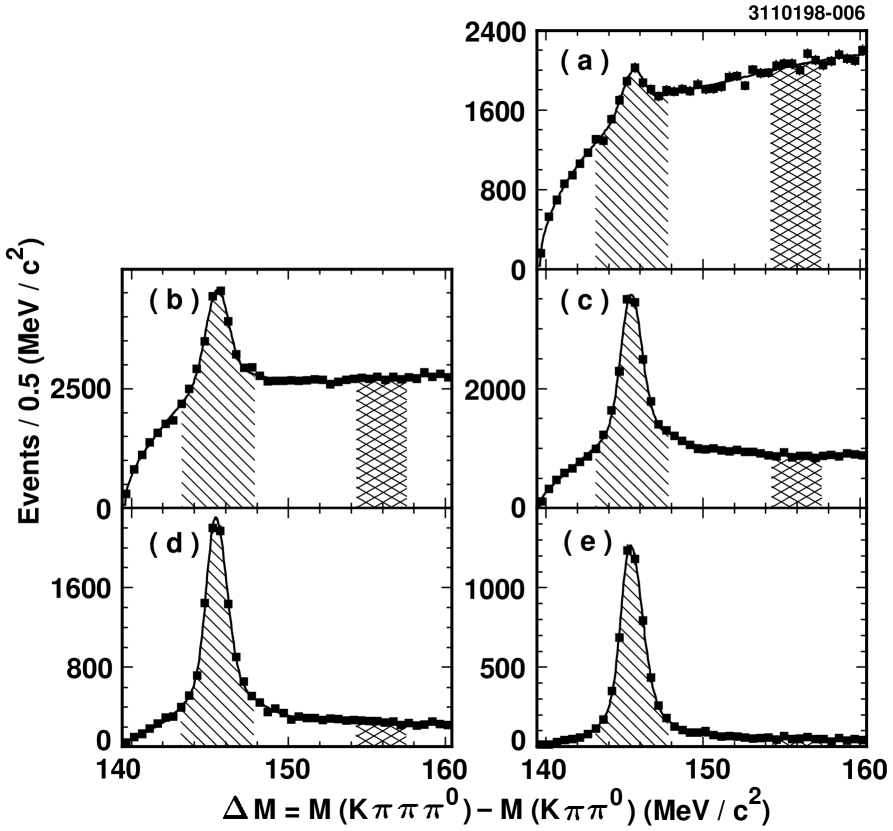
The sideband-subtracted data is fit for each bin with a double Gaussian for the signal region plus a first-order polynomial background. 111The highest bin is fit with a second order polynomial for the background since the background is not well represented by a straight line. Each of these bins is broken up into five equal bins, where is the angle defined in Section II. To prevent the fitted signal shape from having large fluctuations due to lower statistics in some bins, the mass peak is fit for each bin with the ratios of areas and widths of the double Gaussian fixed to those found when fitting the mass peak in that momentum range for the entire spectrum.
V Efficiencies
It is important to understand the relative efficiencies of detecting a in the various bins. In the lowest momentum bins, for example, the efficiency decreases as approaches one because of the increased difficulty in measuring the track of a slow pion that is emitted in the direction opposite the direction in the lab frame. Detection efficiency as a function of and was measured by analyzing Monte Carlo data with a GEANT-based detector simulation.
Monte Carlo events were generated using the Lund Jetset 7.3 program, where the annihilation was required to result in a pair with one of the charm quarks hadronizing to a that decays to with , while no constraints were placed on the other charm quark. The mesons were produced such that their decay to had an isotropic angular distribution in the rest frame of the .
VI Results
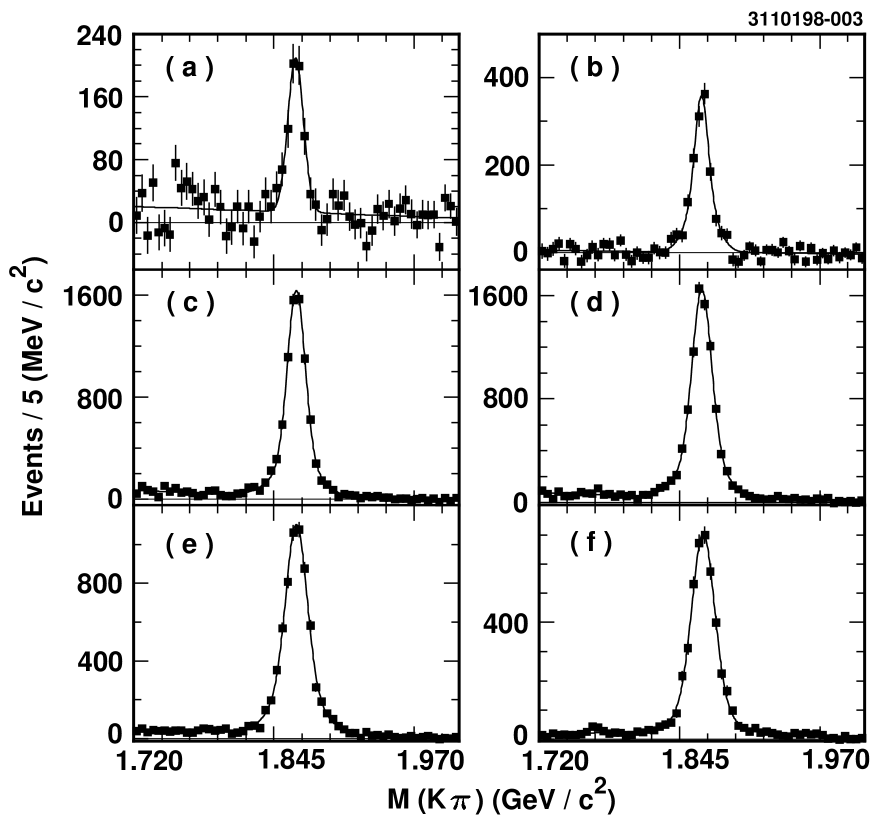
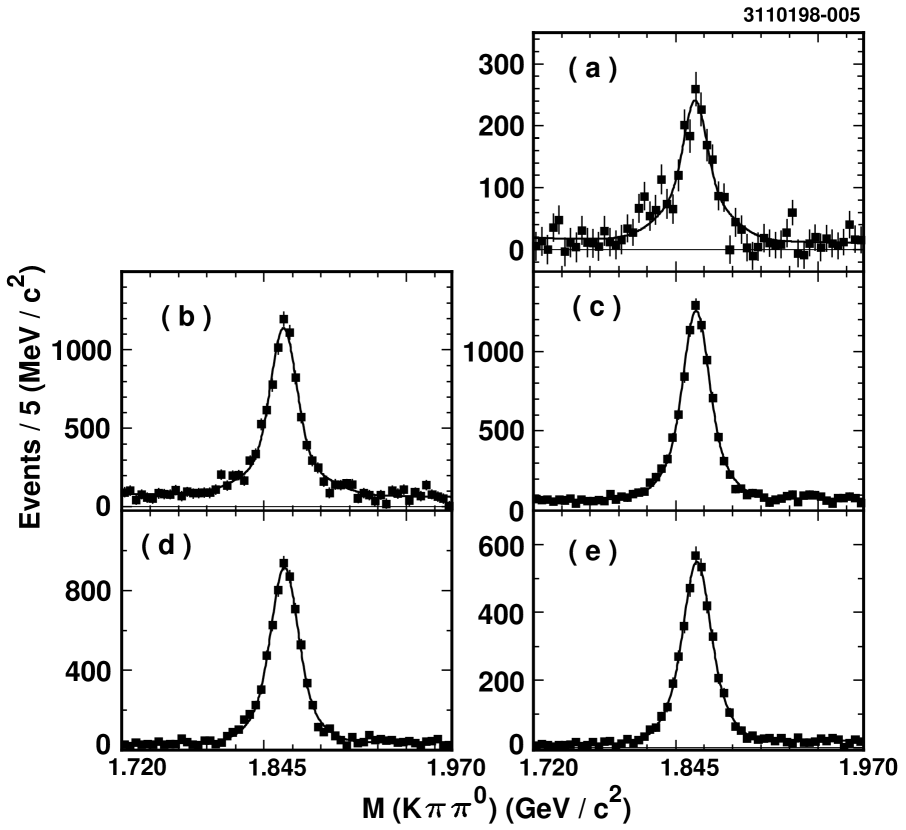
The fits of the sideband subtracted and distributions for all scaled momentum ranges are shown in Figures 3 and 4.222Only the highest five momentum bins were used for the mode due to the small number of signal events and low signal-to-noise ratio in the lowest range. The efficiency-corrected angular distributions for both decay modes were combined in each bin with a weighted average and are shown in Figure 5, where they have each been normalized to unit area and fit with Eq. (5).
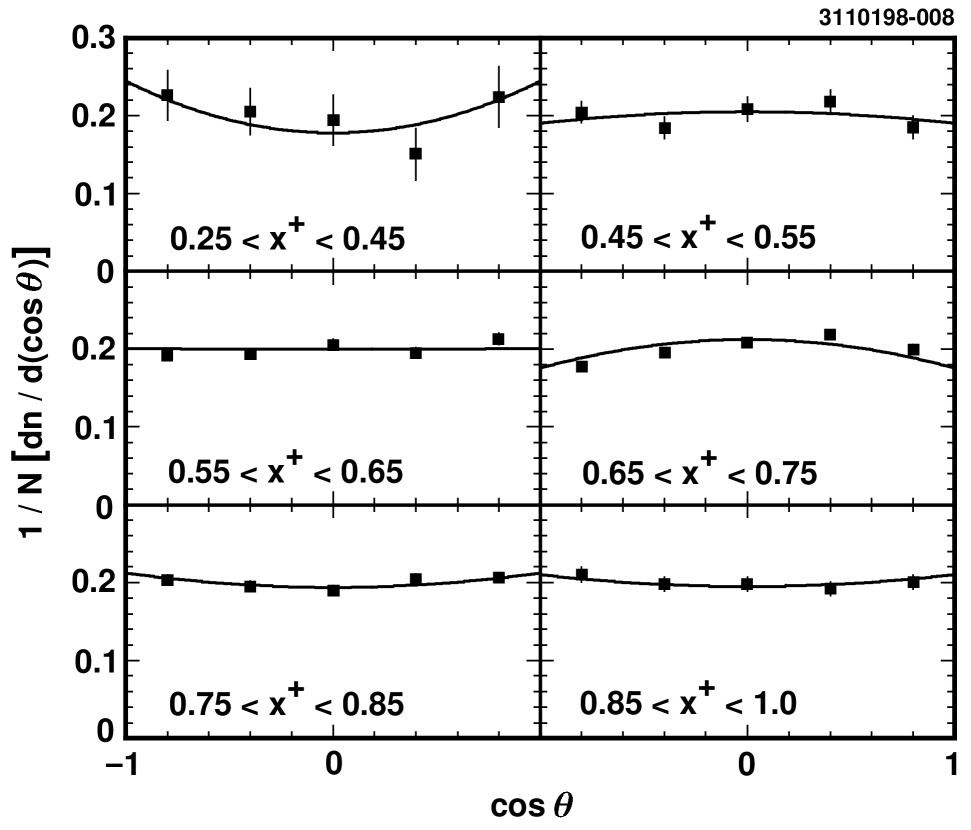
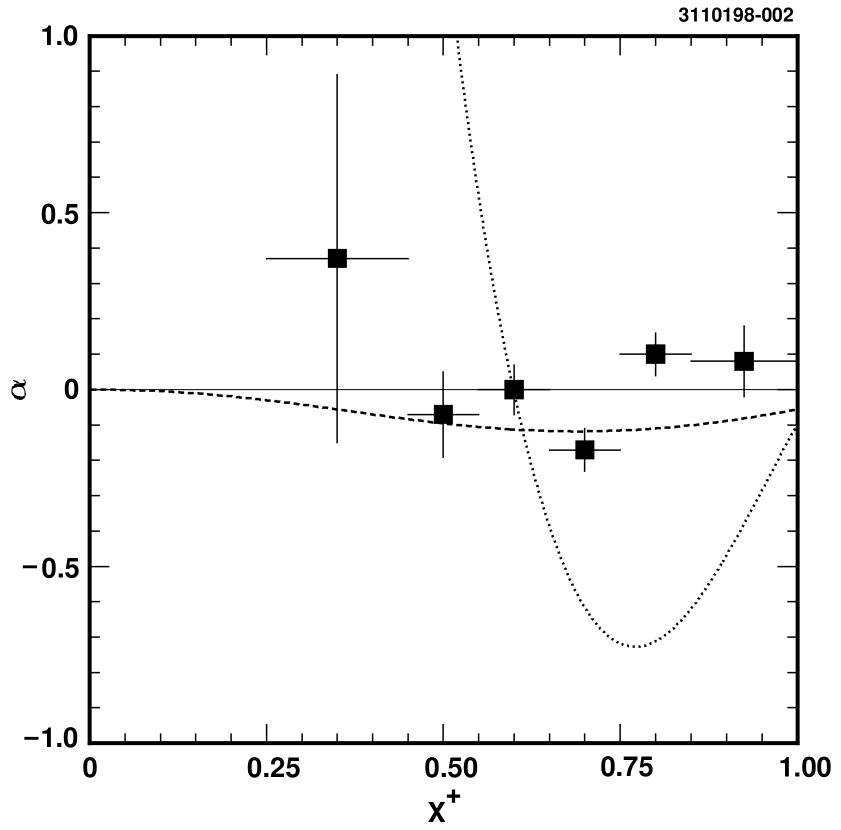
The values of resulting from these fits as well as the fits for each of the two decay modes treated separately are listed in Table I. Figure 6 shows the combined results for plotted as a function of momentum as well as the theoretical curves suggested by Suzuki [23] and Cheung and Yuan [24]. Table II lists the values of as calculated from the measurement of for each scaled momentum bin. Averaging the distributions over all momenta and then fitting gives a value , corresponding to .
| Combined | Confidence | ||||||||||||
|---|---|---|---|---|---|---|---|---|---|---|---|---|---|
| Events | Events | Level(%) | |||||||||||
| 0.25– | 0.45 | 687 | 62 | 0.37 | 0.35 | 0.37 | 0.35 | 0.38 | 90 | ||||
| 0.45– | 0.55 | 1472 | 58 | -0.14 | 0.13 | 1830 | 171 | 0.09 | 0.24 | -0.07 | 0.11 | 0.05 | 43 |
| 0.55– | 0.65 | 7640 | 125 | 0.14 | 0.08 | 8305 | 290 | -0.18 | 0.08 | 0.00 | 0.05 | 0.05 | 11 |
| 0.65– | 0.75 | 8432 | 116 | -0.13 | 0.06 | 8355 | 165 | -0.22 | 0.06 | -0.17 | 0.04 | 0.04 | 1 |
| 0.75– | 0.85 | 6264 | 97 | 0.14 | 0.08 | 6339 | 118 | 0.05 | 0.08 | 0.10 | 0.05 | 0.02 | 73 |
| 0.85– | 1.0 | 3828 | 83 | 0.17 | 0.12 | 3740 | 91 | -0.02 | 0.11 | 0.08 | 0.08 | 0.07 | 90 |
| 0.25– | 0.25 | 0.40 | 0.07 | 0.07 |
| 0.45– | 0.55 | 0.31 | 0.03 | 0.01 |
| 0.55– | 0.65 | 0.33 | 0.01 | 0.01 |
| 0.65– | 0.75 | 0.30 | 0.01 | 0.01 |
| 0.75– | 0.85 | 0.35 | 0.01 | 0.01 |
| 0.85– | 1.0 | 0.35 | 0.02 | 0.01 |
Similar analyses have been done by the HRS, TPC, SLD and OPAL collaborations [16, 17, 21, 20], as well as by CLEO using a previous data set[18]. The average values of and in each study are presented in Table III.
| Collaboration | (GeV) | ||
|---|---|---|---|
| HRS | 29 | 0.18 0.08 | 0.371 0.016 |
| TPC | 29 | -0.14 0.17 0.03 | 0.301 0.042 0.007 |
| SLD | 91 | 0.019 0.378 0.582 | 0.34 0.08 0.13 |
| OPAL | 91 | 0.33 0.11 | 0.40 0.02 |
| CLEO I.5 | 10.5 | 0.08 0.07 0.04 | 0.351 0.015 0.008 |
| CLEO II | 10.5 | -0.028 0.026 | 0.327 0.006 |
VII Systematic Error
Many possible sources of absolute systematic uncertainty, such as the overall track-finding efficiency, do not have a significant effect on this analysis because the extraction of in each momentum range involves only the relative comparisons of the same measured quantity, namely the yield of the decays, in the different bins of . The remaining sources of uncertainty will therefore be related to extracting the yield and the efficiency as a function of . The effects of the various sources of systematic error are shown in Figure 7 while the methods used to determine these errors are described below.
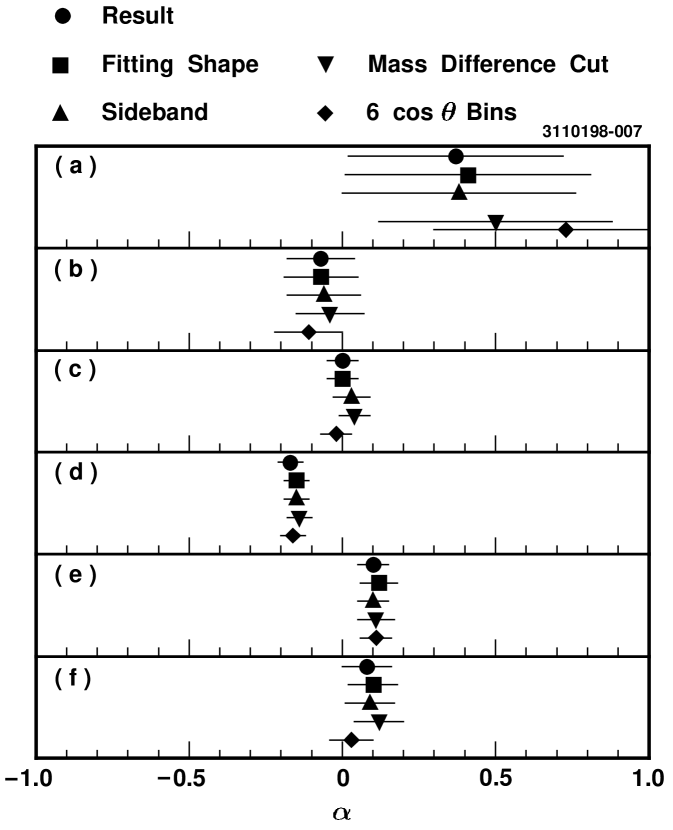
The Monte Carlo contribution to the systematic error was accounted for by including the error in the Monte Carlo efficiencies in the calculations of the yields. To investigate the systematic error associated with the fitting function, the analysis was done using a single Gaussian rather than a double Gaussian to fit the signal peaks. Likewise, to investigate the systematic error associated with the choice of range for the sideband subtraction, the analysis was done using a sideband region from 6 MeV/ to 9 MeV/ above the nominal mass difference rather than 9 MeV/ to 12 MeV/ above the nominal value. The effect of the mass difference requirement was investigated by constraining the mass difference to be within 1.25 MeV/ of the PDG value rather than 2.5 MeV/. The systematic effects of the binning were studied by using six equal bins rather than five. The differences between the resulting values of and the central value were all summed in quadrature as an estimate of the systematic error and are included in the error bars shown in Figure 6.
A small linear component in the angular distribution can easily be seen in Figure 5 for the range . This is most likely due to a slight inaccuracy in the efficiency correction from the Monte Carlo data. The data in Figure 5 were fit with a straight line added to Eq. (4) as a check and the difference in the fitted values of was negligible.
VIII Interpretation of Results
We have measured the spin alignment of all mesons produced in interactions at GeV. Although the details of the analysis ensure that the measured does not come from a decaying meson, we cannot determine any other details about the production hierarchy. From a theoretical standpoint, we are particularly interested in the mesons that are produced directly in the collision, but we cannot distinguish these from secondary ’s resulting from decays of charm mesons with . [29, 30, 31].
The most prominent excited charm mesons, which are commonly referred to as mesons, consist of a charm quark and a light anti-quark with relative orbital angular momentum . They are categorized into four states with spin-parity = , , , and . A state decay to is forbidden due to spin-parity conservation while other modes are expected to be suppressed. When a state decays through a channel, it can only produce a meson with a helicity of in the rest frame, while the states only decay through channels and favor a helicity of 0 in the rest frame. From the measurements available [32, 33], we estimate that 16-20% of mesons observed at CLEO could be daughters of a meson, not including the contribution from mesons.
Although the favored helicities of ’s from the decays of and charm states partially cancel, it is probable that these ’s are aligned in their production rest frame, i.e. the rest frame of the parent . It is expected that any effect would be most noticeable for the highest bins which has the largest correlation between the 4-momentum in the lab frame and the 4-momentum in the rest frame. If the 4-momenta in the two reference frames are uncorrelated, as tends to be the case for the lower bins, any alignment of ’s from ’s would not be noticeable in the lab frame.
Due to the current lack of information about the production and decay of -wave charm meson states, we can only state that decays could have a significant effect on this spin alignment measurement in at least some of the bins.
IX Conclusion
This analysis is the most precise measurement of the spin alignment of mesons to date. The data, without any corrections for effects on the measurements, agree well with the statistical model expectation that the state has a probability of being populated.
X Acknowledgments
We gratefully acknowledge the effort of the CESR staff in providing us with excellent luminosity and running conditions. J.P.A., J.R.P., and I.P.J.S. thank the NYI program of the NSF, M.S. thanks the PFF program of the NSF, K.K.G., M.S., H.N.N., T.S., and H.Y. thank the OJI program of DOE, J.R.P., K.H., M.S. and V.S. thank the A.P. Sloan Foundation, M.S. thanks Research Corporation, and S.D. thanks the Swiss National Science Foundation for support. This work was supported by the National Science Foundation, the U.S. Department of Energy, and the Natural Sciences and Engineering Research Council of Canada.
REFERENCES
- [1] C. Peterson et al., Phys. Rev. D 27, 105 (1983).
- [2] M. Suzuki, Phys. Lett. B 71, 139 (1977).
- [3] A.F. Falk and M.E. Peskin, Phys. Rev. D 49, 3320 (1994).
- [4] M. Cacciara and M. Greco, Phys. Rev. D 55, 7134 (1997).
- [5] J. D. Bjorken, Phys. Rev. D 17, 171 (1978).
- [6] X. Artru and G. Mennessier, Nucl. Phys. B 70, 93 (1974).
- [7] M.G. Bowler, Z. Phys. C 11, 169 (1981).
- [8] CLEO Collaboration, D. Bortoletto et al., Phys. Rev. D 37, 1719 (1988).
- [9] ARGUS Collaboration, H. Albrecht et al., Z. Phys. C 52, 353 (1991).
- [10] OPAL Collaboration, R. Akers et al., Z. Phys. C 67, 27 (1995).
- [11] DELCO Collaboration, H. Yamamoto et al., Phys. Rev. Lett. 54, 522 (1985).
- [12] HRS Collaboration, M. Derrick et al., Phys. Lett. B 146, 261 (1984).
- [13] TPC Collaboration, H. Iahara et al., Phys. Rev. D 34, 1945 (1986).
- [14] TASSO Collaboration, M. Althoff et al., Phys. Lett. B 126, 493 (1983).
- [15] JADE Collaboration, W. Bartel et al., Phys. Lett. B 161, 197 (1985).
- [16] HRS Collaboration, S. Abachi et al., Phys. Lett. B 199, 585 (1987).
- [17] TPC Collaboration, S. Aihara et al., Phys. Rev. D 43, 29 (1991).
- [18] CLEO Collaboration, Y. Kubota et al., Phys. Rev. D 44, 593 (1991).
- [19] ALEPH Collaboration, D. Decamp et al., Phys Lett. B 266, 218 (1991).
- [20] OPAL Collaboration, K. Ackerstaff et al., Z. Phys. C 74, 437 (1997).
- [21] SLD Collaboration, K. Abe et al., SLAC-PUB 7574, contributed to International Europhysics Conference on High-Energy Physics (HEP97), Jerusalem, Israel, 19-26 Aug. 1997.
- [22] ALEPH Collaboration, D. Buskulic et al., Z. Phys C 62, 1 (1994).
- [23] M. Suzuki, Phys. Rev. D 33, 676 (1986).
- [24] K. Cheung and T.C. Yuan, Phys. Rev. D 50, 3181 (1994).
- [25] K.Cheung, hep-ph/9505365, contributed to the 1995 PASCOS/Hopkins Workshop, Johns Hopkins University, Baltimore, Maryland, 22-25 March 1995.
- [26] J. F. Donoghue, Phys. Rev. D 19, 2806 (1979).
- [27] CLEO Collaboration, Y. Kubota et al., Nucl. Instrum. Methods Phys. Res., Sec. A 320, 66 (1992).
- [28] Particle Data Group, R.M. Barnett et al., Phys. Rev. D 54, (1996).
- [29] ARGUS Collaboration, H. Albrecht et al., Phys. Rev. Lett. 56, 549 (1986).
- [30] CLEO Collaboration, P. Avery et al., Phys. Rev. D 41, 744 (1990).
- [31] OPAL Collaboration, K. Ackerstaff et al., CERN-PPE 97-035 1997 (Submitted to Z. Phys. C).
- [32] CLEO Collaboration, P. Avery et al., Phys. Lett. B 331, 194 (1994).
- [33] CLEO Collaboration, T. Bergfeld et al., Phys. Lett. B 340, 236 (1994).