GLAS-PPE/97–1319 December 1997
Measurements of diffractive phenomena observed at HERA and the Tevatron are reviewed. A short introduction to the theoretical background is presented where colour singlet exchange reactions are discussed and the diffractive contribution and its interpretation via pomeron exchange outlined. The review focuses on the current experimental directions at HERA and discusses exclusive production of vector mesons, the dissociation of real photons and the deep inelastic structure of diffraction. Complementary information obtained from hadronic final states and jet structures is also discussed. The experimental signatures for diffractive jet and production observed at the Tevatron are described and the rates compared with those from the HERA experiments.
Talk presented at the 25th SLAC Summer Institute,
SLAC, August 1997.
1 Introduction
Prologue: In 1992, H. Fritzsch summarised the status of “QCD 20 Years On” [1] with the words “A very large amount of data in strong-interaction physics is described by the pomeron singularity… The fact that the physics of the pomeron is very simple needs to be explained in equally simple terms in QCD… Using HERA the experimentalists will be able to study the region of very low in deep inelastic scattering… Furthermore, both in -scattering at high energies and at HERA the structure functions of the pomeron can be studied in more detail.” Now, 25 years on from the first developments of QCD, at the 25th SLAC Summer Institute we can discuss a series of diffractive measurements that have been made in the intervening period at HERA and the Tevatron.
HERA Kinematics: The diffractive processes studied at HERA are of the form:
where the photon dissociates into the system and the outgoing proton, , remains intact, corresponding to single dissociation, as illustrated in Fig. 1. The measurements are made as a function of the photon virtuality, the centre-of-mass energy of the virtual-photon proton system, , the invariant mass of the dissociated system, , denoted by and the four-momentum transfer at the proton vertex, given by .

Signatures of diffraction: The processes studied build upon the basic elastic scattering process
which is constrained through the measurement of the corresponding total cross-section anything, via the optical theorem. The diffractive processes measured are then
where the systems and have a limited mass compared to the overall energy available, . The process is thought of as being mediated by the exchange of an object with vacuum quantum numbers (in particular, no colour is exchanged in the process). A signature for diffraction is via the momentum fraction carried by the exchanged colour singlet state. When this fraction is less than 1% of the momentum of, say, particle (in the infinite momentum frame of ) we can interpret this as being largely due to pomeron exchange. The kinematics of producing two low-mass outgoing states ( and or and ) with a small momentum fraction exchanged between them therefore leads to a rapidity gap. The high energy available at HERA provides a large rapidity span, , of 12 units (here, where and for a typical GeV). A colour singlet exchange of reggeons (dominating at lower ) and the pomeron (dominating at higher ) can be used to interpret the data on single dissociation and double dissociation reactions. Fluctuations from processes where colour is exchanged may also generate low-mass states. However, these will be exponentially suppressed: the (Poisson) probability of producing a given particle in the rapidity gap when the two systems are colour connected is , where is the mean particle density for a given interval. This exponential fall-off reflects the plateau in the corresponding (non-diffractive) multiplicity distribution as a function of which increases relatively slowly (logarithmically) with increasing [2].
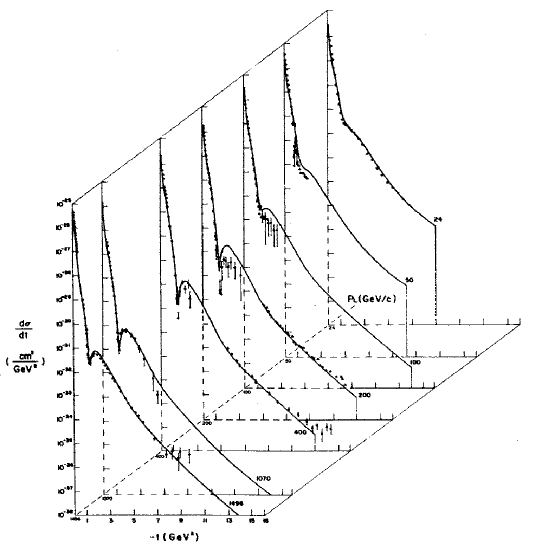
In Fig. 2, the distributions of elastic scattering data are illustrated as a function of the longitudinal momentum () of the outgoing proton transformed to a fixed-target rest frame. The patterns are similar to the diffraction patterns observed when light is scattered from an aperture and exhibit an exponential fall-off for values of below 1 GeV2. This characteristic fall-off increases with increasing energy, a property known as shrinkage, and differs for different incident and outgoing systems. In order to characterise the -dependence, a fit to the diffractive peak is performed. In the most straightforward approach, a single exponential fit to the distribution, for GeV2 is adopted. Physically, the slope of the dependence in diffractive interactions tells us about the effective radius of that interaction, : if d, then .
Regge trajectories: The subject of diffraction is far from new: diffractive processes have been measured and studied for more than thirty years [3]. Their relationship to the corresponding total cross-sections at high energies has been successfully interpreted via the optical theorem and Regge theory. At lower energies the colour singlet exchange of virtual mesons, called reggeons, contribute to the fall of the cross-section with increasing energy. At higher energies, the introduction of an additional trajectory, known as the pomeron trajectory, with a characteristic and dependence is necessary [4]. The energy behaviour of the total cross-sections can then be described by the sum of two power-law dependences on the centre-of-mass energy,
| (1) |
where is measured in GeV, and is defined to be positive such that . Here, and are the pomeron and reggeon intercepts (i.e. the values of the parameters at = 0 GeV2), respectively. A wide range of total cross-section data are used to determine the parameters and . The fall-off at low energy due to reggeon exchange constrains the value of . The slow rise of hadron-hadron total cross-sections with increasing energy indicates that the value of i.e. the total cross-sections increase as , although the data from CDF at two values indicate [5]. Recent fits using all and data are consistent with a value of which will be used here to characterise this behaviour [6].

In a Regge analysis, the diffractive data are interpreted via exchanges with spin and , with . At lower energies, these correspond to reggeon (i.e. approximately degenerate , , and ) exchanges. At the highest energies, where the pomeron contribution dominates, the optical theorem relates the total cross-sections to the elastic, and hence diffractive, scattering amplitude at the same . In Fig. 3, the trajectories, , are shown as a function of . The diffractive data probe the region of negative . Given the dominance of the pomeron contribution at large and an approximately exponential behaviour of the distribution with slope , whose mean value is given by at the mean of a given data sample, the diffractive cross-section rise is moderated from to
| (2) |
where and GeV-2 reflects the shrinkage of the diffractive peak as a function of with increasing . The observed shrinkage of the diffractive peak therefore corresponds to a relative reduction of the diffractive cross-section with increasing energy. This value may be compared with the corresponding parameter GeV-2 for reggeon exchanges.
Maps of the Pomeron: Whilst these Regge-based models gave a unified description of pre-HERA diffractive data, this approach is not fundamentally linked to the underlying theory of QCD. It was anticipated that at HERA and Tevatron energies if any of the scales , or become larger than the QCD scale , then it may be possible to apply perturbative QCD (pQCD) techniques, which predict changes to this power law behaviour. Qualitatively, the dependence could be ascribed to the rise of the gluon density with decreasing determined from the large scaling violations of , where is the Bjorken scaling variable, . QCD factorisation into a long-timescale and short-timescale process, where this timescale is characterised by or or , leads to the following approaches.
-
For exclusive final states, e.g. vector meson production, with a hard scale the approach is very simple
i.e. two-gluon exchange where is the square of the gluon density of the proton at a representative value of and represents the hard scattering process. The rise of with decreasing , which constrains the gluon density, corresponds to an increase in the effective value of . This brings us from the regime of dominance of the slowly-rising “soft” pomeron to the newly emergent “hard” behaviour and the question of how a transition may occur between the two. The QCD expectation is that the cross-sections should approximately scale as a function of , corresponding to a weak dependence of as a function of and therefore a decrease of for the perturbative pomeron.
-
For inclusive diffraction with a hard scale
i.e. leading-gluon exchange where is the gluon density of the proton, represents the hard scattering process and represents the hadronisation process. Here, the final state with a leading proton is seen as a particular hadronisation process [8]. For processes involving one incoming hadron, the above approaches can be tested and compared with experimental data.
-
Finally, one can break the process down further and invoke Regge factorisation where a flux of pomerons, lead to partons from the pomeron, , which interact and hadronise
For processes involving two incoming hadrons, this approach has been generalised to
where represents the partons from the hadron which has not diffractively dissociated. This Regge factorisation approach can therefore be experimentally tested when diffractive data from HERA and the Tevatron are compared.
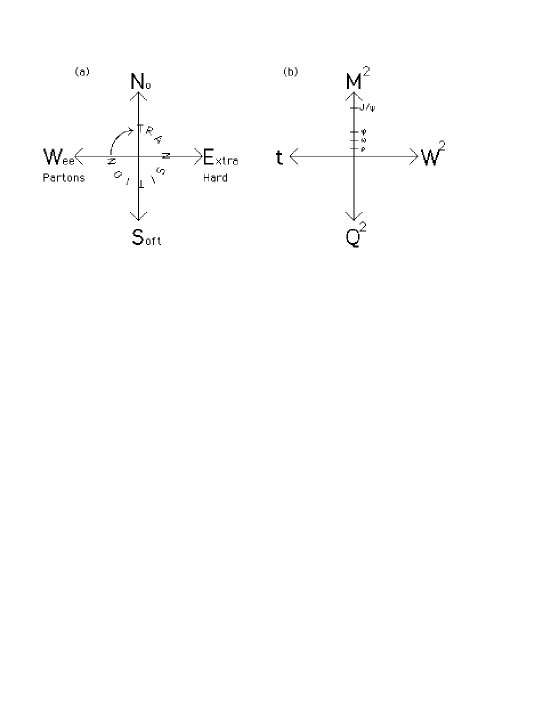
Precisely where the Regge-based approach breaks down or where pQCD may be applicable is open to experimental question. In addition, once we observe “hard” diffractive phenomena, we can ask whether the pQCD techniques applied to inclusive processes also apply to these exclusive colour singlet exchange reactions. The emphasis is therefore on the internal (in)consistency of a wide range of measurements of diffractive and total cross-sections. As an experimentalist navigating around the various theoretical concepts of the pomeron, it is sometimes difficult to see which direction to take and what transitions occur where (Fig. 4(a)). However, from an experimental perspective, the directions are clear, even if the map is not yet complete (Fig. 4(b)).
Outline: The HERA collider allows us to observe a broad range of diffractive phenomena at high . What is new is that we have the ability to observe the variation of these cross-sections at specific points on the scale, from the up to the system as discussed in section 2. Similarly, the production cross-section can be explored as a function of , using a virtual photon probe. The observation of a significant fraction of events () with a large rapidity gap between the outgoing proton and the rest of the final state in deep inelastic scattering (DIS) has led to measurements of the internal structure of the pomeron. In addition, the leading proton spectrometer data, where the diffracted proton is directly measured, enable the distribution as well as the structure function to be determined simultaneously. These results are discussed in section 3. Studies of the hadronic final state in events with a large rapidity gap, including transverse energy flows, event shape distributions and high- jets, have been used to provide complementary information on this structure. Also, the observation of rapidity gaps between jets, corresponding to large- diffraction, are presented in section 4. Many of these hadronic final state investigations were initiated at colliders. In section 5, the latest results from the Tevatron on diffractive dijet and production, rapidity gaps between jets and first observations of hard double-pomeron exchange are presented. A comparison of hard diffractive event rates at HERA and the Tevatron is given and the interpretation of the observed differences is discussed.
2 Exclusive Production of Vector Mesons
The experimental signals are the exclusive production of the vector mesons in the following decay modes
First results on and higher vector mesons (, and ) have also been presented. A recent review of the HERA data can be found in Ref [9].
The relevant components of the H1 and ZEUS detectors are the inner tracking chambers which measure the momentum of the decay products; the calorimeters which allow identification of the scattered electron and are used in the triggering of photoproduced vector mesons; and the outer muon chambers used to identify muonic decays of the and . The clean topology of these events results in typical uncertainties on the measured quantities (, , and ), reconstructed in the tracking chambers, of order 5%. Containment within the tracking chambers corresponds to a interval in the range GeV.
Photoproduction processes have been extensively studied in fixed-target experiments, providing a large range in over which to study the cross-sections. The key features are the weak dependence of the cross-section on , an exponential dependence on with a slope which shrinks with increasing and the retention of the helicity of the photon by the vector meson.
In Fig. 5, the ZEUS results for exclusive production as a function of are shown. An exponential fit to the ZEUS data in three intervals yields -slopes which are fitted to the form
expected from Regge theory. The fitted value of GeV-2 is consistent with a shrinkage of the slope with increasing expected from soft diffractive processes.

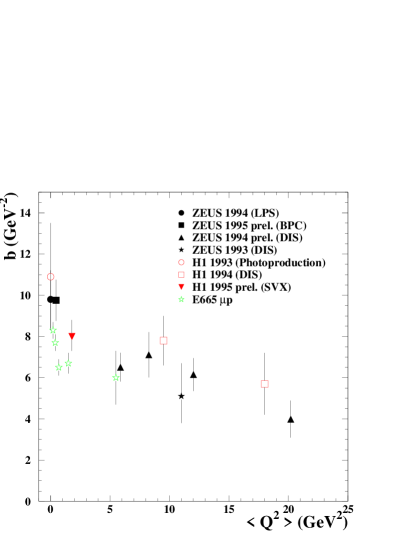
The interaction radius, , can be approximately related to the radii of the interacting proton and vector meson, . The variation of these values is shown in Fig. 6(a) as a function of vector meson mass . In Fig. 6(b), these slopes are presented as a function of increasing virtuality of the photon for production data. In each case, the range of measured -slopes varies from around 10 GeV-2 ( fm) at low or to 4 GeV-2 ( fm) at the highest or so far measured. Given fm, this variation in -slopes corresponds to a significant decrease in the effective radius of the interacting vector meson from fm to fm as (at fixed GeV2) or (at fixed ) increase.

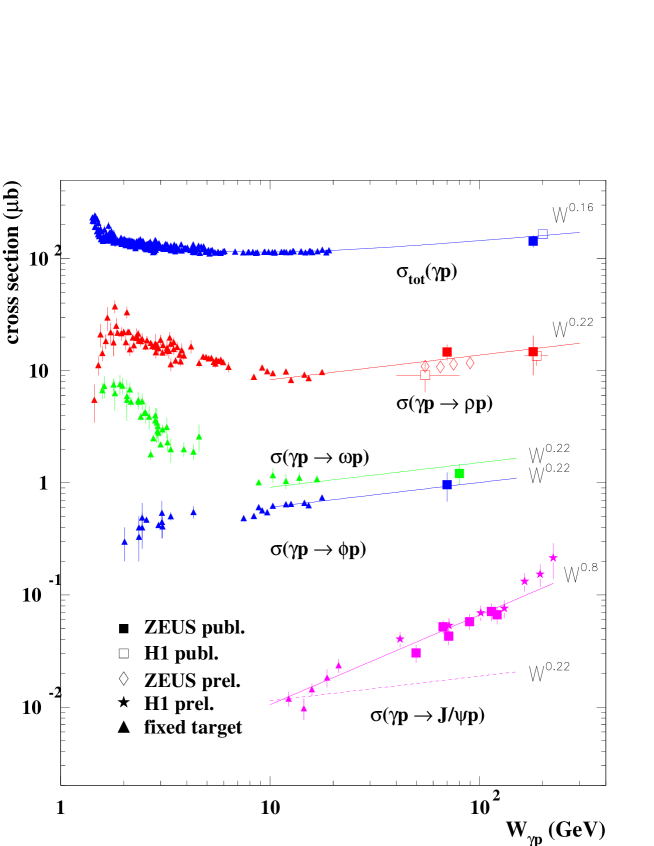
Integrating over the measured dependence, the dependence of the results on exclusive vector meson photoproduction cross-sections are shown in Fig. 7. There is generally good agreement between the experiments on the measured cross-sections. The total cross-section is also shown in Fig. 7, rising with increasing energy as in hadron-hadron collisions and consistent with a value of i.e. the total cross-section increases as .
Given the dominance of the pomeron trajectory at high and a distribution whose mean value is given by , the diffractive cross-section rise is moderated from to
Here characterises the effective energy dependence after integration over for GeV-2 (which is appropriate for exchange as observed in Fig. 5). The observed shrinkage of the diffractive peak therefore corresponds to a relative reduction of the diffractive cross-section with increasing energy. Such a dependence describes the general increase of the , and vector meson cross-sections with increasing . However, the rise of the cross-section is clearly not described by such a dependence, the increase being described by an effective dependence. Whilst these effective powers are for illustrative purposes only, it is clear that in exclusive production a new phenomenon is occurring. For example, fits to the ZEUS data yield results for which are inconsistent with soft pomeron exchange
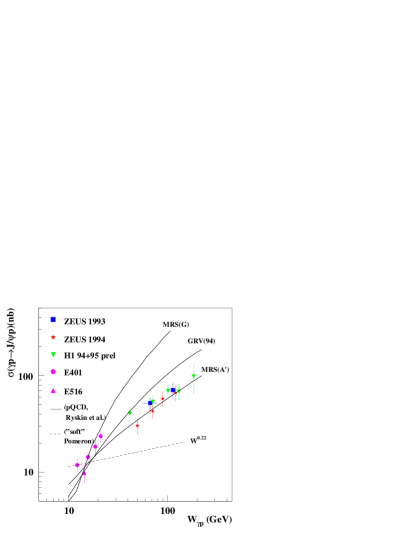
The (charm) mass scale, , is larger than the QCD scale, , and it is therefore possible to apply pQCD techniques. The theoretical analysis predicts that the rise of the cross-section is proportional to the square of the gluon density at small- (a pair of gluons with no net colour is viewed as the perturbative pomeron)
where GeV2 for the photoproduction data) is chosen as the scale in the Ryskin model [11]. This approach enables discrimination among recent parametrisations of the proton structure function as shown in Fig. 8(a). Here, the measured cross-sections are compared to the Ryskin model for various choices of parton densities which describe recent data. The approach is therefore very promising as an independent method to determine the gluon distribution at low- from the HERA data. Currently, however, there are model uncertainties and the calculations are only possible in leading order. The normalisation is therefore uncertain by up to a factor of two.
We also know from measurements of the DIS total cross-section that application of formula (1) results in a value of which increases with increasing , with 0.2 to 0.25 at GeV2 [12]. The fact that the corresponding relative rise of with decreasing can be described by pQCD evolution [13] points towards a predicted function for . The current data indicate that this transition occurs for GeV2 [14].
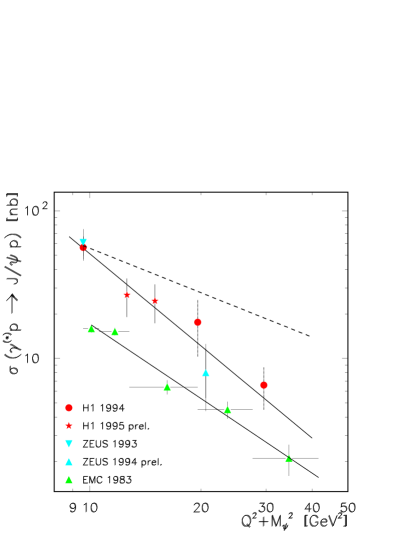
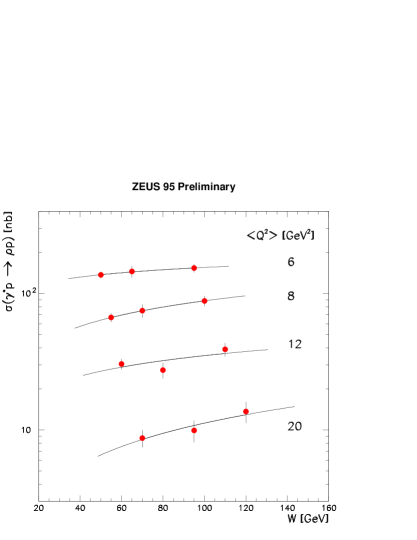
electroproduction results are also available; the dependence of the data is shown in Fig. 8(b). The cross-sections are fitted to where the fitted line corresponds to for the combined H1 and ZEUS data. This compares to the prediction of the Vector Dominance Model (VDM), applicable to soft photoproduction processes, where = 1 (shown as the dashed line) and the Ryskin model where . Also shown are the lower- EMC data where . The electroproduction cross-section is of the same order as the data. This is in marked contrast to the significantly lower photoproduction cross-section for the , even at HERA energies, also shown in Fig. 7. Further results in this area will allow tests of the underlying dynamics for both transverse and longitudinally polarised photons coupling to light and heavy quarks in the pQCD calculations.

One contribution to the DIS total cross-section is the electroproduction of low mass vector mesons, here typified by the data. The decay angle distributions of the pions in the rest frame with respect to the virtual photon proton axis from the E665 fixed-target experiment ( GeV) are shown in Fig. 9 [15]. The measurements of this helicity angle of the vector meson decay determines for the (virtual) photon, assuming -channel helicity conservation, i.e. that the vector meson preserves the helicity of the photon.
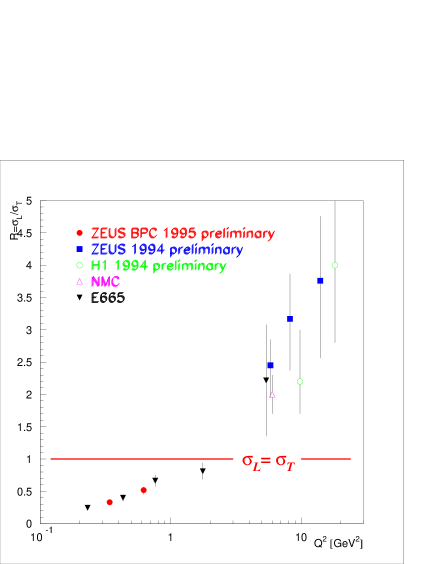
The decay angular distribution can be written as where the density matrix element represents the probability that the was produced longitudinally polarised by either transversely or longitudinally polarised virtual photons. The value of is then obtained from , where is the fractional energy loss of the electron in the proton rest frame and . The kinematic factor is typically close to unity. This variation of with is summarised in Fig. 10. The photoproduction measurements for the (not shown) are consistent with the interaction of dominantly transversely polarised photons and hence . The electroproduction data are consistent with a universal dependence on independent of and show a transition from predominantly transverse to predominantly longitudinal photons with increasing . This increase of is due to an increased flux of longitudinal photons, . At higher values, the cross-section due to longitudinal exchange is determined in leading-log pQCD [16] where the underlying interaction of the virtual photon with the constituent quarks of the is calculated. As noted previously (see Fig. 6(b)), the measured -slope decreases by about a factor of two from the photoproduction case to values comparable to that in the photoproduced case. The basic interaction is probing smaller distances, which allowed a first comparison of the observed cross-section with the predictions of pQCD [17].
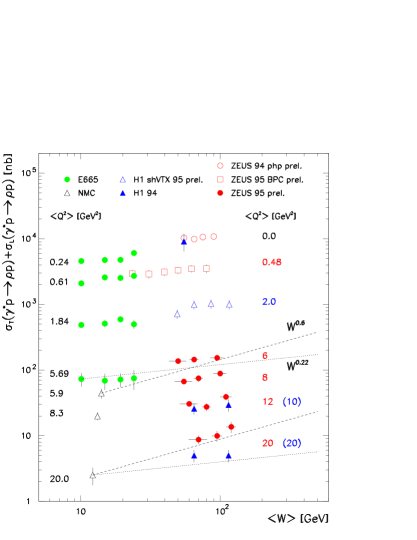
The dependence of the (virtual-)photon proton cross-sections for finite values of are shown in Fig. 11(a), compared to the corresponding photoproduction cross-sections (the data, not shown, exhibit similar trends). There is a significant discrepancy between the ZEUS and H1 measured cross-sections at GeV2 as well as a smaller discrepancy between the E665 and NMC measurements at GeV2. This is illustrated by comparison with the (dashed) and dotted lines for GeV2 and GeV2. At each value, a simple dependence cannot account for all the data.
One of the key problems in obtaining accurate measurements of these exclusive cross-sections and the slopes is the uncertainty of the double dissociation component, where the proton has also dissociated into a low mass nucleon system [18]. At HERA, the forward calorimeters will see the dissociation products of the proton if the invariant mass of the nucleon system, , is above approximately 4 GeV. A significant fraction of double dissociation events produce a limited mass system which is typically not detected. One expects that the dissociated mass spectrum will fall as and integrating over the -dependence CDF obtains = 0.100 0.015 at GeV [19]. Precisely how the proton dissociates and to what extent the proton can be regarded as dissociating independently of the photon system is not known. Currently, this uncertainty is reflected in the cross-sections by allowing the value of to vary from around 0.0 to 0.5, a choice which covers possible variations of as a function of and . Combining all uncertainties, the overall systematic errors on the various cross-sections are typically for both the photoproduction and electroproduction measurements. The estimation of the double dissociation contribution has, however, historically been one of the most significant experimental problems with these measurements. Whether this is the source of the H1 and ZEUS discrepancy is not yet known.
The combined dependence of the electroproduction data are, therefore, currently inconclusive. However, taking the ZEUS data alone, shown in Fig. 11(b) there are indications of a transition from the soft to the hard intercept with varying from to as indicated by the fitted lines in Fig. 11. These data are therefore consistent with a ( = 0.05) dependence at the lowest values and the ( = 0.2) dependence at the highest values.
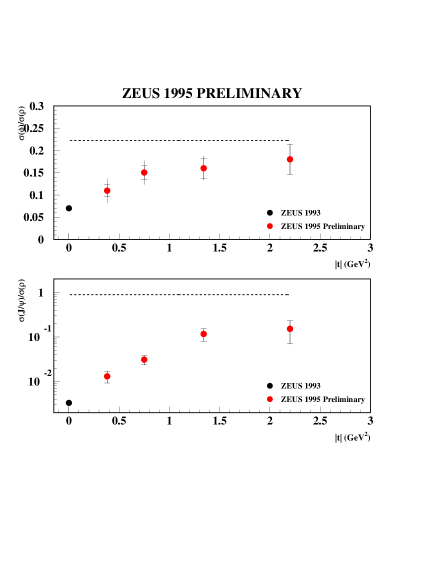
An important point to emphasise here is that the relative production of to mesons approaches the quark model prediction of 2/9 at large as a function of . Similar observations have been made on the dependence of this ratio for photoproduction data, as shown in the upper plot of Fig. 12. Here, the ratio of the cross-sections approaches the SU(4) flavour prediction of . The restoration of this symmetry indicates that the photon is interacting via quarks, rather than as a vector meson with its own internal structure. This therefore indicates the relevance of a gluonic interpretation of the pomeron and the applicability of pQCD to these cross-sections. Similarly, the relative production of to mesons is shown with the asymptotic prediction of 8/9 from the quark model in the lower plot of Fig. 12. In this case, it is evident that threshold effects for the heavy charm quark are still significant in the measured range, however the ratio climbs by almost two orders of magnitude from to GeV2.
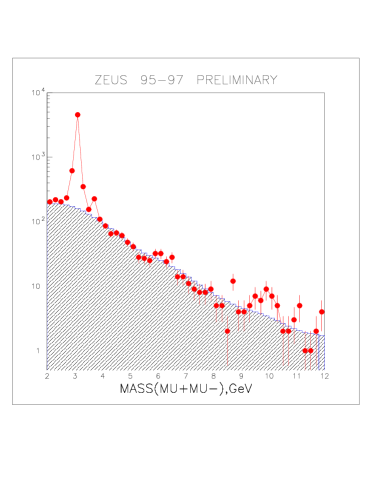
Exclusive photoproduction has also been observed [20]. The 20 events observed in the channel corresponds to a cross-section for predominantly (1S) production, as well as higher states, of nb for where 4 GeV and GeV, GeV2. This is about 1% of the cross-section, as shown in Fig. 13, emphasing the importance of the mass of the heavy quark in the production of exclusive vector mesons.
In conclusion, there is an accumulating body of exclusive vector meson production data, measured with a systematic precision of , which exhibit two classes of behaviour: a slow rise consistent with that of previously measured diffractive data for low photoproduction data but a significant rise of these cross-sections above a finite value of , or . In general, the cross-sections at large can be compared to pQCD when either , or become larger than the scale . Precisely how the transition from the non-perturbative to the perturbative regime is made is currently being determined experimentally.
3 Photon Dissociation
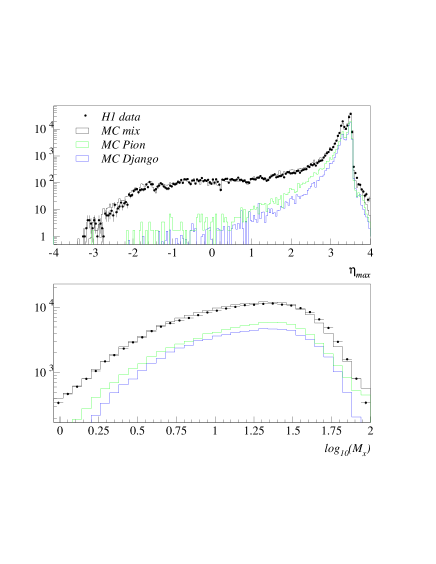
Diffractive Event Selection: The study of the vector meson resonances enables specific points on the scale to be investigated. The inclusive dissociation into any low-mass state, , from the (virtual) photon provides additional information: one of the major advances in the subject of diffraction has been the observation of large rapidity gap events in DIS and their subsequent analysis in terms of a diffractive structure function [21, 22]. In addition, the relationship between these DIS measurements and those in the photoproduction regime provide insight into the transition of the diffractive structure function in the limit. In these analyses, the typical signature of diffraction is a rapidity gap, defined by measuring the maximum pseudorapidity of the most-forward going particle with energy above 400 MeV, , and requiring this to be well away from the outgoing proton direction. A typical requirement of corresponds to a low mass state measured in the detectors of units and a large gap of units with respect to the outgoing proton (nucleon system). In order to increase the lever arm in , the H1 analysis has extended the cuts to 3.2. This is achieved by combining the calorimetry information with the forward muon system and proton remnant taggers. These extensions enable a cross-section beyond that due to simple diffractive processes to be determined at the expense of a significant non-diffractive contribution (up to ). As illustrated in Fig. 14, the Monte Carlo description of the distributions shows a clear excess over the non-diffractive models (labelled MC Django) and a Monte Carlo to describe higher reggeon exchanges (labelled MC Pion). The data is well-described by a mixture (labelled MC mix) including an additional contribution due to the pomeron exchange, both in the distribution and the corresponding observed distribution.

One of the major uncertainties comes from the estimation of the various contributions to the cross-section which depends on Monte Carlo techniques. This problem has been addressed in a different way in the ZEUS analysis [23]. Here, the mass spectrum, , is measured as a function of and , as shown in Fig. 15 for a representative interval, where the measured mass is reconstructed in the calorimeter and corrected for energy loss but not for detector acceptance, resulting in the turnover at large . The diffractive data are observed as a low mass shoulder at low . which becomes increasingly apparent at higher . Also shown in the figure are the estimates of the non-diffractive contribution based on a direct fit to the data, discussed below.
The probability of producing a gap is exponentially suppressed as a function of the rapidity gap, and hence as a function of ), for non-diffractive interactions. The slope of this exponential is directly related to the height of the plateau distribution of multiplicity in the region of rapidity where the subtraction is made. The data can thus be fitted to functions of the form , in the region where the detector acceptance is uniform, where , and are determined from the fits. Here, represents a first-order estimate of the diffractive contribution which is approximately flat in ). The parameter which determines the background is . In general the measured value of is incompatible with that of the ARIADNE Monte Carlo. This result in itself is interesting, since the fact that ARIADNE approximately reproduces the observed forward ( multiplicity) flow but does not reproduce the measured value of suggests that significantly different correlations of the multiplicities are present in non-diffractive DIS compared to the Monte Carlo expectations. This method enables a diffractive cross-section to be determined directly from the data at the expense of being limited in the range of large masses that can analysed.
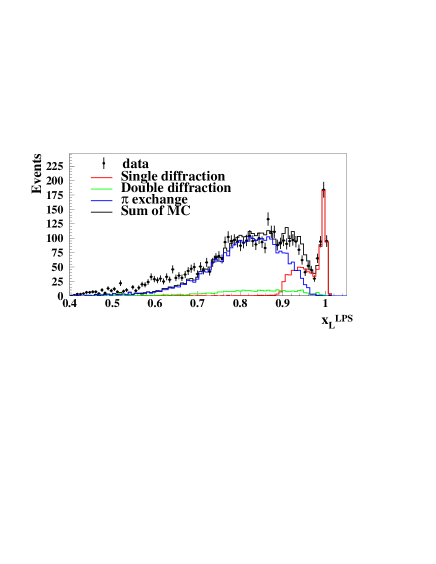
Finally, the advent of the leading proton spectrometers (LPS) at HERA is especially important in these diffractive measurements, since internal cross-checks of the measurements as a function of , , and can be performed and underlying assumptions can be studied experimentally. Only in these measurements can we positively identify the diffracted proton and hence substantially reduce uncertainties on the non-diffractive and double dissociation backgrounds. This is illustrated in Fig. 16, where the (where ) distribution includes a clear diffractive peak for . It should be noted, however, that the contribution from other Reggeon exchanges cannot be neglected until (in fact the result at lower can be simply interpreted via reggeon (approximated by pion) exchange, as discussed below.) However, new experimental uncertainties are introduced due to the need for precise understanding of the beam optics and relative alignment of the detectors. Reduced statistical precision also results due to the limited geometrical acceptance of the detectors ( 6%).
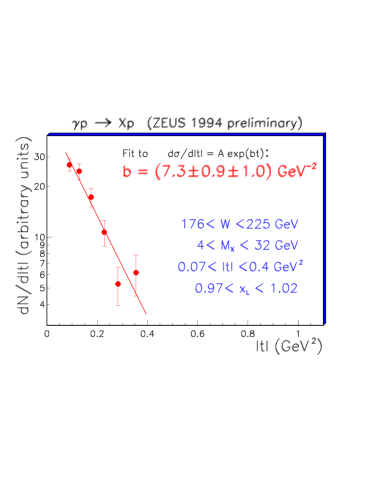
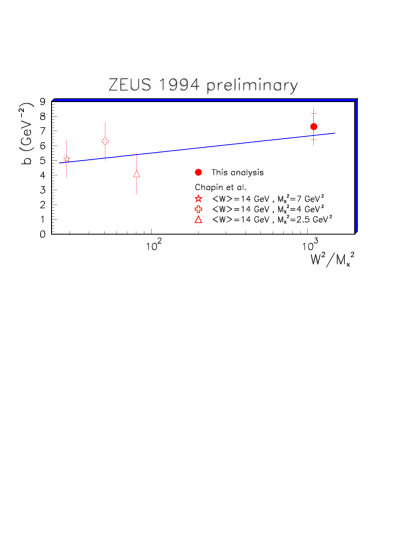
Photoproduction Results: ZEUS has measured the photon dissociation distribution using the LPS, as shown in Fig. 17. An exponential fit to the data yields a -slope parameter, GeV-2. A comparison of the data with lower data from Chapin et al. shows that the result is consistent with shrinkage, as previously discussed in relation to exclusive production. H1 results on the photon dissociation cross-sections as a function of in two intervals are shown in Fig. 18. Regge theory predicts the form of the cross-section as a function of and , as discussed with respect to proton dissociation. The cross-section is therefore fitted to the form
The contributions due to reggeon exchange are fixed using the lower energy data. Integrating over the dependence of yields a value of (sys)(model), again, consistent with soft pomeron exchange.
Deep inelastic structure of diffraction: A new era for diffraction was opened with the study of the dissociation of photons. Here, the photon can be considered as probing the structure of the exchanged colourless object mediating the interaction. The deep inelastic structure of colour singlet exchange is therefore being studied. In the presentation of the results, the formalism changes [24], reflecting an assumed underlying partonic description, and two orthogonal variables are determined
where is the momentum fraction of the pomeron within the proton and is the momentum fraction of the struck quark within the pomeron. The structure function is then defined by analogy to that of the total cross-section
where the contribution of and radiative corrections are neglected and an integration over the variable has been performed.

In addition to the structure of the pomeron, corresponding to large , it is also possible to study the structure of the reggeons that contribute at lower . H1 has analysed the leading proton data at lower () and employed the formalism noted above to measure the structure of the exchange for reasonably forward protons, as shown in Fig. 19 [25]. The data are consistent with a flat dependence in all intervals of and i.e. . This is consistent with a factorisable ansatz of where measures the flux of reggeons in the proton and is the probed structure of these reggeons. The exponent of is identified as , where measures the effective dependence ( dependence at fixed and ) of the cross-section, integrated over . The data are consistent with , corresponding to . These data involve colour singlet exchange and need to be explained in terms of QCD, but they are clearly not of a diffractive nature.
The area of interest for diffraction is in the behaviour of small values of , where is now identified as . Here, the data fall approximately as (equivalent to a flat cross-section with increasing ) and therefore the data are plotted as in Fig. 20. In the H1 case, the measurement is presented with no explicit subtraction for the non-diffractive contribution and quoted for limited masses of the dissociated proton system ( GeV). The measurement relies upon a good understanding of the various contributions to the cross-section in and around the measured region: the control plots in Fig. 14 illustrate how well this is achieved by combining the different Monte Carlo contributions.
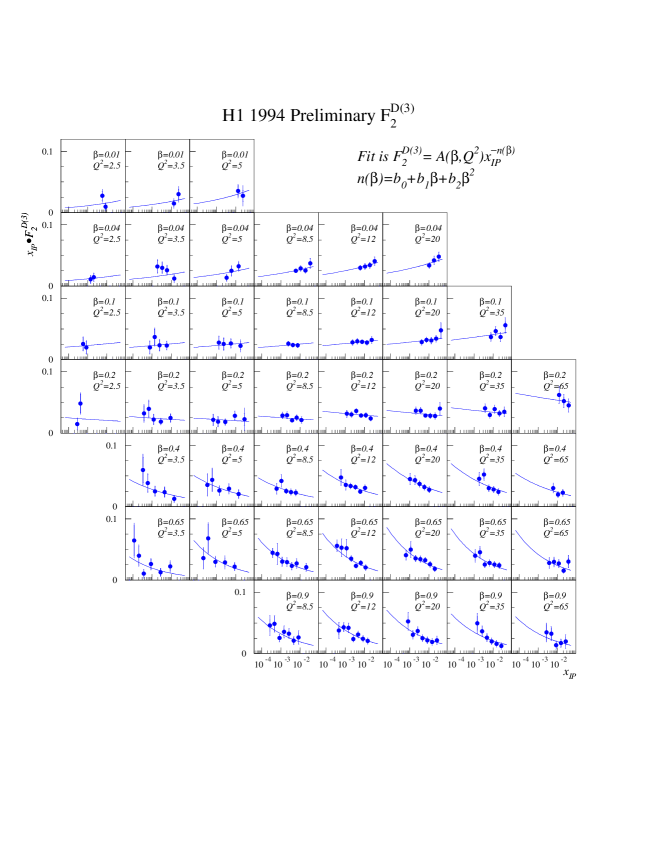
Fits of the form are performed where the normalisation constants are allowed to differ in each interval. The fits are motivated by the factorisable ansatz of where measures the flux of pomerons in the proton and is the probed structure of the pomeron. The exponent of is identified as , where measures the effective dependence ( dependence at fixed and ) of the cross-section, integrated over , as discussed in relation to exclusive vector meson production. However, the data are now sufficently precise that a single value for is not sufficient. In fact, the contribution from reggeon exchange cannot be excluded since the data extend to beyond approximately 0.01 and therefore a full fit to the pomeron and reggeon contributions is required. A fit to the pomeron and reggeon contributions has therefore been performed
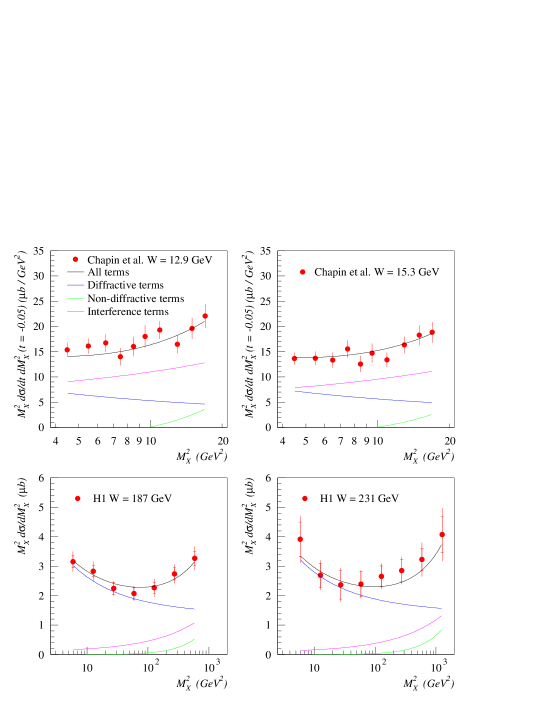
The fit provides a very good overall description of the data with a /DoF = 165/156. Here, the function is taken from the GRV parametrisation of the pion structure function and it is assumed that the interference between the pomeron and reggeon exchanges is maximal. This is illustrated for example bins of at fixed GeV2 in Fig. 21. The lower curve represents the pomeron contribution, the middle curve corresponds to the sum of the two contributions without taking into account the (positive) interference and the upper curve is the full fit result. It should be noted that the quark-like reggeon structure function falls like at these values whereas the pomeron structure function emerging after integration over is rather flat: the reggeon contributions thereforefore play a significant role at smaller values of . Also, for the smallest values of , the form of the pion (and hence reggeon) structure function is less well known and the contribution of non-colour singlet exchange contributions starts to become significant. Assuming and integrating over with GeV-2 using GeV-2 yields [26]
The ZEUS virtual-photon proton cross-sections measured at fixed and , measured using the method (and therefore explicitely subtracting the non-diffractive contribution) can be converted to at fixed and . These results are shown in Fig. 22 as the ZEUS() [23] analysis, compared to the ZEUS LPS analysis of , integrated over the measured range, in comparable intervals of and as a function of .
The double dissociation contribution is estimated with similar uncertainties to the vector meson case. Common systematic errors are similar to those for the analyses () with additional acceptance uncertainties due to variations of the input diffractive Monte Carlo distributions. The LPS data therefore provide an excellent calibration to cross-check the background subtraction methods. The overall cross-sections in overlapping and intervals are in good agreement. In the region of overlap, the H1 and ZEUS LPS data points also agree well. The ZEUS LPS data beyond of 0.01 again tend to turn over, as observed in the H1 data.

The corresponding ZEUS LPS measurement of the distribution is shown in Fig. 23, measured in the range , GeV2, and GeV2. The slope can be characterised by a single exponential fit with GeV-2 [23]. This is very similar to the slope obtained in the photoproduction case and is somewhat high compared to the value of expected for a predominantly hard pomeron but lies within the range of expectations of .
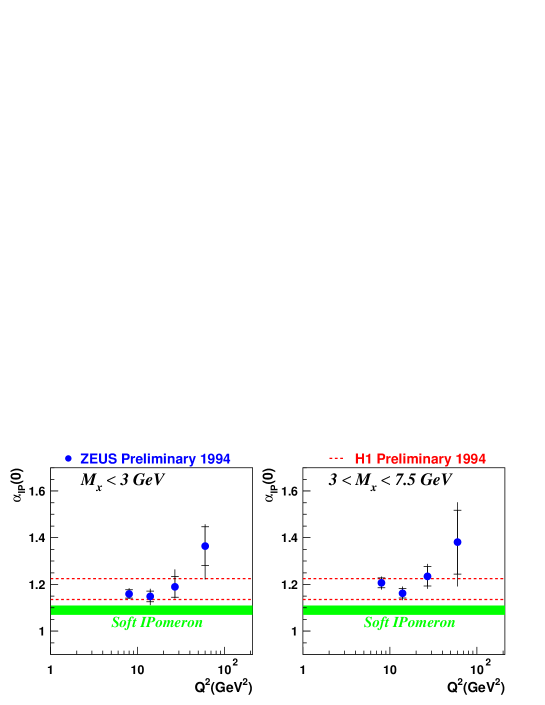
The ZEUS data are largely restricted to the small and region and therefore purely pomeron contributions are significant. A direct fit to the data in fixed intervals yields a similar value for . This is illustrated in Fig. 24 where the the dependence of the extracted is compared to the H1 result as well as the soft pomeron prediction. The results for , obtained using different experimental methods, are compatible. These values are however incompatible with the predicted soft pomeron behaviour of . As noted previously in relation to exclusive production (corresponding to the large region), the contribution of longitudinal photons is significant. An upper estimate of the effect of made by assuming rather than increases the measured value of by about 0.05. Similarly, if no shrinkage were assumed, the value of would increase by .

The values can be compared with 0.2 obtained from the exclusive photoproduction of mesons and the ZEUS exclusive electroproduction data at large . These values are also compatible with fits to the inclusive DIS (i.e. the dependence of the corresponding total cross-sections) which yield 0.2 to 0.25 in the measured range [12]. In the model of Buchmüller and Hebecker [8], the effective exchange is dominated by one of the two gluons. In terms of , where the optical theorem is no longer relevant, the diffractive cross-section would therefore rise with an effective power which is halved to 0.1 to 0.125. Given the uncertainties, the measured values are within the range of these estimates.
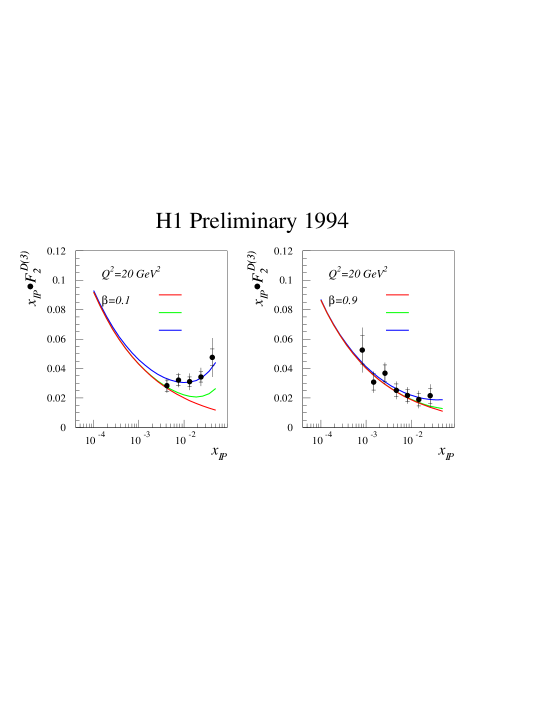
The overall cross-sections in each , interval are similar and one can integrate over the measured dependence in order to determine (), a quantity which measures the internal structure of the pomeron up to an arbitrary integration constant. In Fig. 25 the H1 data are compared to preliminary QCD fits [26]. The data are fitted in the range using the functional form shown in Fig. 20.
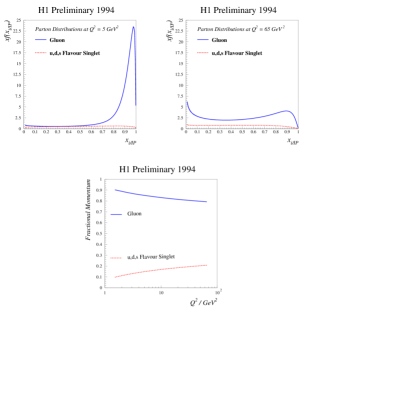
The general conclusions from the dependence are that the pomeron has a rather flat structure as a function of . This is typically characterised by a symmetric dependence, but an additional significant contribution at low is required which has been fitted in the ZEUS analysis [22]. The behaviour is broadly scaling, consistent with a partonic structure of the pomeron. Probing more deeply, however, a characteristic logarithmic rise of is observed in all intervals. Most significantly, at large a predominantly quark-like object would radiate gluons resulting in negative scaling violations as in the case of the large- () behaviour of the proton. The question of whether the pomeron is predominantly quarks or gluons, corresponding to a “quarkball” or a “gluemoron” [30], has been tested quantitatively by H1 using QCD fits to [26]. A flavour singlet quark density input of the form , where is the momentum fraction carried by the quark, yields a high /DoF = 95/39, since the characteristic behaviour is not reproduced. Adding a gluon contribution of similar form gives an excellent description of the data with /DoF = 36.8/37, as shown in Fig. 25. In Fig. 26, the corresponding parton distributions are shown. In general, the fits tend to favour inputs where the gluon carries a significant fraction, 70 to 90%, of the pomeron’s momentum.

4 Hadronic final states and jet structure
The measurements of the scaling violations of the structure function of the pomeron provide a method to determine the parton distributions of the pomeron. The question of whether such an approach is useful can be addressed by applying these parton distributions to calculations for other processes which are directly sensitive to this partonic structure.
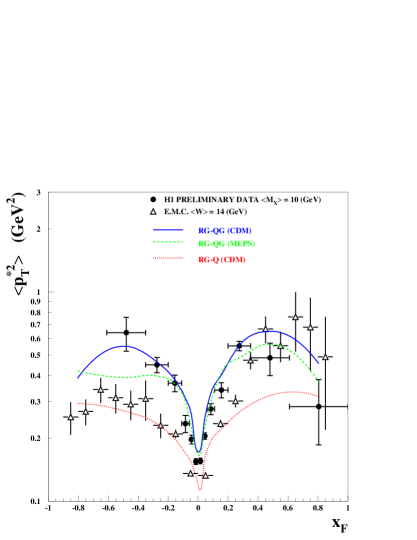
Historically, the measurements of , the mean transverse momentum-squared of the outgoing hadrons, as a function of , the scaled longitudinal momentum distribution, provided insight into the structure of the proton. Here, the variables are measured in the hadronic centre of mass frame and with respect to the virtual photon-proton axis which is equivalent to the virtual photon-pomeron axis for small values of . In Fig. 27(a), the H1 data (full circles) are compared to the EMC data at similar values. The data are also compared to the RAPGAP (RG) Monte Carlo predictions incorporating quarks and gluons (-QG) and quarks only (-Q) [31]. (MEPS) and (CDM) refer to the Matrix Elements plus Parton Showers and Colour Dipole Model fragmentation schemes, respectively. The H1 data are approximately symmetric about with a relatively large peaking around 0.6 GeV2. The symmetry and relatively large values reflect the underlying boson-gluon fusion process where a “leading” gluon from the pomeron interacts with the virtual photon. This behaviour is in contrast to the EMC data where QCD radiation is suppresed in the negative- (proton remnant) region. Quantitatively the RAPGAP Monte Carlo which incorporates the pomeron parton densities (-QG) gives a good description of the data, provided that quarks and gluons are incorporated whereas a model with only quark (-Q) fails to describe the data. These conclusions are relatively independent of the fragmentation scheme, but the colour dipole model tends to give a better description of the data.
Similarly, event shape variables have been used at colliders in order to establish the existence of gluon Bremsstrahlung radiation. In this case, the measurement of e.g. mean thrust (the mean value of the scaled longitudinal momentum with respect to the axis which maximises this value) is sensitive to the gluon-induced diagrams. A comparison of thrust with annihilation experiments as a function of the reciprocal of hadronic centre of mass is shown in Fig. 27(b). The diffractive data exhibit lower thrust values compared to data for all values of . This additional broadening is due to the boson gluon fusion process which has no analogue in annihilation continuum region.

The general increase in thrust with increasing (decreasing ) is indicative of jet production. The question of the constituent content of the pomeron can also be addressed via measurements of diffractively produced jets in the photoproduction data [32]. Jets are reconstructed at large ( GeV) using the cone algorithm with unit cone radius and two jets with GeV. The diffractive contribution is identified as a tail in the distribution of these events above the PYTHIA 5.7 [33] Monte Carlo expectation. In Fig. 28 the measured cross-section is compared to various model predictions as a function of , an estimator of the fraction of the pomeron momentum transferred to the dijet system.
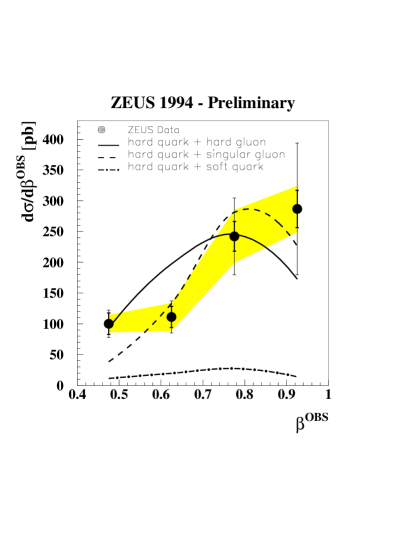
The non-diffractive contribution estimated from PYTHIA (not shown) is significantly lower than the data. Here, standard photon and proton parton distributions are adopted and the overall scale, which agrees with the non-diffractive data normalisation, is set by . Also shown are the predicted diffractive cross-sections from the LO QCD calculation plus parton showers of POMPYT, using a hard () quark combined with either a hard, soft (() or singular gluon where a Donnachie-Landshoff flux factor is adopted. Sampling low-energy (soft) gluons corresponds to a small cross-section and can be discounted, whereas high-energy (hard) gluons and/or quarks can account for the cross-section by changing the relative weights of each contribution. The shape of the distribution is clearly sensitive to the shape of the input gluon distribution.
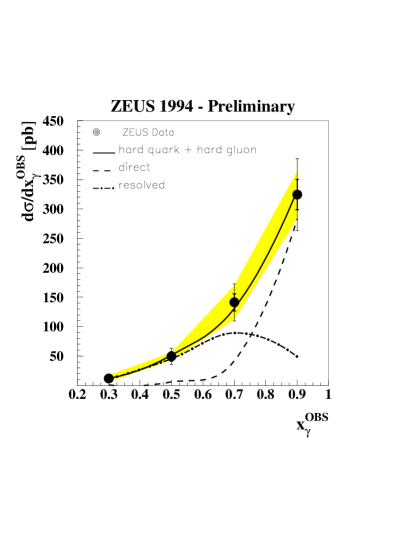
The distribution for these events, where is the corresponding estimator of the fraction of the photon momentum transferred to the dijet system, is peaked around 1, indicating that at these values a significant fraction of events is due to direct processes where the whole photon interacts with the pomeron constituents.
So far we have only considered the case of small- diffraction with respect to the outgoing proton. Further insight into the diffractive exchange process can be obtained by measurements of the rapidity gap between jets. Here, a class of events is observed with little hadronic activity between the jets [34]. The jets have GeV and are separated by a pseudorapidity interval () of up to 4 units. The scale of the momentum transfer, , is not precisely defined but is of order . A gap is defined as the absence of particles with transverse energy greater than 300 MeV between the jets. The fraction of events containing a gap is then measured as a function of , as shown in Fig. 29. The fit indicates the sum of an exponential behaviour, as expected for non-diffractive processes and discussed in relation to the diffractive DIS data, and a flat distribution expected for diffractive processes. At values of , an excess is seen with a constant fraction over the expectation for non-diffractive exchange at . This can be interpreted as evidence for large- diffractive scattering. In fact, secondary interactions of the photon and proton remnant jets could fill in the gap and therefore the underlying process could play a more significant rôle. The size of this fraction is relatively large when compared to a similar analysis by DØ and CDF where a constant fraction at is observed [36, 37], as discussed below.

5 Diffraction at the Tevatron
The study of diffraction benefits by looking at information from other types of interaction. In where there is no complex colour state in the interacting beams, various searches for rapidity gaps yield results which can be explained in terms of exponentially-suppressed colour exchange and these data do not require the introduction of a “pomeron” [35]. In contrast, the earliest work on diffractive processes focussed on collisions where two complex colour states interact. The latest studies at the Tevatron complement those at HERA and allow tests of factorisation in compared to .
The studies of colour singlet exchange between jets at HERA was inspired by earlier studies at the Tevatron. These studies determined percentage gap-fractions of % for DØ [36] and % for CDF [37]. The behaviour of this colour singlet fraction as a function of average dijet energy is shown in Fig. 30(a) for jet thresholds of 15 GeV (low), 25 GeV (medium) and 30 GeV (high) [38]. In Fig. 30(b), the gap-fraction is examined as a function of . A simple two-gluon exchange model with no additional QCD dynamics would tend to produce a flat gap-fraction, but the tendency towards an increasing gap-fraction with indicates an additional dynamical mechanism is necessary to describe the data.
The differences in the overall gap-fractions observed at HERA near 10%, compared to those at Fermilab of approximately 1%, may reflect the higher values of the Tevatron compared to HERA. But the fact that this difference is so large indicates differences in the underlying high- interactions compared to the relatively low- interactions where spectator interactions are more likely to fill in the gap.

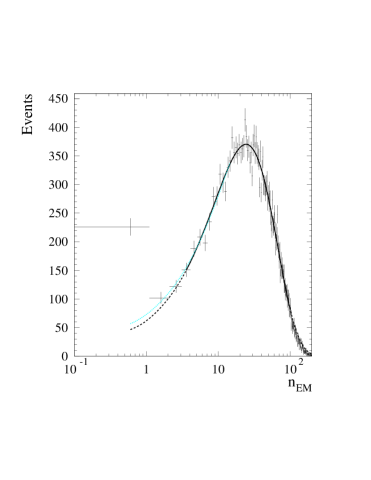
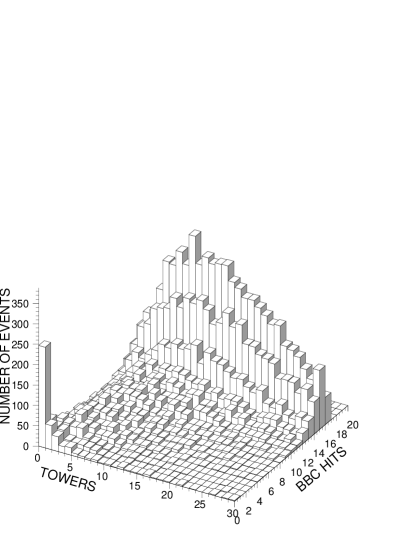
Diffractive dijet production has been studied at the Tevatron. The presence of a diffracted proton may be identified either by a large rapidity gap on either the proton or antiproton side or by directly detecting the leading proton (CDF roman pots). In the rapidity gap analyses, DØ measure uncorrected dijet rates with GeV and in coincidence with the multiplicity in the electromagnetic calorimeter () opposite the dijet system, as shown in Fig. 31(a). Similarly, CDF measure the multiplicity in the forward part of the calorimeter () in coincidence with the number of hits in the BBC scintillator counter close to the beampipe (), as shown in Fig. 31(b). Here the jets are measured for GeV and the diffractive events concentrate in the region . The ratio of diffractive dijet events is measured by CDF to be % and by DØ to be %. These preliminary figures are therefore in good agreement and can be used to constrain the gluon content of the pomeron. In addition, % has been measured using the CDF roman pots in region of large (, GeV and GeV2). This is a region where reggeon (quark-like) contributions are presumably important.
CDF have also tagged diffractive production using high- electrons/positrons and missing to tag the and then searching for a rapidity gap on the opposite side as in the dijet gap analysis [39]. The corrected ratio for diffractive/non-diffractive -production is measured to be
An important question when relating the various diffractive measurements which involve a hard scale is whether Regge factorisation, in terms of a pomeron flux and parton densities within the pomeron, is applicable. In particular, if this approach is to be useful, a flux is required (or a QCD description of the non-universal correction to the flux). In this context, the rates for diffractive processes at HERA are compared to those observed at the Tevatron below.
We have two sets of CDF data probing the pomeron structure at similar momentum scales, and . Each probes the large structure of the pomeron with the dijet and data predominantly sampling the (hard) gluon and quark distributions, respectively. In addition, we have the corresponding DIS [22] and jet HERA data sampling the (hard) gluon and quark distributions, respectively. In Fig. 32 the momentum fraction carried by the (hard) gluon, , is plotted versus the momentum fraction of partons in the pomeron assuming a Donnachie-Landshoff flux. The CDF data are consistent with a momentum fraction carried by the gluons of , in agreement with the ZEUS measurements of , taking into account the systematic uncertainties due (mainly) to the estimation of the non-diffractive background. This in turn can be compared with the H1 NLO parton distributions (see Fig. 26) which indicate in the high region. There is therefore reasonable agreement on the parton content of the pomeron. However, the overall diffractive rates are significantly higher at HERA compared to the Tevatron. This is reflected in the difference in the overall level of the ZEUS and CDF data in Fig. 32. This corresponds to a significantly different flux of pomerons (i.e. breaking of Regge factorisation) which has been predicted in terms of QCD [40, 41] to reduce the diffractive cross-sections for processes which have two strongly-interacting initial state hadrons. These effects are not apparent in the HERA data, where a virtual photon or a (predominantly) direct photon participate in the hard scattering process.

Double pomeron exchange, where the and remain intact, has also been studied by CDF and DØ for their dijet samples. This process should be directly sensitive to Regge-factorisation breaking effects. Both experiments find a ratio of hard double pomeron exchange events to non-diffractive events of . This is consistent with independent dissociation of the and , with probabilities , but further studies are required to establish these rates and determine whether these can be explained by the factorisation-breaking calculations [41].
6 Conclusions
The soft pomeron does not describe diffractive data measured at HERA. As the photon virtuality or the vector meson mass increase a new dependence on emerges. As we investigate the pomeron more closely, a new type of dynamical pomeron may begin to play a rôle; a dynamical pomeron whose structure is being measured in DIS. These data are consistent with a partonic description of the exchanged object which may be described by pQCD.
The cross-sections for hard diffractive processes at HERA can be compared to those observed at the Tevatron. All data are consistent with a significant gluon contribution of the partons within the pomeron i.e. QCD factorisation appears to be observed. However, a universal pomeron flux does not describe the observed rates i.e. Regge factorisation does not apply. This is qualitatively expected from QCD corrections to the rates, but the effects are large and non-perturbative.
The experimental work focuses on extending the lever arms and increasing the precision in , , and in order to explore this new structure. Before more precise tests can be made, further theoretical and experimental input is required to reduce the uncertainties due to non-diffractive backgrounds and proton dissociation as well as the treatment of and radiative corrections.
Acknowledgements
The results presented in this talk are a summary of significant developments at HERA and the Tevatron in the study of diffraction. The financial support of the DESY Directorate and PPARC allowed me to participate in this research, whilst based at DESY, for which I am very grateful. Many thanks to Halina Abramowicz, Nick Brook, Allen Caldwell, Nicolo Cartiglia, Malcolm Derrick, John Dainton, Martin Erdmann, Elisabetta Gallo, Peppe Iacabucci, Michael Kuhlen, Aharon Levy, Jason McFall, Paul Newman, Juan Puga, David Saxon, Laurel Sinclair, Ian Skillicorn, Juan Terron and Robert Waugh for their encouragement, enthusiasm, help and advice. It is a pleasure to thank the organisers for their additional financial support and a very enjoyable summer school.
References
- [1] H. Fritzsch, Aachen Workshop on “QCD - 20 Years Later”, World Scientific, (1992) 827.
- [2] N. Cartiglia (SSI 96), hep-ph/970325.
- [3] K. Goulianos, Phys. Rep. 101 (1983) 169; Nucl. Phys. B (Proc. Suppl.) 12 (1990) 110.
- [4] A. Donnachie and P.V. Landshoff, Nucl. Phys. B244 (1984) 322.
- [5] CDF Collab., F. Abe et al., Phys. Rev. D50 (1994) 5550.
- [6] J.R. Cudell, K. Kang and S.K. Kim, hep-ph/9601336.
- [7] WA91 Collab., S. Albatzis et al., Phys. Lett. B321 (1994) 509.
- [8] W. Buchmüller and A. Hebecker, DESY 95-077, W. Buchmüller, DIS97-AIP Conference Proceedings 147 (1997) 542.
- [9] J.A. Crittendon, hep-ex/9704009 (and references therein).
- [10] D. Aston et al., Nucl. Phys. B209 (1982) 56.
- [11] M. Ryskin, Z. Phys. C57 (1993) 89.
- [12] A. Levy, DESY 95-204.
- [13] M. Glück, E. Reya and A. Vogt, Phys. Lett. B306 (1993) 391.
- [14] ZEUS Collab., J. Breitweg et al., Jerusalem EPS 97-646.
- [15] E665 Collab., M. Adams et al., MPI-PhE-97-03.
- [16] S. Brodsky et al., Phys. Rev D50 (1994) 3134.
- [17] ZEUS Collab., M. Derrick et al., Phys. Lett. B356 (1995) 601.
- [18] H. Holtmann et al., hep-ph/9503441.
- [19] CDF Collab., F. Abe et al., Phys. Rev. D50 (1994) 5535.
- [20] E. Gallo, hep-ex/9710013.
- [21] H1 Collab., T. Ahmed et al., Phys. Lett. B348 (1995) 681.
- [22] ZEUS Collab., M. Derrick et al., Z. Phys. C68 (1995) 569.
- [23] ZEUS Collab., J. Breitweg et al., Jerusalem EPS 97-638. (Final results for the measurement of are available in DESY 97-184.)
- [24] G. Ingelman and K. Jansen-Prytz, Z. Phys. C58 (1993) 285.
- [25] H1 Collab., C. Adloff et al., Jerusalem EPS 97-379.
- [26] H1 Collab., C. Adloff et al., Jerusalem EPS 97-337. (Final results are available in Z. Phys. C76 (1997) 613.)
- [27] L. Lönnblad, Comp. Phys. Comm. 71 (1992) 15.
- [28] P. Bruni and G. Ingelman, DESY 93-187; Proceedings of the Europhysics Conference on HEP, Marseille 1993, 595.
- [29] N.N. Nikolaev and B.G. Zakharov, Z. Phys. C53 (1992) 331; M. Bertini et al., hep-ph/9710547.
- [30] F. Close and J. Forshaw, hep-ph/9509251.
- [31] C. Cormack, DIS97-AIP Conference Proceedings 147 (1997) 585. (Final results for the measurement of are available in DESY 97-210.)
- [32] ZEUS Collab., J. Breitweg et al., Jerusalem EPS 97-648; ZEUS Collab., M. Derrick et al., Phys. Lett. B356 (1995) 129.
- [33] H.-U. Bengtsson and T. Sjöstrand, Comp. Phys. Comm. 46 (1987) 43; T. Sjöstrand, CERN-TH.6488/92.
- [34] ZEUS Collab., M. Derrick et al., Phys. Lett. B369 (1996) 55.
- [35] SLD Collab., K. Abe et al., Phys. Rev. Lett. 76 (1996) 4886.
- [36] DØ Collab., S. Abachi et al., Phys. Rev. Lett. 72 (1994) 2332; DØ Collab., S. Abachi et al., FERMILAB-PUB-95-302-E (1995).
- [37] CDF Collab., F. Abe, et al., Phys. Rev. Lett. 74 (1995) 855.
- [38] J. Perkins, DIS97-AIP Conference Proceedings 147 (1997) 533.
- [39] CDF Collab., F. Abe, et al., Phys. Rev. Lett. 78 (1997) 2698.
- [40] D. Soper, DIS97-AIP Conference Proceedings 147 (1997) 147.
- [41] J. Collins et al., Phys. Lett. B307 (1993) 161; J. Collins, hep-ph/9709499.