Observation of the Radiative Decay
Abstract
We have observed a signal for the decay at a significance of 4 standard deviations. From the measured branching ratio we find , where the first uncertainty is statistical and the second is systematic. We also report the highest precision measurements of the remaining branching fractions.
pacs:
PACS numbers: 13.20.Fc, 13.40.Hq, 14,40.Lb, 12.39.FeJ. Bartelt,1 S. E. Csorna,1 V. Jain,1,***Permanent address: Brookhaven National Laboratory, Upton, NY 11973. K. W. McLean,1 S. Marka,1 R. Godang,2 K. Kinoshita,2 I. C. Lai,2 P. Pomianowski,2 S. Schrenk,2 G. Bonvicini,3 D. Cinabro,3 R. Greene,3 L. P. Perera,3 G. J. Zhou,3 B. Barish,4 M. Chadha,4 S. Chan,4 G. Eigen,4 J. S. Miller,4 C. O’Grady,4 M. Schmidtler,4 J. Urheim,4 A. J. Weinstein,4 F. Würthwein,4 D. W. Bliss,5 G. Masek,5 H. P. Paar,5 S. Prell,5 V. Sharma,5 D. M. Asner,6 J. Gronberg,6 T. S. Hill,6 D. J. Lange,6 R. J. Morrison,6 H. N. Nelson,6 T. K. Nelson,6 J. D. Richman,6 D. Roberts,6 A. Ryd,6 M. S. Witherell,6 R. Balest,7 B. H. Behrens,7 W. T. Ford,7 H. Park,7 J. Roy,7 J. G. Smith,7 J. P. Alexander,8 C. Bebek,8 B. E. Berger,8 K. Berkelman,8 K. Bloom,8 V. Boisvert,8 D. G. Cassel,8 H. A. Cho,8 D. S. Crowcroft,8 M. Dickson,8 S. von Dombrowski,8 P. S. Drell,8 K. M. Ecklund,8 R. Ehrlich,8 A. D. Foland,8 P. Gaidarev,8 L. Gibbons,8 B. Gittelman,8 S. W. Gray,8 D. L. Hartill,8 B. K. Heltsley,8 P. I. Hopman,8 J. Kandaswamy,8 P. C. Kim,8 D. L. Kreinick,8 T. Lee,8 Y. Liu,8 N. B. Mistry,8 C. R. Ng,8 E. Nordberg,8 M. Ogg,8,†††Permanent address: University of Texas, Austin TX 78712. J. R. Patterson,8 D. Peterson,8 D. Riley,8 A. Soffer,8 B. Valant-Spaight,8 C. Ward,8 M. Athanas,9 P. Avery,9 C. D. Jones,9 M. Lohner,9 C. Prescott,9 J. Yelton,9 J. Zheng,9 G. Brandenburg,10 R. A. Briere,10 A. Ershov,10 Y. S. Gao,10 D. Y.-J. Kim,10 R. Wilson,10 H. Yamamoto,10 T. E. Browder,11 Y. Li,11 J. L. Rodriguez,11 T. Bergfeld,12 B. I. Eisenstein,12 J. Ernst,12 G. E. Gladding,12 G. D. Gollin,12 R. M. Hans,12 E. Johnson,12 I. Karliner,12 M. A. Marsh,12 M. Palmer,12 M. Selen,12 J. J. Thaler,12 K. W. Edwards,13 A. Bellerive,14 R. Janicek,14 D. B. MacFarlane,14 P. M. Patel,14 A. J. Sadoff,15 R. Ammar,16 P. Baringer,16 A. Bean,16 D. Besson,16 D. Coppage,16 C. Darling,16 R. Davis,16 S. Kotov,16 I. Kravchenko,16 N. Kwak,16 L. Zhou,16 S. Anderson,17 Y. Kubota,17 S. J. Lee,17 J. J. O’Neill,17 S. Patton,17 R. Poling,17 T. Riehle,17 A. Smith,17 M. S. Alam,18 S. B. Athar,18 Z. Ling,18 A. H. Mahmood,18 H. Severini,18 S. Timm,18 F. Wappler,18 A. Anastassov,19 J. E. Duboscq,19 D. Fujino,19,‡‡‡Permanent address: Lawrence Livermore National Laboratory, Livermore, CA 94551. K. K. Gan,19 T. Hart,19 K. Honscheid,19 H. Kagan,19 R. Kass,19 J. Lee,19 M. B. Spencer,19 M. Sung,19 A. Undrus,19,§§§Permanent address: BINP, RU-630090 Novosibirsk, Russia. R. Wanke,19 A. Wolf,19 M. M. Zoeller,19 B. Nemati,20 S. J. Richichi,20 W. R. Ross,20 P. Skubic,20 M. Bishai,21 J. Fast,21 J. W. Hinson,21 N. Menon,21 D. H. Miller,21 E. I. Shibata,21 I. P. J. Shipsey,21 M. Yurko,21 S. Glenn,22 S. D. Johnson,22 Y. Kwon,22,¶¶¶Permanent address: Yonsei University, Seoul 120-749, Korea. S. Roberts,22 E. H. Thorndike,22 C. P. Jessop,23 K. Lingel,23 H. Marsiske,23 M. L. Perl,23 V. Savinov,23 D. Ugolini,23 R. Wang,23 X. Zhou,23 T. E. Coan,24 V. Fadeyev,24 I. Korolkov,24 Y. Maravin,24 I. Narsky,24 V. Shelkov,24 J. Staeck,24 R. Stroynowski,24 I. Volobouev,24 J. Ye,24 M. Artuso,25 F. Azfar,25 A. Efimov,25 M. Goldberg,25 D. He,25 S. Kopp,25 G. C. Moneti,25 R. Mountain,25 S. Schuh,25 T. Skwarnicki,25 S. Stone,25 G. Viehhauser,25 and X. Xing25
1Vanderbilt University, Nashville, Tennessee 37235
2Virginia Polytechnic Institute and State University, Blacksburg, Virginia 24061
3Wayne State University, Detroit, Michigan 48202
4California Institute of Technology, Pasadena, California 91125
5University of California, San Diego, La Jolla, California 92093
6University of California, Santa Barbara, California 93106
7University of Colorado, Boulder, Colorado 80309-0390
8Cornell University, Ithaca, New York 14853
9University of Florida, Gainesville, Florida 32611
10Harvard University, Cambridge, Massachusetts 02138
11University of Hawaii at Manoa, Honolulu, Hawaii 96822
12University of Illinois, Urbana-Champaign, Illinois 61801
13Carleton University, Ottawa, Ontario, Canada K1S 5B6
and the Institute of Particle Physics, Canada
14McGill University, Montréal, Québec, Canada H3A 2T8
and the Institute of Particle Physics, Canada
15Ithaca College, Ithaca, New York 14850
16University of Kansas, Lawrence, Kansas 66045
17University of Minnesota, Minneapolis, Minnesota 55455
18State University of New York at Albany, Albany, New York 12222
19Ohio State University, Columbus, Ohio 43210
20University of Oklahoma, Norman, Oklahoma 73019
21Purdue University, West Lafayette, Indiana 47907
22University of Rochester, Rochester, New York 14627
23Stanford Linear Accelerator Center, Stanford University, Stanford, California 94309
24Southern Methodist University, Dallas, Texas 75275
25Syracuse University, Syracuse, New York 13244
The decays of the excited charmed mesons, and , have been the subject of extensive theoretical [1, 2, 3, 4] as well as experimental [5, 6, 7, 8, 9, 10, 11] investigation. The decay of the via emission of a or a photon has been observed and its branching ratio well measured [12]. While the hadronic decays ( and ) [13] have been observed and are widely used to tag quark decays, the observation of the radiative decay remained problematic. Both mesons decay electromagnetically as the result of a spin-flip of either the charm quark or the light quark. In the case of the , the decay amplitudes for these two processes interfere constructively. Combined with the phase space suppression of the hadronic decay, this interference results in a radiative decay fraction which competes with the hadronic decay fraction. In the case of the , the amplitudes for the two spin-flip processes interfere destructively. Also, there is slightly more phase space available for the hadronic decay. These two conditions result in a radiative decay fraction of the which, in comparison to the , is significantly suppressed relative to the hadronic decay fraction.
A great deal of interest in the radiative decay was generated by an earlier Particle Data Group average of [14]; this value was virtually impossible to reconcile with theory without assuming an anomalously large magnetic moment for the charm quark [4]. Based on 780 pb-1 of data, a previous CLEO II analysis [10] found an upper limit of (90% C.L.) for this branching fraction, a result which strongly affected not only the branching fractions but also many measurements. In addition to its importance in measuring meson decays, a precision determination of the branching fractions will provide an important test of many quark models and other theoretical approaches to heavy meson decays [1]. For theories built around chiral and heavy-quark symmetry (heavy hadron chiral perturbation theory) [2], this measurement will also provide a strong constraint on the two input parameters ( and ) allowing model-independent predictions to be made on a wide variety of observable quantities [3].
The approach used in this analysis is to search in the [15] and distributions for events using the decay chain or ), . The branching ratio
| (1) |
is then determined, where is the ratio of the number of decays observed in each mode, and is the relative efficiency for finding the or the from the corresponding decay. Assuming that the three decay modes of the add to unity and defining , one finds , and . Constraints on can be obtained by combining the known phase space for and with isospin conservation and the expected dependence of -wave decay widths to yield,
| (2) |
(where and are the momenta of the and in the rest frame, respectively). The theoretical uncertainty in this ratio is thought to be only of order 1% [4], so the error is dominated by those due to the mass differences [12]. This method has the advantage of avoiding large systematic uncertainties due to the meson branching fractions and of canceling many systematic uncertainties associated with the reconstruction.
The analysis was performed using data accumulated by the CLEO II detector [16] at the Cornell Electron Storage Ring (CESR). The CLEO II detector consists of three cylindrical drift chambers (immersed in a 1.5 T solenoidal magnetic field) surrounded by a time-of-flight system (TOF) and a CsI crystal electromagnetic (EM) calorimeter. The main drift chamber allows for charged particle identification via specific-ionization measurements () in addition to providing an excellent momentum measurement. The calorimeter is surrounded by a superconductor coil and an iron flux return, which is instrumented with muon counters.
A total of 4.7 fb-1 of data were collected at center-of-mass energies on or near the (4S) resonance. The Monte Carlo simulated events used to determine signal shapes and detection efficiencies were produced with a GEANT-based full detector simulation. Also, a continuum Monte Carlo sample (which contains roughly double the statistics of the data) was used to test the analysis code and methods.
Events were required to have three or more tracks and at least 15% of the center-of-mass energy deposited in the calorimeter. Each of the three tracks comprising a candidate decay was required to satisfy either the or hypothesis at the level using alone, and then the triplet was required to satisfy the hypothesis, including TOF information if available, with a probability greater than . The three tracks were then constrained to come from a common vertex, and the invariant mass of the triplet, under the hypothesis, was required to be within 10 MeV/ () of the known mass.
Photon candidates were required to be in the best region of the calorimeter, (where is the polar angle between the EM cluster centroid and the beam axis), with a cluster energy of at least 30 MeV. It was further required that no charged particle track point within 8 cm of a crystal used in the EM cluster. If the invariant mass formed by a pair of photons was within of the mass, taking into account the asymmetric line shape and the small momentum dependence of the mass resolution, the photons were identified as being from a . The photons were then kinematically constrained to the mass to improve the momentum measurement.
Photons from decays were required to pass a lateral shower shape cut, which is 99% efficient for isolated photons, and not to form a when paired with any other photon. The decay angle , defined as the angle of the in the rest frame with respect to the ’s direction in the laboratory frame, was required to satisfy . This cut helps to reduce the large combinatorial background that arises when mesons are combined with soft photons moving in the opposite direction.
The combinatorial background was further reduced by requiring , where is the fraction of the maximum possible momentum carried by the reconstructed . This cut also removed any contribution from events. The cuts on and were determined to maximize ( is signal and is background) by utilizing a large sample of events from the data as well as Monte Carlo simulated events.
The primary difficulty in this analysis is the small size of the signal, due to the branching fraction, relative to a large combinatorial background and, more importantly, relative to a background due to radiative decays where . Unlike the , the almost always decays radiatively. This is a major problem because the mass difference is MeV [17] and the mass difference is MeV [12], so these two processes cannot be separated in the mass difference plot because the resolution in photon energy in the decay is MeV. Misidentification of as can occur because the TOF and information used for particle identification does not adequately separate ’s from ’s with momenta above GeV. When reconstructed under the hypothesis, the two invariant mass distributions partially overlap, and any attempt to estimate the fraction of under the peak will depend strongly on the resonant substructure of the decay, as well as the momentum distribution of the ’s. The large contribution to the lower sideband further complicates the analysis by preventing the use of this sideband in a subtraction of combinatorial background.
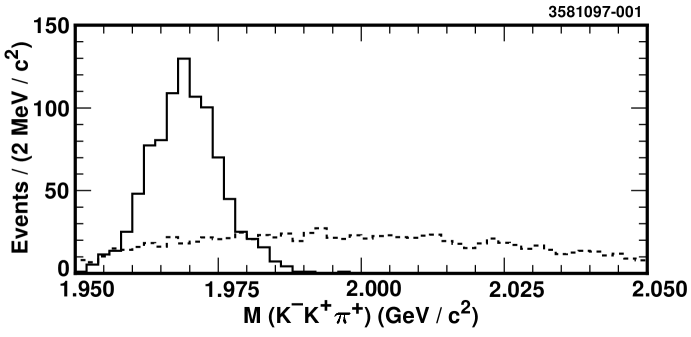
A means to veto events, independent of the decay’s resonant substructure, is to require that the invariant mass of the three tracks reconstructed under the hypothesis be greater than a cut which removes all the events. An unwanted side effect of vetoing events by this method is that a cut in the mass distribution greatly distorts the mass distribution, making the relative normalization between the upper sideband and the signal region uncertain. Thus the use of a sideband subtraction to remove the combinatorial background from the mass difference plot is impossible. Fig. 1 shows the Monte Carlo mass distribution found in decays and that found in decays when one of the ’s is misidentified as a . Since there are two possible tracks to assign the mass, both combinations are tried, and the one yielding the smaller mass is plotted.
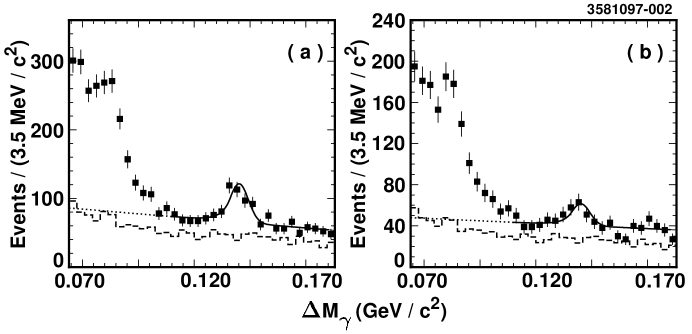
Fig. 2(a) shows the distribution for events from the signal region as well as for those from the upper sideband (a region three times as wide as the signal region starting above the nominal mass). The distribution for the combinatorial background found in the sideband is quite flat under the signal region, justifying the use of a first order polynomial in fitting this background. No veto has been applied to the data in Fig. 2(a), so a fair fraction of the events in this “signal” are background. The signal was fit with a modified Gaussian, the parameters for which were obtained from a large Monte Carlo sample of events. The systematic error in the fit parameters was estimated by studying data versus Monte Carlo differences in the very similar decay .
Fig. 2(b) shows the signal and sideband distributions for events satisfying the veto requirement that . Monte Carlo indicates the fraction of events passing this cut is , thus if the entire signal yield ( events) found in Fig. 2(a) were due to decays, events would be expected in Fig. 2(b). The fit to the distribution in Fig. 2(b) yields events. When these data are refit with the signal constrained to be events, the of the fit increases by 15.8, corresponding to a significance of 4.0 standard deviations for the signal.
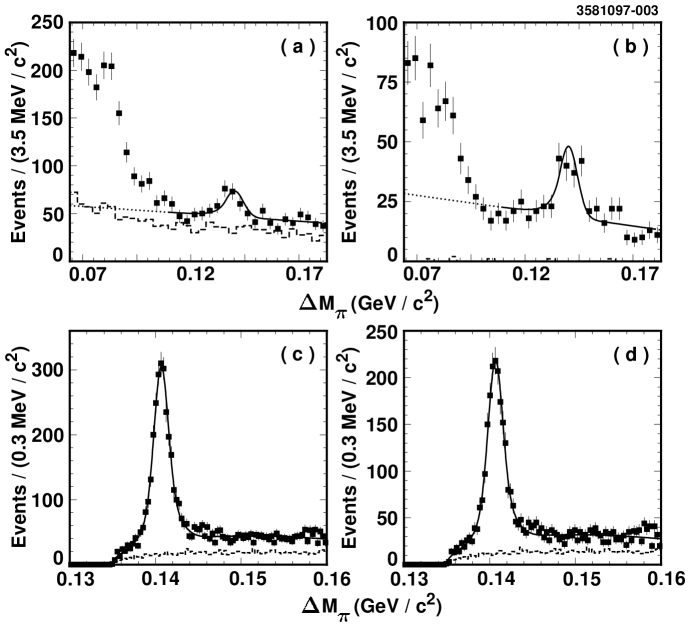
The presence of decays having been established, the veto was loosened to maximize as determined by the Monte Carlo samples. Fig. 3(a) shows the distribution for the events which passed the optimized veto. The fraction of mesons passing the veto was determined by fitting the distribution before and after the veto was applied to the data. This distribution was fit with a double Gaussian plus a background function [18] which simulates the expected threshold behavior. Figs. 3(c) and 3(d) show the distributions, along with the fits, used to determine the veto efficiency for mesons.
The results of fitting the distribution for events which passed and for those which failed the veto, Figs. 3(a) and 3(b) respectively, were: , (statistical errors only). Defining () as the total number of () in the data, the branching ratio was then extracted by solving the following pair of equations
| (3) |
where is the fraction of ’s which pass the veto as determined by fitting the distributions ( and , where the errors are statistical only), and is the fraction of ’s which escape the veto as determined by a Monte Carlo study. We find
| (4) |
where the ratio of efficiencies .
From this branching ratio we can then extract the branching fractions shown in Table I.
The statistical uncertainty is dominated by the yields, and the largest systematic uncertainty is due to variations in this yield when the mean and width of the signal shape was varied by an amount suggested by the data versus Monte Carlo comparison. A similar comparison was used to estimate the uncertainty introduced by the cos cut. Table II lists the various sources of systematic uncertainty and gives estimates for their impact on the measurement of .
In conclusion, we have observed, with significance, the radiative decay of the and measured (statistical and systematic uncertainties added in quadrature). Assuming Eq. (2) and that the three branching fractions of the add to unity, we find the results in Table I. The hadronic branching fractions are in good agreement with the current PDG averages, but with substantially reduced uncertainties (which are now dominated by the 3% uncertainty in ). The radiative branching fraction is in good agreement with theoretical expectations and the earlier upper limits set by CLEO II [10] and ARGUS [11]. The uncertainty in this branching fraction is due primarily to the large combinatorial background under the radiative signal, so one can expect that data taken with the new CLEO II.5 detector, which includes a silicon tracker, to reduce this uncertainty further in the near future.
| efficiency ratio | 6% |
| fitting of background | 9% |
| fitting of signal | 13% |
| veto efficiency for (19% on ) | 1% |
| veto efficiency for (2% on ) | 2% |
| 5% |
We gratefully acknowledge the effort of the CESR staff in providing us with excellent luminosity and running conditions. This work was supported by the National Science Foundation, the U.S. Department of Energy, the Heisenberg Foundation, the Alexander von Humboldt Stiftung, Research Corporation, the Natural Sciences and Engineering Research Council of Canada, the A.P. Sloan Foundation, and the Swiss National Science Foundation.
REFERENCES
- [1] See for example, A.N. Kamal and Q.P. Xu, Phys. Lett. B 284, 421 (1992); P.J. O’Donnell and Q.P. Xu, Phys. Lett. B 336, 113 (1994); P. Colangelo, F. De Fazio, and G. Nardulli, Phys. Lett. B 334, 175 (1994); T.M. Aliev et al., Phys. Rev. D 54, 857 (1996); H.G. Dosch and S. Narison, Phys. Lett. B 368, 163 (1996).
- [2] M.B. Wise, Phys. Rev. D 45, R2188 (1992); G. Burdman and J. Donoghue, Phys. Lett. B 280, 287 (1992); H.Y. Cheng et al., Phys. Rev. D 49, 5857 (1994); 55, 5851(E) (1997); R. Casalbuoni et al., Phys. Rept. 281, 145 (1997).
- [3] J. Admundson et al., Phys. Lett. B 296, 415 (1992); P. Cho and H. Georgi, Phys. Lett. B 296, 408 (1992); 300, 410(E) (1993).
- [4] E. Angelos and G. P. Lepage, Phys. Rev. D 45, R3021 (1992).
- [5] Mark I Collaboration, G. Goldhaber et al., Phys. Lett. B 69, 503 (1977).
- [6] Mark II Collaboration, M. W. Coles et al., Phys. Rev. D 26, 2190 (1982).
- [7] JADE Collaboration, W. Bartelt et al., Phys. Lett. B 161, 197 (1985).
- [8] HRS Collaboration, E. H. Low et al., Phys. Lett. B 183, 232 (1987).
- [9] Mark III Collaboration, J. Adler et al., Phys. Lett. B 208, 152 (1988).
- [10] CLEO Collaboration, F. Butler et al., Phys. Rev. Lett. 69, 2041 (1992).
- [11] ARGUS Collaboration, H. Albrecht et al., Z. Phys. C 66, 63 (1995).
- [12] Particle Data Group, R. M. Barnett et al., Phys. Rev. D 54, 1 (1996).
- [13] Inclusion of the charge conjugate reaction is implied throughout this paper.
- [14] Particle Data Group, J.J. Hernández et al., Phys. Lett. B 239, 1 (1990).
- [15] refers to the invariant mass of the particles used to form the candidate.
- [16] CLEO Collaboration, Y. Kubota et al., Nucl. Instrum. Methods Phys. Res., Sect. A 320, 66 (1992).
- [17] CLEO Collaboration, J. Gronberg et al., Phys. Rev. Lett. 75, 3232 (1995).
- [18] The background function used is, , where and are parameters determined by the fit.