Measurement of the Branching Fractions of
Abstract
Using data recorded by the CLEO-II detector at CESR, we report new measurements of the branching fractions for the decays of the charmed baryon into , , , and , all measured relative to . The relative branching fractions are , and respectively.
M. S. Alam,1 S. B. Athar,1 Z. Ling,1 A. H. Mahmood,1 H. Severini,1 S. Timm,1 F. Wappler,1 A. Anastassov,2 J. E. Duboscq,2 D. Fujino,2,***Permanent address: Lawrence Livermore National Laboratory, Livermore, CA 94551. K. K. Gan,2 T. Hart,2 K. Honscheid,2 H. Kagan,2 R. Kass,2 J. Lee,2 M. B. Spencer,2 M. Sung,2 A. Undrus,2,†††Permanent address: BINP, RU-630090 Novosibirsk, Russia. R. Wanke,2 A. Wolf,2 M. M. Zoeller,2 B. Nemati,3 S. J. Richichi,3 W. R. Ross,3 P. Skubic,3 M. Bishai,4 J. Fast,4 J. W. Hinson,4 N. Menon,4 D. H. Miller,4 E. I. Shibata,4 I. P. J. Shipsey,4 M. Yurko,4 L. Gibbons,5 S. Glenn,5 S. D. Johnson,5 Y. Kwon,5,‡‡‡Permanent address: Yonsei University, Seoul 120-749, Korea. S. Roberts,5 E. H. Thorndike,5 C. P. Jessop,6 K. Lingel,6 H. Marsiske,6 M. L. Perl,6 D. Ugolini,6 R. Wang,6 X. Zhou,6 T. E. Coan,7 V. Fadeyev,7 I. Korolkov,7 Y. Maravin,7 I. Narsky,7 V. Shelkov,7 J. Staeck,7 R. Stroynowski,7 I. Volobouev,7 J. Ye,7 M. Artuso,8 A. Efimov,8 M. Goldberg,8 D. He,8 S. Kopp,8 G. C. Moneti,8 R. Mountain,8 S. Schuh,8 T. Skwarnicki,8 S. Stone,8 G. Viehhauser,8 X. Xing,8 J. Bartelt,9 S. E. Csorna,9 V. Jain,9,§§§Permanent address: Brookhaven National Laboratory, Upton, NY 11973. K. W. McLean,9 S. Marka,9 R. Godang,10 K. Kinoshita,10 I. C. Lai,10 P. Pomianowski,10 S. Schrenk,10 G. Bonvicini,11 D. Cinabro,11 R. Greene,11 L. P. Perera,11 G. J. Zhou,11 B. Barish,12 M. Chadha,12 S. Chan,12 G. Eigen,12 J. S. Miller,12 C. O’Grady,12 M. Schmidtler,12 J. Urheim,12 A. J. Weinstein,12 F. Würthwein,12 D. W. Bliss,13 G. Masek,13 H. P. Paar,13 S. Prell,13 V. Sharma,13 D. M. Asner,14 J. Gronberg,14 T. S. Hill,14 D. J. Lange,14 S. Menary,14 R. J. Morrison,14 H. N. Nelson,14 T. K. Nelson,14 C. Qiao,14 J. D. Richman,14 D. Roberts,14 A. Ryd,14 M. S. Witherell,14 R. Balest,15 B. H. Behrens,15 W. T. Ford,15 H. Park,15 J. Roy,15 J. G. Smith,15 J. P. Alexander,16 C. Bebek,16 B. E. Berger,16 K. Berkelman,16 K. Bloom,16 D. G. Cassel,16 H. A. Cho,16 D. S. Crowcroft,16 M. Dickson,16 P. S. Drell,16 K. M. Ecklund,16 R. Ehrlich,16 A. D. Foland,16 P. Gaidarev,16 B. Gittelman,16 S. W. Gray,16 D. L. Hartill,16 B. K. Heltsley,16 P. I. Hopman,16 J. Kandaswamy,16 P. C. Kim,16 D. L. Kreinick,16 T. Lee,16 Y. Liu,16 G. S. Ludwig,16 N. B. Mistry,16 C. R. Ng,16 E. Nordberg,16 M. Ogg,16,¶¶¶Permanent address: University of Texas, Austin TX 78712 J. R. Patterson,16 D. Peterson,16 D. Riley,16 A. Soffer,16 B. Valant-Spaight,16 C. Ward,16 M. Athanas,17 P. Avery,17 C. D. Jones,17 M. Lohner,17 C. Prescott,17 J. Yelton,17 J. Zheng,17 G. Brandenburg,18 R. A. Briere,18 A. Ershov,18 Y. S. Gao,18 D. Y.-J. Kim,18 R. Wilson,18 H. Yamamoto,18 T. E. Browder,19 F. Li,19 Y. Li,19 J. L. Rodriguez,19 T. Bergfeld,20 B. I. Eisenstein,20 J. Ernst,20 G. E. Gladding,20 G. D. Gollin,20 R. M. Hans,20 E. Johnson,20 I. Karliner,20 M. A. Marsh,20 M. Palmer,20 M. Selen,20 J. J. Thaler,20 K. W. Edwards,21 A. Bellerive,22 R. Janicek,22 D. B. MacFarlane,22 P. M. Patel,22 A. J. Sadoff,23 R. Ammar,24 P. Baringer,24 A. Bean,24 D. Besson,24 D. Coppage,24 C. Darling,24 R. Davis,24 N. Hancock,24 S. Kotov,24 I. Kravchenko,24 N. Kwak,24 S. Anderson,25 Y. Kubota,25 S. J. Lee,25 J. J. O’Neill,25 S. Patton,25 R. Poling,25 T. Riehle,25 V. Savinov,25 and A. Smith25
1State University of New York at Albany, Albany, New York 12222
2Ohio State University, Columbus, Ohio 43210
3University of Oklahoma, Norman, Oklahoma 73019
4Purdue University, West Lafayette, Indiana 47907
5University of Rochester, Rochester, New York 14627
6Stanford Linear Accelerator Center, Stanford University, Stanford, California 94309
7Southern Methodist University, Dallas, Texas 75275
8Syracuse University, Syracuse, New York 13244
9Vanderbilt University, Nashville, Tennessee 37235
10Virginia Polytechnic Institute and State University, Blacksburg, Virginia 24061
11Wayne State University, Detroit, Michigan 48202
12California Institute of Technology, Pasadena, California 91125
13University of California, San Diego, La Jolla, California 92093
14University of California, Santa Barbara, California 93106
15University of Colorado, Boulder, Colorado 80309-0390
16Cornell University, Ithaca, New York 14853
17University of Florida, Gainesville, Florida 32611
18Harvard University, Cambridge, Massachusetts 02138
19University of Hawaii at Manoa, Honolulu, Hawaii 96822
20University of Illinois, Champaign-Urbana, Illinois 61801
21Carleton University, Ottawa, Ontario, Canada K1S 5B6
and the Institute of Particle Physics, Canada
22McGill University, Montréal, Québec, Canada H3A 2T8
and the Institute of Particle Physics, Canada
23Ithaca College, Ithaca, New York 14850
24University of Kansas, Lawrence, Kansas 66045
25University of Minnesota, Minneapolis, Minnesota 55455
Since the first observation of the lowest lying charmed baryon, the , there have been many measurements made of its exclusive decay channels. As it is difficult to measure the production cross-section of the baryons, decay rates are typically presented as branching ratios relative to , the most easily observed decay channel. However, fewer than half of the hadronic decays are presently accounted for. Measurement of these modes is of practical as well as theoretical interest. Here, we present measurements of the branching fractions of into , , , and , all relative to . The last of these is the first measurement of this mode. The other modes have been previously measured but with considerably larger uncertainties than in the present study.
The data presented here were taken by the CLEO II detector[1] operating at the Cornell Electron Storage Ring. The sample used in this analysis corresponds to an integrated luminosity of 4.8 from data taken on the resonance and in the continuum at energies just above and below the . We detected charged tracks with a cylindrical drift chamber system inside a solenoidal magnet. Photons were detected using an electromagnetic calorimeter consisting of 7800 cesium iodide crystals.
Particle identification of , and candidates was performed using specific ionization measurements in the drift chamber, and when present, time-of-flight measurements. For each mass hypothesis, a combined probability was formed (). Using these probablilities, a normalized probability ratio was evaluated, where . Well identified protons peaked near while tracks that were identified to not be protons peak near . For a track to be used as a proton in this study, we required it to have , which eliminated much of the background, though with considerable diminution of efficiency. For kaons we applied a looser and more efficient cut of . We have chosen these cuts using a Monte Carlo simulation program to maximize the significance of the signals. The proton identification requirement resulted in an efficiency that is strongly momentum dependent, whereas the kaon identification is rather efficient at all momenta. In order to reduce the large combinatoric background, we required , where is the scaled momentum of the candidate. Approximately 60% of baryons from continuum events passed this requirement.
The candidates were identified in their decay , by reconstructing a secondary vertex from the intersection of two oppositely charged tracks in the plane. The invariant mass of the candidate must lie within 9 (around 3 standard deviations () of its nominal value.
The candidates were selected through their decay from pairs of well-defined showers in the CsI calorimeter with a reconstructed invariant mass within of the mass. In order to reduce the combinatorial background, each was required to have an energy of at least 50 MeV, and the was required to have a momentum of at least .
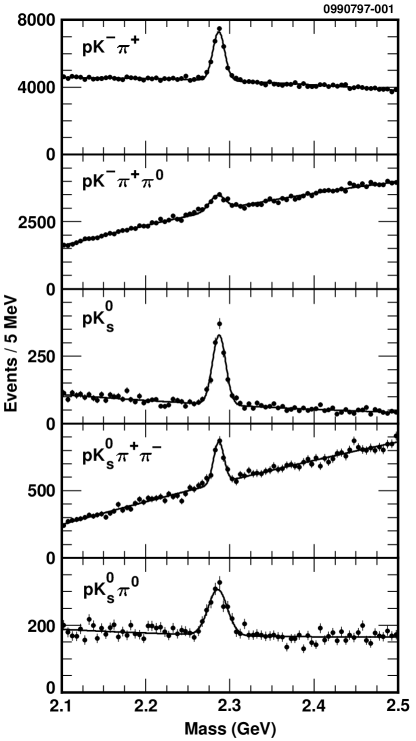
The resulting mass distributions for the 5 modes are shown in Figure 1. Each peak was fit to the sum of a Gaussian signal distribution with width fixed to that obtained from CLEO’s GEANT based Monte Carlo simulation program, and a second order polynomial background distribution. The signal widths used and the resulting signal yields are tabulated in Table 1.
| Mode | MC Width (MeV) | Signal |
|---|---|---|
| 16 | ||
| 22 | ||
| 19 | ||
| 15 | ||
| 27 |
The efficiency for each mode was calculated using the Monte Carlo simulation program[2]. The particle identification efficiency was checked using real data from and decays that were identified topologically. The reconstruction efficiency of the decays has some dependence on the resonant substructure of these states. In the case of the mode, the Monte-Carlo generator produced a mixture of non-resonant three-body decay together with and decays, according to their measured branching fractions[3]. These three types of decays had slightly different reconstruction efficiencies, so that including the substructure changes the efficiency by relative to 3-body phase space. We have also investigated the dependence of the reconstruction efficiency of the other modes on possible resonant substructure. The poor signal to background ratio did not allow a detailed measurement of the substructure of these modes. The efficiency calculation took into account the and branching fractions.
We have considered many possible sources of systematic error in the measurement. The main contributors to the systematic uncertainty came from the following sources: 1) Uncertainties in the fitting procedures, which were estimated by looking at the changes in the yields using different orders of polynomial background and different signal widths (15% in the case of , but much smaller for the other modes), 2) uncertainties due to the unknown mix of resonant substructure in the multi-body decays (up to 3% depending on the mode), 3) uncertainties due to finding (5%), finding (5%) and track finding (1%), and 4) uncertainties in the reconstruction efficiency due to the particle identification criteria for protons and kaons (4%). These uncertainties have been added in quadrature to obtain the total systematic uncertainty for each mode, taking into account the fact that many of these tend to cancel in a measurement of ratios of branching fractions.
There are three main types of quark decay diagrams that contribute to decays. The simplest method is the simple spectator diagram in which the virtual fragments independently of the spectator quark. The second method involves the quark daughters of the combining with the remaining quarks. The third method, W-exchange, involves the combining with the initial quark. Unfortunately all the decay modes under investigation here can proceed by more than one of these decay diagrams, and their decay rates are not amenable to calculation.
In conclusion, we have measured new branching fractions of the into 4 decay modes, measured relative to the normalizing mode . The results for three of these modes are in agreement with, and more accurate than, previous measurements. We have made the first measurement of the decay rate of . These measurements help account for the total width of the and increase the understanding of charmed baryon decays.
| Mode | Relative Efficiency | Previous Measurements | |
|---|---|---|---|
| 1.0 | 1.0 | ||
| 0.383 | [5] | ||
| 0.218 | [4] | ||
| [6] | |||
| [7] | |||
| 0.187 | [4] | ||
| [5] | |||
| 0.115 |
REFERENCES
- [1] Y. Kubota et al., Nucl. Inst. and Methods A320, 66 (1992).
- [2] R. Brun et al., CERN/DD/EE/84-11.
- [3] Review of Particle Properties, R. Barnett et al., Phys. Rev. D54 1 (1996).
- [4] P. Avery et al., Phys. Rev. D43, 3499 (1991)
- [5] S. Barlag et al., Z. Phys. C48, 29 (1990).
- [6] J. Anjos et al., Phys. Rev. D41, 801 (1990).
- [7] H. Albrecht et al., Phys. Lett. B207, 109 (1988).