Production in Deep Inelastic Scattering
at HERA
This paper presents measurements of production in deep inelastic scattering from collisions between 27.5 GeV positrons and 820 GeV protons. The data have been taken with the ZEUS detector at HERA. The decay channel (+ c.c.) has been used in the study. The cross section for inclusive production with GeV2 and is 5.3 1.0 0.8 nb in the kinematic region GeV and . Differential cross sections as functions of (), (), and are compared with next-to-leading order QCD calculations based on the photon-gluon fusion production mechanism. After an extrapolation of the cross section to the full kinematic region in () and (), the charm contribution to the proton structure function is determined for Bjorken between 2 10-4 and 5 10-3.
The ZEUS Collaboration
J. Breitweg,
M. Derrick,
D. Krakauer,
S. Magill,
D. Mikunas,
B. Musgrave,
J. Repond,
R. Stanek,
R.L. Talaga,
R. Yoshida,
H. Zhang
Argonne National Laboratory, Argonne, IL, USA p
M.C.K. Mattingly
Andrews University, Berrien Springs, MI, USA
F. Anselmo,
P. Antonioli, G. Bari,
M. Basile,
L. Bellagamba,
D. Boscherini,
A. Bruni,
G. Bruni,
G. Cara Romeo,
G. Castellini1,
L. Cifarelli2,
F. Cindolo,
A. Contin,
M. Corradi,
S. De Pasquale,
I. Gialas3,
P. Giusti,
G. Iacobucci,
G. Laurenti,
G. Levi,
A. Margotti,
T. Massam,
R. Nania,
F. Palmonari,
A. Pesci,
A. Polini,
G. Sartorelli,
Y. Zamora Garcia4,
A. Zichichi
University and INFN Bologna, Bologna, Italy f
C. Amelung,
A. Bornheim,
I. Brock,
K. Coböken,
J. Crittenden,
R. Deffner,
M. Eckert,
L. Feld5,
M. Grothe,
H. Hartmann,
K. Heinloth,
L. Heinz,
E. Hilger,
H.-P. Jakob,
U.F. Katz,
E. Paul,
M. Pfeiffer,
Ch. Rembser,
J. Stamm,
R. Wedemeyer6
Physikalisches Institut der Universität Bonn,
Bonn, Germany c
D.S. Bailey,
S. Campbell-Robson,
W.N. Cottingham,
B. Foster,
R. Hall-Wilton,
M.E. Hayes,
G.P. Heath,
H.F. Heath,
D. Piccioni,
D.G. Roff,
R.J. Tapper
H.H. Wills Physics Laboratory, University of Bristol,
Bristol, U.K. o
M. Arneodo7,
R. Ayad,
M. Capua,
A. Garfagnini,
L. Iannotti,
M. Schioppa,
G. Susinno
Calabria University,
Physics Dept.and INFN, Cosenza, Italy f
J.Y. Kim,
J.H. Lee,
I.T. Lim,
M.Y. Pac8
Chonnam National University, Kwangju, Korea h
A. Caldwell9,
N. Cartiglia,
Z. Jing,
W. Liu,
J.A. Parsons,
S. Ritz10,
S. Sampson,
F. Sciulli,
P.B. Straub,
Q. Zhu
Columbia University, Nevis Labs.,
Irvington on Hudson, N.Y., USA q
P. Borzemski,
J. Chwastowski,
A. Eskreys,
Z. Jakubowski,
M.B. Przybycień,
M. Zachara,
L. Zawiejski
Inst. of Nuclear Physics, Cracow, Poland j
L. Adamczyk,
B. Bednarek,
K. Jeleń,
D. Kisielewska,
T. Kowalski,
M. Przybycień,
E. Rulikowska-Zarȩbska,
L. Suszycki,
J. Zaja̧c
Faculty of Physics and Nuclear Techniques,
Academy of Mining and Metallurgy, Cracow, Poland j
Z. Duliński,
A. Kotański
Jagellonian Univ., Dept. of Physics, Cracow, Poland k
G. Abbiendi11,
L.A.T. Bauerdick,
U. Behrens,
H. Beier,
J.K. Bienlein,
G. Cases12,
O. Deppe,
K. Desler,
G. Drews,
U. Fricke,
D.J. Gilkinson,
C. Glasman,
P. Göttlicher,
J. Große-Knetter,
T. Haas,
W. Hain,
D. Hasell,
K.F. Johnson13,
M. Kasemann,
W. Koch,
U. Kötz,
H. Kowalski,
J. Labs,
L. Lindemann,
B. Löhr,
M. Löwe14,
O. Mańczak,
J. Milewski,
T. Monteiro15,
J.S.T. Ng16,
D. Notz,
K. Ohrenberg17,
I.H. Park18,
A. Pellegrino,
F. Pelucchi,
K. Piotrzkowski,
M. Roco19,
M. Rohde,
J. Roldán,
J.J. Ryan,
A.A. Savin,
U. Schneekloth,
F. Selonke,
B. Surrow,
E. Tassi,
T. Voß20,
D. Westphal,
G. Wolf,
U. Wollmer21,
C. Youngman,
A.F. Żarnecki,
W. Zeuner
Deutsches Elektronen-Synchrotron DESY, Hamburg, Germany
B.D. Burow, H.J. Grabosch,
A. Meyer,
S. Schlenstedt
DESY-IfH Zeuthen, Zeuthen, Germany
G. Barbagli,
E. Gallo,
P. Pelfer
University and INFN, Florence, Italy f
G. Maccarrone,
L. Votano
INFN, Laboratori Nazionali di Frascati, Frascati, Italy f
A. Bamberger,
S. Eisenhardt,
P. Markun,
T. Trefzger22,
S. Wölfle
Fakultät für Physik der Universität Freiburg i.Br.,
Freiburg i.Br., Germany c
J.T. Bromley,
N.H. Brook,
P.J. Bussey,
A.T. Doyle,
D.H. Saxon,
L.E. Sinclair,
E. Strickland,
M.L. Utley23,
R. Waugh,
A.S. Wilson
Dept. of Physics and Astronomy, University of Glasgow,
Glasgow, U.K. o
I. Bohnet,
N. Gendner, U. Holm,
A. Meyer-Larsen,
H. Salehi,
K. Wick
Hamburg University, I. Institute of Exp. Physics, Hamburg,
Germany c
L.K. Gladilin24,
D. Horstmann,
D. Kçira,
R. Klanner, E. Lohrmann,
G. Poelz,
W. Schott25,
F. Zetsche
Hamburg University, II. Institute of Exp. Physics, Hamburg,
Germany c
T.C. Bacon,
I. Butterworth,
J.E. Cole,
V.L. Harris,
G. Howell,
B.H.Y. Hung,
L. Lamberti26,
K.R. Long,
D.B. Miller,
N. Pavel,
A. Prinias27,
J.K. Sedgbeer,
D. Sideris,
A.F. Whitfield28
Imperial College London, High Energy Nuclear Physics Group,
London, U.K. o
U. Mallik,
S.M. Wang,
J.T. Wu
University of Iowa, Physics and Astronomy Dept.,
Iowa City, USA p
P. Cloth,
D. Filges
Forschungszentrum Jülich, Institut für Kernphysik,
Jülich, Germany
J.I. Fleck29,
T. Ishii,
M. Kuze,
M. Nakao,
K. Tokushuku,
S. Yamada,
Y. Yamazaki30
Institute of Particle and Nuclear Studies, KEK,
Tsukuba, Japan g
S.H. An,
S.B. Lee,
S.W. Nam31,
H.S. Park,
S.K. Park
Korea University, Seoul, Korea h
F. Barreiro,
J.P. Fernández,
G. García,
R. Graciani,
J.M. Hernández,
L. Hervás,
L. Labarga,
M. Martínez, J. del Peso,
J. Puga,
J. Terrón,
J.F. de Trocóniz
Univer. Autónoma Madrid,
Depto de Física Teóríca, Madrid, Spain n
F. Corriveau,
D.S. Hanna,
J. Hartmann,
L.W. Hung,
J.N. Lim,
W.N. Murray,
A. Ochs,
M. Riveline,
D.G. Stairs,
M. St-Laurent,
R. Ullmann
McGill University, Dept. of Physics,
Montréal, Québec, Canada b
T. Tsurugai
Meiji Gakuin University, Faculty of General Education, Yokohama, Japan
V. Bashkirov,
B.A. Dolgoshein,
A. Stifutkin
Moscow Engineering Physics Institute, Mosocw, Russia l
G.L. Bashindzhagyan,
P.F. Ermolov,
Yu.A. Golubkov,
L.A. Khein,
N.A. Korotkova,
I.A. Korzhavina,
V.A. Kuzmin,
O.Yu. Lukina,
A.S. Proskuryakov,
L.M. Shcheglova,
A.V. Shumilin,
A.N. Solomin,
S.A. Zotkin
Moscow State University, Institute of Nuclear Physics,
Moscow, Russia m
C. Bokel, M. Botje,
N. Brümmer,
F. Chlebana19,
J. Engelen,
P. Kooijman,
A. Kruse,
A. van Sighem,
H. Tiecke,
W. Verkerke,
J. Vossebeld,
M. Vreeswijk,
L. Wiggers,
E. de Wolf
NIKHEF and University of Amsterdam, Netherlands i
D. Acosta,
B. Bylsma,
L.S. Durkin,
J. Gilmore,
C.M. Ginsburg,
C.L. Kim,
T.Y. Ling,
P. Nylander,
T.A. Romanowski32
Ohio State University, Physics Department,
Columbus, Ohio, USA p
H.E. Blaikley,
R.J. Cashmore,
A.M. Cooper-Sarkar,
R.C.E. Devenish,
J.K. Edmonds,
N. Harnew,
M. Lancaster33,
J.D. McFall,
C. Nath,
V.A. Noyes27,
A. Quadt,
O. Ruske,
J.R. Tickner,
H. Uijterwaal,
R. Walczak,
D.S. Waters
Department of Physics, University of Oxford,
Oxford, U.K. o
A. Bertolin,
R. Brugnera,
R. Carlin,
F. Dal Corso,
U. Dosselli,
S. Limentani,
M. Morandin,
M. Posocco,
L. Stanco,
R. Stroili,
C. Voci
Dipartimento di Fisica dell’ Universita and INFN,
Padova, Italy f
J. Bulmahn,
R.G. Feild34,
B.Y. Oh,
J.R. Okrasiński,
J.J. Whitmore
Pennsylvania State University, Dept. of Physics,
University Park, PA, USA q
Y. Iga
Polytechnic University, Sagamihara, Japan g
G. D’Agostini,
G. Marini,
A. Nigro,
M. Raso
Dipartimento di Fisica, Univ. ’La Sapienza’ and INFN,
Rome, Italy
J.C. Hart,
N.A. McCubbin,
T.P. Shah
Rutherford Appleton Laboratory, Chilton, Didcot, Oxon,
U.K. o
E. Barberis33,
T. Dubbs,
C. Heusch,
M. Van Hook,
W. Lockman,
J.T. Rahn,
H.F.-W. Sadrozinski,
A. Seiden,
D.C. Williams
University of California, Santa Cruz, CA, USA p
O. Schwarzer,
A.H. Walenta
Fachbereich Physik der Universität-Gesamthochschule
Siegen, Germany c
H. Abramowicz,
G. Briskin,
S. Dagan35,
T. Doeker,
S. Kananov,
A. Levy36
Raymond and Beverly Sackler Faculty of Exact Sciences,
School of Physics, Tel-Aviv University,
Tel-Aviv, Israel e
T. Abe,
T. Fusayasu, M. Inuzuka,
K. Nagano,
I. Suzuki,
K. Umemori,
T. Yamashita
Department of Physics, University of Tokyo,
Tokyo, Japan g
R. Hamatsu,
T. Hirose,
K. Homma,
S. Kitamura37,
T. Matsushita,
K. Yamauchi
Tokyo Metropolitan University, Dept. of Physics,
Tokyo, Japan g
R. Cirio,
M. Costa,
M.I. Ferrero,
S. Maselli,
V. Monaco,
C. Peroni,
M.C. Petrucci,
R. Sacchi,
A. Solano,
A. Staiano
Universita di Torino, Dipartimento di Fisica Sperimentale
and INFN, Torino, Italy f
M. Dardo
II Faculty of Sciences, Torino University and INFN -
Alessandria, Italy f
D.C. Bailey,
M. Brkic,
C.-P. Fagerstroem,
G.F. Hartner,
K.K. Joo,
G.M. Levman,
J.F. Martin,
R.S. Orr,
S. Polenz,
C.R. Sampson,
D. Simmons,
R.J. Teuscher29
University of Toronto, Dept. of Physics, Toronto, Ont.,
Canada a
J.M. Butterworth, C.D. Catterall,
T.W. Jones,
P.B. Kaziewicz,
J.B. Lane,
R.L. Saunders,
J. Shulman,
M.R. Sutton
University College London, Physics and Astronomy Dept.,
London, U.K. o
B. Lu,
L.W. Mo
Virginia Polytechnic Inst. and State University, Physics Dept.,
Blacksburg, VA, USA q
J. Ciborowski,
G. Grzelak38,
M. Kasprzak,
K. Muchorowski39,
R.J. Nowak,
J.M. Pawlak,
R. Pawlak,
T. Tymieniecka,
A.K. Wróblewski,
J.A. Zakrzewski
Warsaw University, Institute of Experimental Physics,
Warsaw, Poland j
M. Adamus
Institute for Nuclear Studies, Warsaw, Poland j
C. Coldewey,
Y. Eisenberg35,
D. Hochman,
U. Karshon35,
D. Revel35
Weizmann Institute, Nuclear Physics Dept., Rehovot,
Israel d
W.F. Badgett,
D. Chapin,
R. Cross,
S. Dasu,
C. Foudas,
R.J. Loveless,
S. Mattingly,
D.D. Reeder,
W.H. Smith,
A. Vaiciulis,
M. Wodarczyk
University of Wisconsin, Dept. of Physics,
Madison, WI, USA p
S. Bhadra,
W.R. Frisken,
M. Khakzad,
W.B. Schmidke
York University, Dept. of Physics, North York, Ont.,
Canada a
1 also at IROE Florence, Italy
2 now at Univ. of Salerno and INFN Napoli, Italy
3 now at Univ. of Crete, Greece
4 supported by Worldlab, Lausanne, Switzerland
5 now OPAL
6 retired
7 also at University of Torino and Alexander von Humboldt
Fellow at University of Hamburg
8 now at Dongshin University, Naju, Korea
9 also at DESY and Alexander von
Humboldt Fellow
10 Alfred P. Sloan Foundation Fellow
11 supported by an EC fellowship
number ERBFMBICT 950172
12 now at SAP A.G., Walldorf
13 visitor from Florida State University
14 now at ALCATEL Mobile Communication GmbH, Stuttgart
15 supported by European Community Program PRAXIS XXI
16 now at DESY-Group FDET
17 now at DESY Computer Center
18 visitor from Kyungpook National University, Taegu,
Korea, partially supported by DESY
19 now at Fermi National Accelerator Laboratory (FNAL),
Batavia, IL, USA
20 now at NORCOM Infosystems, Hamburg
21 now at Oxford University, supported by DAAD fellowship
HSP II-AUFE III
22 now at ATLAS Collaboration, Univ. of Munich
23 now at Clinical Operational Research Unit,
University College, London
24 on leave from MSU, supported by the GIF,
contract I-0444-176.07/95
25 now a self-employed consultant
26 supported by an EC fellowship
27 PPARC Post-doctoral Fellow
28 now at Conduit Communications Ltd., London, U.K.
29 now at CERN
30 supported by JSPS Postdoctoral Fellowships for Research
Abroad
31 now at Wayne State University, Detroit
32 now at Department of Energy, Washington
33 now at Lawrence Berkeley Laboratory, Berkeley
34 now at Yale University, New Haven, CT
35 supported by a MINERVA Fellowship
36 partially supported by DESY
37 present address: Tokyo Metropolitan College of
Allied Medical Sciences, Tokyo 116, Japan
38 supported by the Polish State
Committee for Scientific Research, grant No. 2P03B09308
39 supported by the Polish State
Committee for Scientific Research, grant No. 2P03B09208
| a | supported by the Natural Sciences and Engineering Research Council of Canada (NSERC) |
|---|---|
| b | supported by the FCAR of Québec, Canada |
| c | supported by the German Federal Ministry for Education and Science, Research and Technology (BMBF), under contract numbers 057BN19P, 057FR19P, 057HH19P, 057HH29P, 057SI75I |
| d | supported by the MINERVA Gesellschaft für Forschung GmbH, the German Israeli Foundation, and the U.S.-Israel Binational Science Foundation |
| e | supported by the German Israeli Foundation, and by the Israel Science Foundation |
| f | supported by the Italian National Institute for Nuclear Physics (INFN) |
| g | supported by the Japanese Ministry of Education, Science and Culture (the Monbusho) and its grants for Scientific Research |
| h | supported by the Korean Ministry of Education and Korea Science and Engineering Foundation |
| i | supported by the Netherlands Foundation for Research on Matter (FOM) |
| j | supported by the Polish State Committee for Scientific Research, grant No. 115/E-343/SPUB/P03/120/96 |
| k | supported by the Polish State Committee for Scientific Research (grant No. 2 P03B 083 08) and Foundation for Polish-German Collaboration |
| l | partially supported by the German Federal Ministry for Education and Science, Research and Technology (BMBF) |
| m | supported by the German Federal Ministry for Education and Science, Research and Technology (BMBF), and the Fund of Fundamental Research of Russian Ministry of Science and Education and by INTAS-Grant No. 93-63 |
| n | supported by the Spanish Ministry of Education and Science through funds provided by CICYT |
| o | supported by the Particle Physics and Astronomy Research Council |
| p | supported by the US Department of Energy |
| q | supported by the US National Science Foundation |
1 Introduction
In neutral current deep inelastic scattering (DIS), , charmed quarks are expected to be produced predominantly via the photon-gluon fusion (PGF) process which couples the virtual photon to a gluon of the proton. The leading order (LO) diagram is shown in Fig. 1a.
Recently, analytic calculations of the DIS charm cross section from photon-gluon coupling have become available [1], which relate the DIS charm cross section to the gluon distribution in the proton using next-to-leading order (NLO) QCD.
Measurements of deep inelastic neutral current scattering at HERA have demonstrated a rapid rise of the proton structure function as Bjorken- decreases below [2]. A QCD analysis of these data has connected this rise to an increase of the gluon momentum density in the proton with a dependence with at GeV2 [3, 4]. At HERA, the DIS charm cross section is sensitive to the gluon distribution of the proton at low fractional momentum () of the proton. Comparison of the DIS charm cross section with NLO QCD calculations allows an independent check of the increase of the gluon momentum density, testing the consistency of the QCD calculations.
The other processes, apart from PGF, that contribute to open charm production in DIS are: diffractive heavy flavour production [5], scattering of the virtual photon off the charm sea quark [6], charmed hadron production from [7] and production of in fragmentation [8]. These processes, however, are expected to have much smaller cross sections than PGF. The possible contribution from intrinsic charm [9, 6] is outside the acceptance of the main detector.
ZEUS [10, 11] and H1 [12] have reported on production111In this paper charge conjugate modes are always implied. always refers to both and the charge conjugate mode (c.c.) . by quasi-real photons at HERA (i.e. in the photoproduction regime). In [10] first signals in the DIS regime were also shown.
In this paper a detailed study of the produced in DIS events is presented. are investigated in the decay channel
| (1) |
using a procedure first proposed in [13], where stands for the ‘soft pion’.
The cross section for inclusive production and differential cross sections as functions of (), (), and are presented. The measurements are compared with LO and NLO QCD analytic calculations [1] based on the photon-gluon fusion production mechanism. By extrapolation, the charm contribution to the proton structure function , , is estimated and compared with the NLO QCD analytic calculations. A similar analysis has been recently presented by the H1 Collaboration [14].
2 Experimental setup
The data were collected at the positron-proton collider HERA using the ZEUS detector during the 1994 running period. HERA collided 27.5 GeV positrons with 820 GeV protons yielding a center-of-mass energy of 300 GeV. 153 bunches were filled for each beam, and, in addition, 15 positron and 17 proton bunches were left unpaired for background studies. The r.m.s. of the vertex position distribution in the direction222The ZEUS coordinate system is defined as right-handed with the axis pointing in the proton beam direction and the axis horizontal pointing towards the center of HERA. The polar angle is defined with respect to the positive direction. is 12 cm. The data used in this analysis come from an integrated luminosity of 2.95 pb-1.
ZEUS is a multipurpose detector which has been described in detail elsewhere [15]. The key component for this analysis is the central tracking detector (CTD) which operates in a magnetic field of 1.43 T provided by a thin superconducting solenoid. The CTD is a cylindrical drift chamber consisting of 72 layers organized into 9 “superlayers” covering the polar angular region [16]. Five of the superlayers have wires parallel (axial) to the beam axis and four have wires inclined at a small angle to give a stereo view. The spatial resolution in the drift direction is 190 m. The interaction vertex is measured with a resolution of 0.4 cm in the direction and 0.1 cm in the plane. The momentum resolution for tracks traversing all 9 superlayers is ( in GeV).
The solenoid is surrounded by a high resolution uranium-scintillator calorimeter (CAL) described elsewhere [17]. The position of positrons scattered close to the positron beam direction is determined by a scintillator strip detector (SRTD) [18]. The luminosity is measured via the Bethe-Heitler process, , where the photon is tagged using a lead-scintillator calorimeter [19] located at m in the HERA tunnel.
3 HERA kinematics
The kinematics of deep inelastic scattering processes at HERA, , where is the hadronic final state, can be described by the Lorentz invariant variables , and . Here is the square of the four-momentum transfer at the lepton vertex, is the Bjorken variable and is the fractional energy transfer between the positron and the proton in the proton rest frame. In the absence of QED radiation, and , where and are the four-momenta of the incoming particles and is the four-momentum of the scattered positron. The variables are related by , where is the squared invariant mass of the system. Since the ZEUS detector is nearly hermetic, for neutral current DIS , and can be calculated from the kinematic variables of the scattered positron, from the hadronic final state variables, or from a combination of both. In this paper we use the double angle method (DA) [20] to calculate the , , variables. The center-of-mass energy of the virtual photon-proton system (), , is determined using being the proton mass. The variable , determined using the energy and angle of the scattered positron, , is used for background suppression. The use of the positron information alone to calculate , and is used in the study of the systematic uncertainties.
Using the calorimeter information the quantity is measured, where is the energy and the longitudinal momentum assigned to the calorimeter cell . For perfect detector resolution and acceptance, GeV for DIS events while for photoproduction events and events with hard initial state radiation, where the scattered positron or the radiated photon escapes down the beam pipe, peaks at lower values.
4 DIS event selection
4.1 Trigger selection
The trigger selection is almost identical to that used for the measurement of the structure function [21]. Events are filtered online by a three level trigger system [22]. At the first level DIS events are selected by requiring a minimum energy deposition in the electromagnetic section of the CAL. The threshold depends on the position in the CAL and varies between 3.4 and 4.8 GeV. At the second level trigger (SLT), beam-gas background is further reduced using the measured times of energy deposits and the summed energies from the calorimeter. The events are accepted if calculated at the SLT level using the nominal vertex position satisfies where is the energy deposit measured in the luminosity photon calorimeter.
The full event information is available at the third level trigger (TLT). Tighter timing cuts as well as algorithms to remove beam halo muons and cosmic muons are applied. The quantity is determined in the same manner as for . The events are required to have . Finally, events are accepted as DIS candidates if a scattered positron candidate of energy greater than 4 GeV is found. For events with the scattered positron detected in the calorimeter, the trigger acceptance is essentially independent of the DIS hadronic final state. It is greater than 90% for 5 GeV2 (lower limit for the DIS sample in this analysis) and increases to 99 % for 10 GeV2 as determined from MC simulation.
4.2 Offline event selection
The selection of DIS events is similar to that described in our earlier publication [21]. The characteristic signature of a DIS event is the scattered positron detected in the uranium scintillator calorimeter. The positron identification algorithm is based on a neural network using information from the CAL and is described elsewhere [23]. The efficiency for finding the scattered positron is sensitive to details of the shower evolution, in particular to energy loss in the material between the interaction point and the calorimeter. The efficiency of the identification algorithm when the scattered positron has an energy of 8 GeV is , rising to 99 for energies above 15 GeV. For the present data, 89 of the events have an energy greater than 15 GeV. The impact position of the positrons is determined by either the position reconstructed by the CAL or by the SRTD if inside its fiducial volume. The resolution of the impact position is about 1 cm for the CAL and 0.3 cm for the SRTD. The positron traverses varying amounts of material in the detector before entering the CAL, which causes a variable energy loss. This energy loss is corrected on an event by event basis, as explained in [18]. The scale uncertainty on the energy of the scattered positron after these corrections is 2 % at 10 GeV linearly decreasing to 1 % at 27.5 GeV.
The following criteria are used to select DIS events: the presence of a scattered positron candidate with a corrected energy GeV, and 35 GeV to remove photoproduction events and to suppress events with hard initial state radiation. After applying these criteria, events are retained. For this analysis the region 5100 GeV2 and is selected which contains events. A subsample of DIS events in the () plane is plotted in Fig. 1b. The lines of constant and delimiting the region chosen for this study are shown. The photoproduction contamination is less than 2% and the beam gas background is negligible.
4.3 Event selection efficiency
The efficiencies of the event selection and the reconstruction are determined using a GEANT [24] based Monte Carlo (MC) simulation program which incorporates the knowledge of the detector and the trigger. For this analysis two different types of event generators were used: neutral current (NC) DIS generators, discussed below, for event selection efficiency calculations and heavy flavour generators, discussed in section 5.2, for reconstruction efficiency estimates.
Neutral current DIS events with GeV2 were generated using the HERACLES 4.4 program [25] which incorporates first order electroweak corrections. It was interfaced using DJANGO 6.1-2 [26] to either LEPTO 6.1-3 [27] or ARIADNE 4.03 [28] for the simulation of QCD cascades. The calculation of the zeroth and first order matrix elements plus the parton shower option (MEPS) was used in LEPTO. The latter includes coherence effects in the final state cascade via angular ordering of successive parton emissions. In ARIADNE, the colour-dipole model including the photon-gluon fusion process (CDMBGF) was used. In this model coherence effects were implicitly included in the formalism of the parton cascade. The Lund string fragmentation [29], as implemented in JETSET 7.4 [30], was used for the hadronisation phase.
The GRV-HO [31] parameterisation was used for the MEPS data set. For the CDMBGF event sample the MRSD [32] parton density parameterisation for the proton was used. These parameterisations describe the HERA measurements of the proton structure function F2 [4, 21, 2] reasonably well.
Monte Carlo samples of DIS events containing mesons (all decay modes) corresponding to 5.5 pb-1 were generated. The CDMBGF sample was used for cross section determinations and the MEPS sample for systematic studies. The efficiency for selecting DIS events where a has been produced is determined as a function of and . For the kinematic region selected, an average event selection efficiency of 75% is found, increasing from about 60 % to 90 % as increases from 5 to 100 GeV2 and from about 65 % to 85 % as increases from 0 to 0.7.
5 Reconstruction
The tracks of charged particles are reconstructed using the CTD. The single hit efficiency of the chamber is greater than 95%. The efficiency for assigning hits to tracks depends on several factors, for example the of the track and the number of nearby charged particles. In addition the 45∘ inclination of the drift cells, which compensates for the Lorentz angle, introduces some asymmetry in the chamber response for positive and negative particles, particularly at low . The reconstructed tracks used are required to have more than 20 hits, a transverse momentum 0.125 GeV and a polar angle between . In terms of pseudorapidity, , this angle corresponds to . This is the region where the tracking detector response and systematics are sufficiently understood. For those tracks with 0.125 GeV and the track reconstruction efficiency is greater than 94%.
5.1 Identification
production is investigated in the decay channel (1). The tight kinematic constraint on the decay limits the momentum of the decay products to just 40 MeV in the rest frame. This fact allows one to measure the mass difference more accurately than the measurement of the mass itself. In practice it leads to a prominent signal in the distribution, in an otherwise highly suppressed region of phase space.
The reconstruction procedure consists of two steps. First a pre-candidate is formed by taking all combinations of pairs of oppositely charged tracks and assuming each track in turn to correspond to a kaon or a pion. If the invariant mass of the track combination lies between 1.4 and 2.5 GeV, the track pair is considered to be a pre-candidate. In the second step this pre-candidate is combined with a third track, which has the sign of charge opposite to that of the kaon candidate. The third track is assumed to be a pion (the so called soft pion, ). If the mass difference, , is below 180 MeV, the three tracks form a pre-candidate.
To reduce the combinatorial background and restrict the analysis to a kinematic region where the detector reconstruction efficiency is acceptable, the following requirements are applied:
-
•
The spatial resolution of the CTD does not allow the decay vertex to be distinguished from the primary vertex. Therefore, we require all tracks to be associated with the reconstructed primary vertex of the event.
-
•
The kaon and pion candidates from the decay must have transverse momenta greater than 0.4 GeV. This reduces the combinatorial background in the reconstruction step.
-
•
pre-candidates must have transverse momenta in the range 1.3 9.0 GeV and directions of flight away from the beams, . The lower limit is due to the very small acceptance for with below 1.3 GeV which results from the ()0.125 GeV cut. The higher limit is due to the lack of statistics. Note that these cuts limit the actual acceptance to .
The analysis is restricted to those combinations (called candidates) which pass the above requirements, have a invariant mass in the range 1.8 1.92 GeV and have a mass difference in the range 143 148 MeV. Fig. 1b shows the distribution of all DIS events which have a candidate in the () plane.
Figs. 2a,b show the resulting () spectrum for those pre-candidates with () inside the corresponding signal region. Clear signals above the combinatorial background are seen around the nominal and values. The spectrum is fitted with the maximum likelihood method by a Gaussian shaped signal plus a background of the form in the 140-180 MeV mass region where and are free parameters. This fit yields = 145.44 0.09 MeV, in good agreement with the PDG [33] value of 145.42 0.05 MeV. The width of the signal is 0.65 0.10 MeV. The excess of events seen in Fig. 2b in the range of masses between 1.5 and 1.7 GeV is mainly due to the decay , where the is not measured. A fit of the spectrum in the mass range 1.7 2.5 GeV to an exponential curve plus a Gaussian gives a value for the mass of 1858 3 MeV, slightly below the PDG[33] value of 1864.6 0.5 MeV. The width of the signal is 19 3 MeV. The fit result is shown by the solid curve in Fig. 2b. The signal region in extends from 143 to 148 MeV. The background under the signal is estimated in two independent ways:
-
•
counting the number of combinations which use pairs of tracks with the same charge for the pre-candidate and fulfill the above requirements (wrong charge combinations, shown in Fig. 2a as the solid histogram);
-
•
using a control region 2.0 2.5 GeV instead of the signal region 1.80 1.92 GeV where the events from the control region have been normalized to the number of events with 155 180 MeV.
The number of background candidates is taken as the weighted mean of the two estimates. The number of reconstructed candidates is taken to be the number of entries in the signal region minus the number of background candidates. For GeV2, in the restricted kinematic region GeV and the result is mesons above a background of . The and mean value and width of the signals predicted by the NC DIS MC sample agree well with the data. The same is true for the background shape and the signal to background ratio. For the measurement of the and dependence, the data sample in each variable has been divided in three bins. The number of obtained in each bin is determined following the same procedure described above.
5.2 reconstruction efficiency
The reconstruction efficiency is determined using MC simulations. DIS events with production by photon-gluon fusion were generated using two different MC models: AROMA 2.1 [34] and HERWIG 5.8 [35]. AROMA is a MC model for heavy flavour production. It is based on the following ingredients: the complete matrix elements in LO for the PGF process (taking into account the mass of the charm quark and the full electroweak structure of the interaction), gluon emission from the system in a parton shower approach, initial state parton showers, hadronisation with the Lund string model [29] as implemented in JETSET 7.4 [30] and heavy flavour decay. In addition bremsstrahlung emission of gluons (some of which may split perturbatively into two gluons or pairs) is also included.
HERWIG is a general purpose QCD MC event generator for high energy hadronic processes. Here it is used for simulating in LO. In addition, leading-logarithm parton showers were included in the simulation. Fragmentation into hadrons is modeled with a cluster fragmentation model which takes into account the charm quark mass.
The parameters of the MC programs were set to their default values. In particular, the charm quark mass () was set to GeV for AROMA and GeV for HERWIG. For the parton densities of the proton the parameterisations of MRSD [32] and MRSA [36] were considered.
Those events containing at least one charged , decaying into with subsequent decay , were processed through the standard ZEUS detector and trigger simulation programs and through the event reconstruction package. Approximately 5000 MC events from the samples generated and processed in this way, passed all the selection criteria. Both MC reproduced equally well the shapes of the uncorrected data distributions relevant for this study. These events were used to determine the reconstruction efficiency as a function of () and . For each candidate, the efficiency in a given ((), ) bin is the ratio of the number of reconstructed in the bin to the number of generated in the bin. Both AROMA and HERWIG MC samples give compatible results and were combined for the final efficiency determination. The resolution is less than 0.01 in units of pseudorapidity. The () resolution is about 2% of the bin width chosen for the figures; none of these show systematic shifts. The reconstruction efficiency in the kinematic range considered varies between 20% for low () and 70% for () 5.8 GeV. The efficiency varies in from 30% near to 50% for moving transversely to the beam direction (). The average reconstruction efficiency is about 38%. As described in section 4.3, the event selection efficiency is determined using the HERACLES MC. The convolution of the event selection efficiency and the reconstruction efficiency gives an overall detection efficiency of approximately 30% for decaying via (1).
6 Results
6.1 fractional momentum distribution
To investigate the charm production mechanism, the distribution of the fractional momentum of the in the system () is studied. The PGF process produces a pair that, in the system, recoils against the proton remnant. In contrast, in the flavor-excitation process, a single quark from the proton sea is scattered off the proton, flying, in the system, in a direction opposite to the proton remnant. Since, in general, the carries a large fraction of the momentum of the parent charm quark [33], clear differences are expected between the distributions from the two production mechanisms. The distribution is expected to be centered at for PGF and peaked at high values for direct production. Figure 1c shows the normalized differential distribution measured in the data and the AROMA prediction (based on PGF). For comparison we also show the prediction by LEPTO6.1 with only direct production from charm. Both MC use the proton density of MRSD [32]. The shape of our data distribution is compatible with PGF, in accord with the H1 result [14].
6.2 Cross sections in a restricted () and kinematic region
Differential cross sections as well as cross sections integrated over the kinematic region GeV and are presented in this section. The differential cross sections are corrected for the efficiencies of the selection criteria as well as for the branching ratios [33].
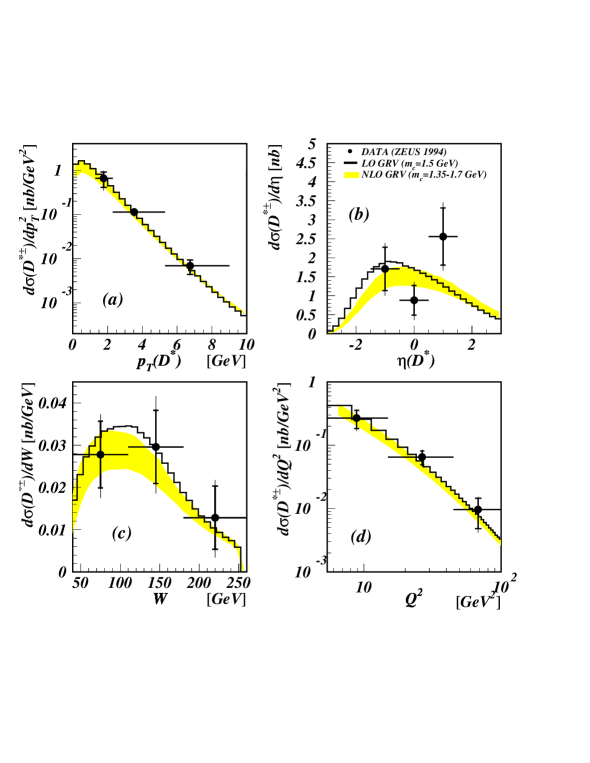
Fig. 3 shows the differential cross section as a function of a) (), b) , c) and d) in the kinematic region defined above. The inner error bars are the statistical errors and the outer ones show the statistical and systematic errors added in quadrature. The data points in the () and distributions are shown at the positions of the average values of an exponential and polynomial fit, respectively, for a given bin.
The differential cross section exhibits an exponential falloff in and is approximately flat. The shape of the dependence of the cross section predicted for photon-gluon fusion at low is determined by the () 1.3 GeV and the cuts. The falloff at large is mainly due to the virtual photon flux. The cross section drops steeply as increases.
The systematic uncertainties arise from several effects. The main uncertainties coming from DIS event selection and reconstruction are: the transverse momentum cut of the soft pion (7%), the range used for the invariant mass (5%) and the positron energy cut (5%). The differences in acceptances evaluated from different MC samples correspond to an uncertainty in the integrated cross section at the 7% level. The QED radiative effects contribute 3 to the systematic error. The systematic error attributed to the branching ratios is 4%. The normalisation uncertainty due to the determination of the luminosity and trigger efficiency is 2%. No significant contribution to the systematic error from the primary vertex requirement was found. Adding the contributions in quadrature, a total systematic error of 15% is obtained in the determination of the integrated cross section. For the differential distributions the systematic errors are estimated bin by bin.
The results of the NLO analytic calculation of [1] using the GRV[37] NLO gluon density, , of the proton is shown as a band in Fig. 3, where the upper (lower) limit corresponds to a charm quark mass of 1.35 (1.7) GeV. The calculation is based exclusively on the PGF process and no charm produced from the proton sea is considered. The GRV NLO parton density gives a reasonable description of the proton structure function measured at HERA [4, 21] and treats the charm quarks as massive particles, consistent with the ansatz of [1]. Charm quarks were hadronized according to the Peterson fragmentation function [38] with [39] and the probability for a charm quark to fragment into , , was assumed to be 0.26 0.02 [39]. Both the renormalisation and the factorisation scales were chosen to be . In this calculation the largest uncertainty is related to that of the charm quark mass. The predicted differential cross section for production as a function of a) () and b) is shown in Fig. 3 outside the restricted kinematic region selected for the data. The NLO analytic calculation reproduces well the shapes of the (), and distributions and is consistent with the dependence in the restricted kinematic region.
Below, unless explicitly stated otherwise, the LO and NLO analytic calculations are those from [1] and use respectively the LO and NLO gluon density parameterisations of GRV [37] and a charm quark mass GeV.
In Fig. 3 the data are also compared with the LO analytic calculation, shown as histograms. The LO calculation performed with the MC programs used in the acceptance calculation and described in section 5.2 agrees well with the LO analytic calculation. Note that the MC calculation includes parton showers in addition to the LO matrix elements. The LO MC and LO analytic calculations describe the shapes of the () , and dependences equally well.
Integrated over the region GeV2 and , the cross section for in the restricted kinematic range GeV and is
where the first error is statistical and the second error is systematic. The cross section represents about 4 of the DIS cross section (calculated from structure functions determined by fits to global data [32]) in the same and ranges. Table 1 compares the measured cross section with the LO and NLO predictions. The integrated cross sections predicted in NLO is in reasonable agreement with the data. The LO MC and analytic calculation agree with the data, although their sensitivity to the parameters involved in the program (, , and ) is higher than in the case of NLO calculations.
6.3 Integrated charm cross section and
The DIS inclusive cross section for charm production, , , can be expressed in terms of using:
| (2) |
In the standard model, the contribution from -boson exchange is expected to be small in the () range of the present analysis and therefore the contribution is neglected. The contribution has been estimated [40] to be smaller than 2% and, therefore, no correction has been applied.
In order to estimate and to evaluate as a function of and , the measurements must be extrapolated to the full () and range. is obtained from the integrated cross section using:
| (3) |
According to the extrapolation with the NLO calculation, about 50 % (at GeV2 ) to 65 % (at GeV2 ) of the production is found to be outside the restricted kinematic region. Using the LO analytic calculation for the extrapolation results in similar cross sections.
For the determination of the integrated cross section the data are divided into two intervals, namely 5GeV2 and 10GeV2. The extrapolated acceptance is calculated using the NLO prediction of GRV[37] with =1.5 GeV, , = 0.26 0.02 and [39]. The integrated charm cross section, , for , is nb for 510 GeV2, and nb for 10GeV2. The first error gives the statistical, the second the experimental systematic uncertainty and the third the model dependent uncertainty. The latter is studied by varying the relevant parameters of the model used for extrapolation, namely (from 1.35 to 1.7 GeV), (from 2 to ), (from 0.025 to 0.045), and (GRV [37], MRSG [41], CTEQ3 [42], MRSA′[36]) 333Note that while GRV (and also CTEQ4F3 and MRRS, see below) follow the charm quark treatment of [1] based on PGF, the CTEQ3 and MRS distributions treat charmed quarks as massless quarks with a parametrized density contributing above a certain threshold in and therefore are not completely consistent with the program of [1]. and also includes the error in the probability for . An uncertainty between 12 % and +9 % is obtained for both ranges.
The integrated charm cross sections as well as the corresponding predictions from the LO and NLO analytic calculations are also listed in Table 1. The NLO predictions are about one standard deviation smaller than the measured value in the first interval (from 5 to 10 GeV2) but in agreement in the second interval (from 10 to 100 GeV2). The charm cross section obtained for 10GeV2 is in reasonable agreement with the recent H1 measurement in the same region.
| [nb] | [nb] | [nb] | |
|---|---|---|---|
| Data | 5.3 1.0 0.8 | ||
| AROMA | 4.57 | 12.6 | 14.2 |
| LO Analytic calculation | 4.79 | 11.0 | 12.4 |
| NLO Analytic calculation | 4.15 | 9.4 | 11.1 |
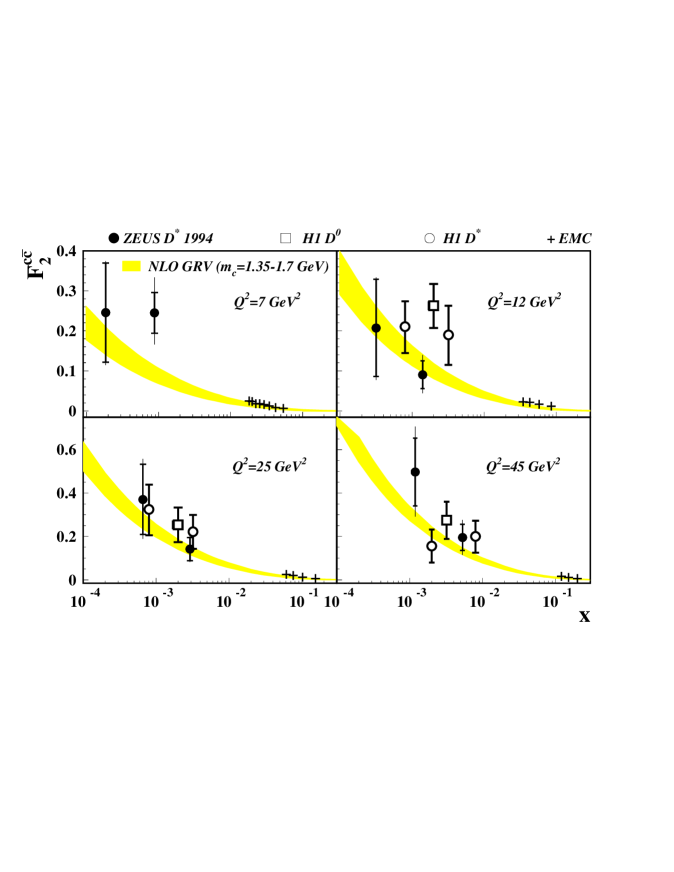
Fig. 4 shows the resulting values as a function of for the different and bins as defined in Fig. 1b. The H1 measurements [14] are also shown; they were taken in the same bins. The two sets of data are in good agreement. Also included in Fig. 4 are the data from the EMC fixed target experiment [43] which were measured at values between 0.02 and 0.3. The charm contribution, , to the proton structure function is seen to rise by about one order of magnitude from the high region covered by the fixed target experiments to the low region measured by H1 and ZEUS. The NLO analytic calculation for is shown in Fig. 4 as a band (the upper (lower) limit corresponds to a charm quark mass of 1.35 (1.7) GeV). In the region of our measurements, the use of CTEQ4F3 [44] or MRRS [45] gluon densities give results which are within 5 % of those using GRV. In the present range, scales roughly with the input gluon density in NLO perturbative QCD. The measured rise of from the high to the low region is reasonably described by NLO perturbative QCD.
Comparing with our measurement of [21], we observe that the ratio is about 25% for the entire () range of the present analysis.
7 Summary and conclusions
We have measured the differential and integrated cross sections for deep inelastic scattering at GeV with 5 100 GeV2 and in the restricted kinematic region of 9.0 GeV and . The integrated cross section is measured to be 5.3 1.0 (stat.) 0.8 (syst.) nb.
The shape of the fractional momentum distribution in the rest system, , shows that the PGF mechanism prediction agrees well with the data for DIS charm production in this kinematic range.
A QCD analytic calculation in NLO with the NLO GRV gluon density reproduces the shapes of the () and distributions and is consistent with the dependence in the restricted kinematic region. The predicted cross sections are in reasonable agreement with the data. We have used QCD calculations to extrapolate the cross section measured in the restricted (), region to the full region and estimated the integrated charm cross section and the charm contribution to the proton structure function . When compared to the fixed target measurements (performed at large ) is found to rise as decreases. The rise is described by NLO QCD calculations when using a gluon density consistent with that extracted from the scaling violations in the proton structure function measured at HERA. Such a gluon density distribution is also compatible with our previous measurements of in photoproduction.
Acknowledgements
The strong support and encouragement by the DESY Directorate have been invaluable. The experiment was made possible by the inventiveness and diligent efforts of the HERA machine group.
The design, construction and installation of the ZEUS detector have been made possible by the ingenuity and dedicated efforts of many people from the home institutes who are not listed here. Their contributions are acknowledged with great appreciation. We acknowledge the support of the DESY computing and network services. We would like to thank J. Smith for valuable discussions and S. Riemersma for helpful comments and for providing us with the NLO analytic calculation.
We warmly acknowledge B. Harris for the close collaboration during the last stage of the analysis and for providing us with the LO and NLO analytic charm cross section calculations.
References
- [1] B. W. Harris, talk A05056, presented at the American Physical Society, Division of Particles and Fields 1996 Meeting, Minneapolis, Minnesota, 10-15 August 1996, to appear in proceedings (hep-ph/9608379); B. W. Harris and J. Smith, Nucl. Phys. B452 (1995) 109; B. W. Harris and J. Smith, Phys. Lett. B353 (1995) 535.
- [2] ZEUS Collaboration, M. Derrick et al., Phys.Lett. B316 (1993) 412; H1 Collaboration, I. Abt et al., Nucl. Phys. B407 (1993) 515.
- [3] ZEUS Collaboration, M. Derrick et al., Phys. Lett. B345 (1995) 576.
- [4] H1 Collaboration, S. Aid et al., Nucl. Phys. B470 (1996) 3.
- [5] P. Bruni, G. Ingelman and A. Solano, Proc. of the HERA Workshop, DESY, Hamburg Vol.1 DESY (1992), 363.
- [6] G.Ingelman, L. Jönsson and M.Nyberg, Phys. Rev. D47 (1993) 4872.
- [7] A. Ali et al., Proc. of the HERA Workshop, DESY, Hamburg, Vol. 1 (1988),393; A. Ali et al., Proc. of the HERA Workshop, DESY, Hamburg Vol.2 (1992), 667.
- [8] M. L. Mangano and P. Nason , Phys. Lett. B285 (1992) 160; M. H. Seymour , Z. Phys. C63 (1994) 99; Nucl. Phys. B436 (1995) 16.
- [9] S. J. Brodsky et al., Phys. Lett. B93 (1980) 451; S. J. Brodsky et al., Nucl. Phys. B369 (1992) 519 and references therein.
- [10] ZEUS Collaboration, M. Derrick et al., Phys. Lett. B349 (1995) 225.
- [11] ZEUS Collaboration, J. Breitweg et al., DESY-97-026, accepted for publication in Phys. Lett. B.
- [12] H1 Collaboration, S. Aid et al., Nucl. Phys. B472 (1996) 32.
- [13] S. Nussinov, Phys. Rev. Lett. 35 (1976) 1672.
- [14] H1 Collaboration, C. Adloff et al., Z. Phys. C72 (1996) 593.
- [15] ZEUS Collaboration, M. Derrick et al., The ZEUS Detector, Status Report 1993, DESY 1993.
- [16] N. Harnew et al., Nucl. Instr. and Meth. A279 (1989) 290; B. Foster et al., Nucl. Phys. B (Proc. Suppl.) 32 (1993) 181; B. Foster et al., Nucl. Instr. and Meth. A338 (1994) 254.
- [17] A. Andresen et al., Nucl. Instr. and Meth. A309 (1991) 101; A. Bernstein et al., Nucl. Instr. and Meth. A336 (1993) 23; A. Caldwell et al., Nucl. Instr. and Meth. A321 (1992) 356.
- [18] ZEUS Collaboration, M. Derrick et al., Z. Phys. C69 (1996) 607.
- [19] J. Andruszków et al., DESY 92-066.
- [20] S. Bentvelsen, J. Engelen and P. Kooijman, Proc. of the HERA Workshop, DESY, Hamburg Vol.1 DESY (1992) 23.
- [21] ZEUS Collaboration, M. Derrick et al., Z. Phys. C72 (1996) 399.
- [22] W.H. Smith et al., Nucl. Instr. Meth. A 355 (1995) 278.
- [23] H. Abramowicz, A. Caldwell and R. Sinkus, Nucl. Inst. Meth. A365 (1995) 508.
- [24] R. Brun et al., GEANT3.13, CERN DD/EE/84-1 (1987).
- [25] A. Kwiatkowski, H. Spiesberger and H.-J. Möhring, Proc. of the HERA Workshop, DESY, Hamburg Vol.3 DESY (1992) 1294.
- [26] K. Charchuła, G. Schuler and H. Spiesberger, CERN-TH. 7133/94.
- [27] G. Ingelman, Proc. of the HERA Workshop, DESY, Hamburg Vol.3 DESY (1992) 1366; G. Ingelman, J.Rathsman and A. Edin, LEPTO version 6.3, DESY 95 - August 1995, ISSN 0418-9833.
- [28] L. Lönnblad, Comput. Phys. Comm. 71 (1992) 15; L. Lönnblad, Z. Phys. C 65 (1995) 285.
- [29] B. Andersson et al., Phys. Rep. 97 (1983) 31.
- [30] T. Sjöstrand, CERN-TH.7112/93, Dec. 1993.
- [31] M. Glück, E. Reya and A. Vogt, Phys. Lett. B306 (1993) 391.
- [32] A.D. Martin, W.J. Stirling and R.G. Roberts, Phys. Lett. B306 (1993) 145; Phys. Lett. B309 (1993) 492 (erratum).
- [33] Particle Data Group, R.M. Barnett et al., Phys. Rev. D54 (1996) 1.
- [34] G.Ingelman, J.Rathsman and G.A.Schuler, AROMA 2.1, DESY 95 - June 1995, ISSN 0418-9833.
- [35] G. Marchesini et al., Comput. Phys. Comm. 67 (1992) 465.
- [36] A.D. Martin, W.J. Stirling and R.G. Roberts, Phys. Rev. D50 (1994) 6734.
- [37] M. Glück, E. Reya and A. Vogt, Z. Phys. C67 (1995) 433.
- [38] C. Peterson et al., Phys. Rev. D27 (1983) 105.
- [39] OPAL Collaboration, R. Akers et al., Z. Phys. C67 (1995) 27.
- [40] E. Laenen, S. Riemersma, J. Smith, and W.L. Van Neerven, Nucl. Phys. B392 (1993) 162; S. Riemersma, J. Smith and W.L. Van Neerven, Phys. Lett. B347 (1995) 147; E. Laenen et al., Proc. of the Workshop ‘Future Physics at HERA’, DESY, Hamburg Vol.1 (1995/96) 393; K. Daum et al., Proc. of the Workshop ‘Future Physics at HERA’, DESY, Hamburg Vol.1 (1995/96) 89.
- [41] A.D. Martin, W.J. Stirling and R.G. Roberts, Phys. Lett. B354 (1995) 155.
- [42] H.L. Lai et al., Phys. Rev. D51 (1995) 4763.
- [43] J. J. Aubert et al. , Nucl. Phys. B213 (1983) 31.
- [44] H. L. Lai and W. K. Tung, hep-ph/9701256.
- [45] A.D.Martin, R.G.Roberts ,M.G.Ryskin, W.J.Stirling, hep-ph/9612449.