Evidence for Exotic Meson Production in the Reaction at 18
Abstract
The system has been studied in the reaction at . A large asymmetry in the angular distribution is observed indicating interference between L-even and L-odd partial waves. The is observed in the = wave, as is a broad enhancement between 1.2 and 1.6 in the wave. The observed phase difference between these waves shows that there is phase motion in addition to that due to decay. The data can be fitted by interference between the and an exotic resonance with M = (1370 ) and (385 ) .
pacs:
13.60.Le, 13.85.Fb, 14.40.CsThe question of whether or not hadrons outside the scope of the constituent quark model exist is one whose answer speaks directly to the fullness of our understanding of quantum chromodynamics (QCD) [2]. However, non- mesons (or exotic mesons) have proven difficult to distinguish from the many conventional states which populate the various mesonic spectra. For this reason, much attention has been focused on those states with manifestly exotic quantum numbers.
A meson with orbital angular momentum and total spin must have and . Thus a resonance with = , , , , … must be exotic. Such a state could be a gluonic excitation such as a hybrid () or glueball (), or a multiquark () state. In a relative P wave (L=1), the system has = . Having isospin I=1, it could not be a glueball, but it could be a hybrid or a multiquark state.
Production and decay properties of exotic states have been predicted using several models [3, 4, 5, 6, 7, 8, 9]. A calculation based upon the MIT bag model predicts [4] that a hybrid () will have a mass near 1.4 . On the other hand, the flux-tube model [5, 6] predicts the mass of the lowest-lying hybrid state to be around . Characteristics of bag-model S-wave multiquark states (which would have = , , or ) have been predicted[8] but those for a state have not. Finally, recent lattice calculations[9] of the hybrid meson estimate its mass to be in the range of 1.7 to 2.1 GeV.
The system has been studied in several recent experiments, with apparently inconsistent results. Alde et al. [10], in a study of interactions at 100 GeV/ at CERN (the GAMS experiment), claimed to observe a state in the system at 1.4 produced via unnatural parity exchange (the P0 partial wave—the naming convention is discussed below) [11]. Aoyagi et al. [12], in a experiment at 6.3 GeV/ at KEK, observed a rather narrow enhancement in the system at 1.3 in the natural parity exchange spectrum (P+). Beladidze et al. [13], in the VES experiment at IHEP, ( interactions at 37 GeV/) also reported a P+ signal in the state, but their signal was broader and had a significantly different phase variation from that of the KEK experiment. While the phase difference between the P+ and D+ waves was independent of mass in the KEK analysis, that phase difference did show significant mass dependence in the VES analysis. (Since the phase variation for the D+ wave follows a classic Breit-Wigner pattern for the meson, the phase difference between these waves can determine the phase variation of the unknown P+ wave.)
Here we study the system in the reaction at . Our data sample was collected in the first data run of E852 at the AGS at Brookhaven National Laboratory with the Multi-Particle Spectrometer (MPS) [14] using a liquid hydrogen target. The MPS, which was equipped with six drift-chamber modules [15] and three proportional wire chambers, was augmented by: a four-layer cylindrical drift chamber surrounding the target [16]; a soft-photon detector consisting of 198 blocks of thallium-doped cesium iodide [17] also surrounding the target; a window-frame lead-scintillator photon-veto counter; a large drift chamber; and a 3045-element lead-glass detector (LGD) [18] downstream of the MPS. Further details are given elsewhere [19].
A total of 47 million triggers which required one forward-going charged track, one recoil charged track, and an LGD trigger-processor signal enhancing high electromagnetic effective mass was recorded. Of these, 47,200 events were reconstructed which were consistent with the final state. These events satisfied topological and fiducial volume cuts, as well as energy/momentum conservation for production and for the decay with a confidence level %[20]. The mass resolution at the mass is = 0.03 .
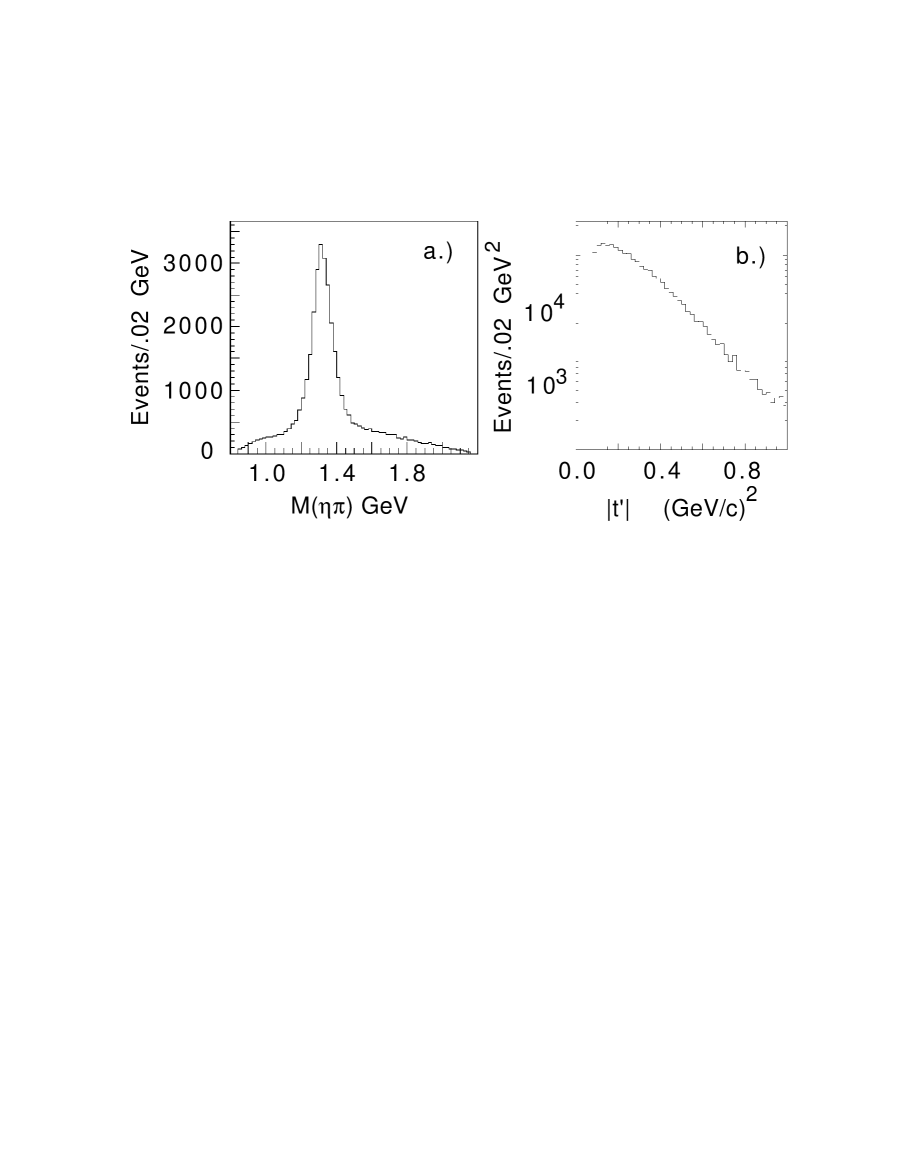
The is the dominant feature of the mass spectrum shown in Fig. 1a. Background has been estimated using side bands in both the 2- mass distribution and the missing-mass distribution, thus taking into account background from non- sources as well as from sources due to production of other final states. The background level is approximately 7% at 1.2 , falling to 1% at 1.3 .
The acceptance-corrected distribution of , where t is the the four-momentum-transfer, is shown for in Fig. 1b. (Our acceptance is quite low below 0.08 due to a trigger requirement.) The shape of this distribution is consistent with previous experiments and has been shown to be consistent with natural-parity exchange production in Regge-pole phenomenology [21, 22].
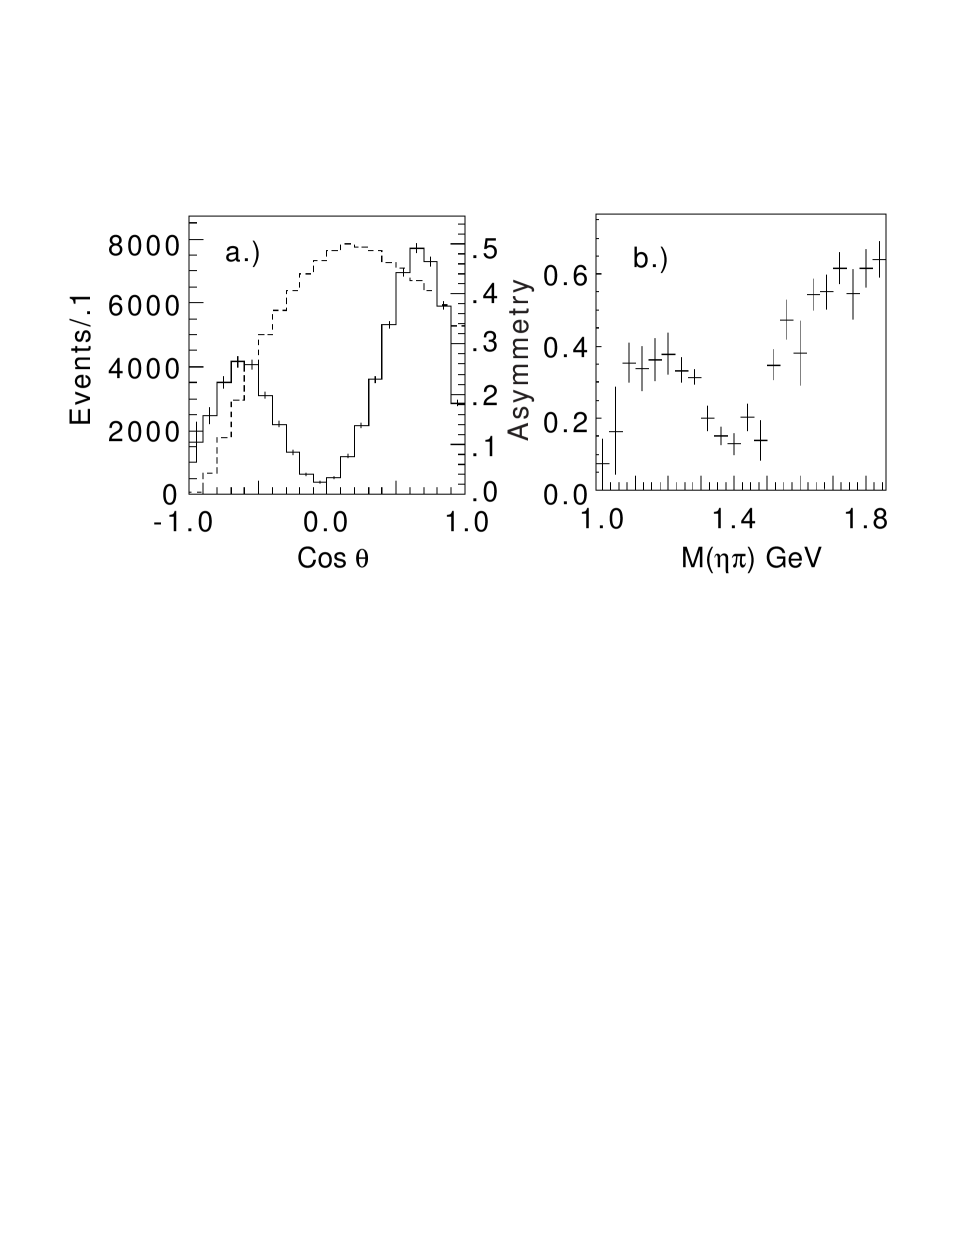
The acceptance-corrected distribution of , the cosine of the angle between the and the beam track in the Gottfried-Jackson frame [23] of the system, is shown in Fig. 2a for . There is a forward-backward asymmetry in . The asymmetry for is plotted as a function of mass in Fig. 2b. The asymmetry is large, statistically significant and mass dependent. Since the presence of only even values of L would yield a symmetric distribution in , the observed asymmetry requires that odd-L partial waves be present to describe the data.
A partial-wave analysis (PWA) [24, 25] based on the extended maximum likelihood method has been used to study the spin-parity structure of the system. The partial waves are parameterized in terms of the quantum numbers as well as , the absolute value of the angular momentum projection, and the reflectivity (which is positive (negative) for natural (unnatural) parity exchange [26]). In our naming convention, a letter indicates the angular momentum of the partial wave in standard spectroscopic notation, while a subscript of means = , = , and a subscript of means = , = . Thus, S0 denotes the partial wave having = , while P- signifies , D+ means , and so on. We consider partial waves with , and we assume that the production spin-density matrix has rank one.
The experimental acceptance is determined by a Monte Carlo method. Peripherally-produced events are generated [27] with isotropic angular distributions in the Gottfried-Jackson frame. After adding detector simulation [28], the Monte Carlo event sample is subjected to the same event-selection cuts and run through the same analysis as the data. The experimental acceptance is then incorporated into the PWA by using these events to calculate normalization integrals (see ref. [24]).
Goodness-of-fit is determined by calculation of a from comparison of the experimental moments with those predicted by the results of the PWA fit. A systematic study has been performed to determine the effect on goodness-of-fit of adding and subtracting partial waves of and . All such waves have been included in the final fit. We have also performed fits including partial waves with = and = . Contributions from these partial waves are found to be insignificant for . Thus, PWA fits shown or referred to in this letter include all partial waves with and (i.e. S0, P0, P-, D0, D-, P+, and D+). The background described above was included as a non-interfering, isotropic term of fixed magnitude.
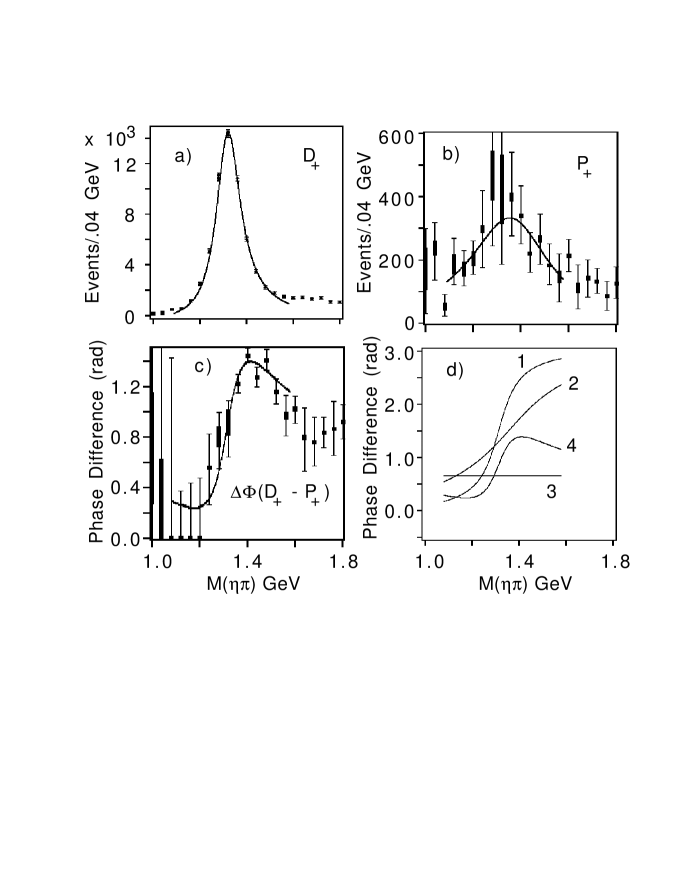
The results of the PWA fit in 40 bins for and are shown in Fig. 3a-c. Here, the acceptance-corrected numbers of events predicted by the PWA fit for the D+ and P+ waves and their phase difference are shown as a function of . There are eight ambiguous solutions in the fit [25, 29, 30], each of which leads to the same angular distribution. We show the range of fitted values for these ambiguous solutions in the vertical rectangular bar at each mass bin, and the maximum extent of their errors is shown as the error bar. The is clearly observed in the D+ partial wave (Fig. 3a). A broad peak is seen in the P+ wave at about (Fig. 3b). increases through the region, and then decreases above about 1.5 (Fig. 3c). The intensities for the waves of negative reflectivity (not shown) are generally small and are all consistent with zero above about 1.3 .
These results are quite consistent with the VES results[13]. In particular, the shape of the phase difference is virtually identical to that reported by VES. (The magnitude of the phase difference is shifted by about 20∘ relative to that of VES.)
Consistency checks and tests of the data have been carried out to determine whether the observation of the structure in the P+ wave could be an artifact due to assumptions made in the analysis or to acceptance problems. These include: fitting the data in restricted ranges of the decay angle; inclusion of higher angular momentum states; fitting the data with various t cuts; fitting the data using different parametrizations of the background; making cuts on other kinematic variables such as the or the effective masses; and fitting data using events with decays (with rather different acceptance from the 2 events). The results are very stable and, in particular, the behavior of does not change in any of these checks.
Fits were also carried out on Monte Carlo events generated with a pure D+ wave to determine whether P+-wave structure could be artificially induced by acceptance effects, resolution, or statistical fluctuations. We do find that some P+ intensity can be induced by resolution and/or acceptance effects. Such “leakage” leads to a P+ wave that mimics the generated D+ intensity (and in our case would therefore have the shape of the ) with a that is independent of mass. Neither property is seen in our result.
In an attempt to understand the nature of the P+ wave observed in our experiment, we have carried out a mass-dependent fit to the results of the mass-independent amplitude analysis. The fit has been carried out in the mass range from 1.1 to 1.6 . The input quantities to the fit included, in each mass bin, the P+-wave intensity; the D+-wave intensity; and the DP+ phase difference. Each of these quantities was taken with its error and correlation coefficients from the result of the amplitude analysis. In this fit, we have assumed that the D+-wave and the P+-wave decay amplitudes are resonant and have used relativistic Breit-Wigner forms[31] for these amplitudes. We introduce a constant relative production phase between the P+-wave and D+-wave amplitudes. The parameters of the fit included the D+-wave mass, width and intensity; the P+-wave mass, width and intensity; and the DP+ production phase difference. One can view this fit as a test of the hypothesis that the correlation between the fitted P-wave intensity and its phase (as a function of mass) can be fit with a resonant Breit-Wigner amplitude.
Results of the fit are shown as the smooth curves in Fig. 3a, b, and c. The mass and width of the = state (Fig. 3a) are (1317 ) and (127 ) respectively [32]. (The first error given is statistical and the second is systematic [33].) The mass and width of the = state as shown in Fig. 3b are (1370 ) and (385 ) respectively. Shown in Fig. 3d are the Breit-Wigner phase dependences for the (line 1) and the P+ waves (line 2); the fitted DP+ production phase difference (line 3); and the fitted DP+ phase difference (line 4). (Line 4, which is identical to the fitted curve shown in Fig. 3c, is obtained as line 1 line 2 line 3.)
The fit to the resonance hypothesis has a dof of 1.49. The fact that the production phase difference can be fit by a mass-independent constant (of 0.6 rad) is consistent with Regge-pole phenomenology [34] in the absence of final-state interactions. If one fits the data to a non-resonant (constant phase) P+ wave, and also assumes a Gaussian intensity distribution for the P+ wave, one obtains a fit with a dof of 1.55. In this case, the observed phase dependence on mass is attributed to a rapidly varying production phase [35]. Such a phase variation cannot be excluded, but is not expected for any known model. Note that for this non-resonant hypothesis one must have a separate hypothesis for the observed structure in the P+ intensity — a structure which is explained naturally by the resonance hypothesis. We thus conclude that there is credible evidence for the production of a = exotic meson.
We would like to express our deep appreciation to the members of the MPS group. Without their outstanding efforts, the results presented here could not have been obtained. We would also like to acknowledge the invaluable assistance of the staffs of the AGS and BNL, and of the various collaborating institutions. This research was supported in part by the National Science Foundation, the US Department of Energy, and the Russian State Committee for Science and Technology.
REFERENCES
- [1] Visitor
- [2] N. Isgur et al., Phys. Rev. Lett. 54, 869 (1985).
- [3] N. Isgur and J. Paton, Phys. Rev. D 31, 2910 (1985).
- [4] T. Barnes et al., Nucl. Phys. B 224, 241 (1983).
- [5] F.E. Close and P.R. Page, Nucl. Phys. B 443, 233 (1995).
- [6] T. Barnes et al., Phys. Rev. D 52, 5242 (1995).
- [7] M. Chanowitz and S. Sharpe, Nucl. Phys. B 222, 211 (1983).
- [8] R.L. Jaffe, Phys. Rev. D 15, 267 (1977).
- [9] P. Lacock, et al., Phys. Rev. D 54, 6997 (1996); C. Berbard, et al., Nucl. Phys. B (Proc. Suppl) 53, 228 (1997).
- [10] D. Alde et al., Phys. Lett. B 205, 397 (1988).
- [11] The result was later brought into question. See Y.D. Prokoshkin and S.A. Sadovskii, Physics of Atomic Nuclei 58, 606 (1995).
- [12] H. Aoyagi et al., Phys. Lett. B 314, 246 (1993).
- [13] G.M. Beladidze et al., Phys. Lett. B 313, 276 (1993).
- [14] S. Ozaki, “Abbreviated Description of the MPS”, Brookhaven MPS note 40, unpublished (1978).
- [15] S.E. Eiseman et al., Nucl. Instr. & Meth. 217, 140 (1983).
- [16] Z. Bar-Yam et al., Nucl. Instr. & Meth. A 386, 253 (1997).
- [17] T. Adams et al., Nucl. Instr. & Meth. A 368, 617 (1996).
- [18] R.R. Crittenden et al., Nucl. Instr. & Meth. A 387, 377 (1997).
- [19] S. Teige et al., Proceedings of the Fifth International Conference on Calorimetry in High Energy Physics, eds. Howard A. Gordon and Doris Rueger (World Scientific, Signapore, 1995) 161.
- [20] O.I. Dahl et al., “SQUAW kinematic fitting program”, Univ. of California, Berkeley Group A programming note P-126, unpublished (1968).
- [21] A.C. Irving and R.P. Worden, Phys. Rep. 34, 117 (1977).
- [22] E.J. Sacharidis, Lett. Nuovo Cimento 25, 193 (1979).
- [23] The Gottfried-Jackson frame is a rest frame of the system in which the z-axis is in the direction of the beam momentum, and the y-axis is in the direction of the vector cross-product of the target and recoil momenta.
- [24] S.U. Chung, “Formulas for Partial-Wave Analysis”, Brookhaven BNL-QGS-93-05, unpublished (1993).
- [25] S.U. Chung, “Amplitude Analysis for Two-pseudoscalar Systems”, Brookhaven BNL-QGS-97-041 (1997); submitted to Phys. Rev.
- [26] S.U. Chung and T.L. Trueman, Phys. Rev. D 11, 633 (1975).
- [27] J. Friedman, “SAGE, A General System for Monte Carlo Event Generation with Preferred Phase Space Density Distributions”, Univ. of California, Berkeley Group A programming note P-189, unpublished (1971).
- [28] Two independent detector simulation methods, GEANT (“GEANT Detector Description and Simulation Tool”, CERN program Library Long Writeups Q123, unpublished (1993)) and the E852 software package SAGEN were used with no significant changes in results.
- [29] S.A. Sadovsky, “On the Ambiguities in the Partial-Wave Analysis of Reaction”, Inst. for High Energy Physics IHEP-91-75, unpublished (1991).
- [30] E. Barrelet, Nuovo Cimento A 8, 331 (1972).
- [31] For both and , a standard relativistic Breit-Wigner form was used with a mass-dependent width. For the wave, the Breit-Wigner form has been modified so as to accomodate deviations of the observed shape of away from the mass from a pure BW form, without altering its phase dependence. Details are given in an expanded paper to be submitted for publication.
- [32] Widths quoted do not take into account mass resolution. The accepted values for the mass and width of the (R.M. Barnett et al., Phys. Rev. D 54, 1 (1996)) are 1318.1 and 107 . Monte Carlo studies show that our fitted width, when resolution effects are taken into account, would be 120 for a true width of 107 . Thus our measured value is somewhat higher than the current world average.
- [33] The systematic errors are based on the range of values allowed by taking into account the previously described ambiguous solutions. Details are given in an expanded paper to be submitted for publication.
- [34] The signature factor and the residue functions are at most t-dependent (not mass dependent) (see ref. [21]).
- [35] The fit requires a linear production phase difference with a slope of -4.3 rad/GeV.