CR303

Recent LEP2 Results from OPAL

D. Glenzinski

Enrico Fermi Institute, University of Chicago
Chicago Illinois, U. S. A. 60637

Presented at the Cracow Epiphany Conference
4-6 January 1997

PACS numbers:01.30.Cc, 12.20.Fv, 14.70.Fm, 14.80.Bn, 14.80.Ly, 14.80-j

In 1996, after another set of upgrades, LEP began running for the first time at center-of-mass energies above the W-pair threshold. This new energy regime offers a wide array of physics topics including tests of the Standard Model at higher energy scales, search physics, and W physics. We summarize the recent results from OPAL using 9.9 pb -1 of data collected at s=161.3𝑠161.3\mbox{$\sqrt{s}$}=161.3 GeV from June to August 1996.

1 Introduction

In October of 1995 the very fruitful LEP1 physics program was officially brought to an end. Later that same year, LEP saw its first running at center-of-mass energies significantly above the Z0superscriptZ0\rm{Z}^{0}-peak (s130𝑠130\mbox{$\sqrt{s}$}\geq 130 GeV). In 1996, after another set of upgrades, LEP began running at center-of-mass energies above the W-pair threshold (s>2MW𝑠2subscriptMW\mbox{$\sqrt{s}$}>2\rm{M_{W}}). This new energy regime offers a wide array of physics topics including tests of the Standard Model (SM) at higher energy scales, search physics, and W physics. We summarize the recent results from OPAL using 9.9 pb -1 of data collected at s=161.3𝑠161.3\mbox{$\sqrt{s}$}=161.3 GeV from June to August 1996. The OPAL detector is described in detail in reference [1].

2 QCD Physics at LEP2

The increased center-of-mass energy at LEP offers a new energy scale at which to test the Standard Model, and in particular to test the predicted effects from the running of αstrongsubscript𝛼strong\alpha_{\rm{strong}} via QCD observables. At center-of-mass energies significantly above the Z0superscriptZ0\rm{Z}^{0}-peak, initial state radiation (ISR) effects become large so that the effective center-of-mass of the e+esuperscriptesuperscripte\rm{e^{+}e^{-}} interaction, ssuperscript𝑠\sqrt{s^{\prime}}, is less than the full energy available, s=2Ebeam𝑠2subscriptEbeam\mbox{$\sqrt{s}$}=2\rm{E_{beam}}. In order to test the SM at a new energy scale it is necessary to differentiate full energy events, in which sssuperscript𝑠𝑠\mbox{$\sqrt{s^{\prime}}$}\approx\mbox{$\sqrt{s}$}, from events with a significant amount of initial state radiation - in particular the dominant “radiative return” events in which sMZ0superscript𝑠subscriptMsuperscriptZ0\mbox{$\sqrt{s^{\prime}}$}\approx\rm{M_{Z^{0}}}. This is accomplished with a kinematic fit that calculates, for each event, an ssuperscript𝑠\sqrt{s^{\prime}} using the visible energy and momentum measured in the event, and assuming energy and momentum conservation as described in reference [2]. The fit uses observed isolated photons and allows up to two unobserved ISR photons whose directions are taken to be along the beam axis. The resulting ssuperscript𝑠\sqrt{s^{\prime}} distribution is shown in Figure 1 for events passing a high multiplicity pre-selection [3]. The so-called “radiative return” events give rise to a peak centered about the Z0superscriptZ0\rm{Z}^{0} mass. To select full energy events we require that ss<10𝑠superscript𝑠10\mbox{$\sqrt{s}$}-\mbox{$\sqrt{s^{\prime}}$}<10 GeV. This yields 307 events with an estimated 6% background from various 4-fermion processes (mostly W+WsuperscriptWsuperscriptW\rm{W^{+}W^{-}} events) and approximately a 5% background from mismeasured radiative events [4]. For several QCD event shape variables we compare the data to a variety of Monte Carlo generators, which employ a variety of fragmentation schemes. Figure 2 shows these comparisons for the thrust, thrust major and minor, oblateness, sphericity, and aplanarity event shape variables. Using a combined fit to a set of separate variables whose dependence on αstrongsubscript𝛼strong\alpha_{\rm{strong}} is predicted by NLLA QCD [5], we measure αstrong(161GeV)=0.101±0.005(stat.)±0.007(syst.)\alpha_{\rm{strong}}(161\rm{GeV})=0.101\pm 0.005(\rm{stat.})\pm 0.007(\rm{syst.}). This measurement is compared to the QCD prediction [6] in Figure 3. In addition we measure the mean charged particle multiplicity to be <nch>(161GeV)=24.46±0.45(stat.)±0.44(syst.)<\rm{n_{ch}}>(161\rm{GeV})=24.46\pm 0.45(\rm{stat.})\pm 0.44(\rm{syst.}) and the position of the peak in the ξp=ln(1/xp)subscript𝜉𝑝1subscript𝑥𝑝\xi_{p}=\ln(1/x_{p}) distribution to be ξ0(161GeV)=4.00±0.03(stat.)±0.02(syst.)\xi_{0}(161\rm{GeV})=4.00\pm 0.03(\rm{stat.})\pm 0.02(\rm{syst.}). These measurements are compared to data taken at lower center-of-mass energies in Figures 4 and 5. These analyses are fully described in reference [4].

3 Two Fermion Physics at LEP2

Hadronic and leptonic two fermion events can also be used to test the SM at the higher energies available at LEP2. We measure cross-sections and asymmetries both including and excluding the dominant radiative return events, e+eγZ0superscriptesuperscripte𝛾superscriptZ0\mbox{$\rm{e^{+}e^{-}}$}\rightarrow\gamma\rm{Z^{0}}, using the event selections described in Reference [7]. For the μ+μsuperscript𝜇superscript𝜇\mu^{+}\mu^{-}, τ+τsuperscript𝜏superscript𝜏\tau^{+}\tau^{-}, and qq¯q¯q{\rm{q}\overline{\rm{q}}} final states, we estimate the effective center-of-mass energy, ssuperscript𝑠\sqrt{s^{\prime}}, in a manner similar to the one described above, in order to discriminate full energy events, sssuperscript𝑠𝑠\mbox{$\sqrt{s^{\prime}}$}\approx\mbox{$\sqrt{s}$}, from the radiative return events, sMZ0superscript𝑠subscriptMsuperscriptZ0\mbox{$\sqrt{s^{\prime}}$}\approx\rm{M_{Z^{0}}}. An inclusive sample is defined by the cut s/s>0.01superscript𝑠𝑠0.01s^{\prime}/s>0.01 and an exclusive sample by the cut s/s>0.80superscript𝑠𝑠0.80s^{\prime}/s>0.80. In the e+esuperscriptesuperscripte\rm{e^{+}e^{-}} final state, due to the dominant t𝑡t-channel production diagram, a definition of ssuperscript𝑠\sqrt{s^{\prime}} as in the other final states is not meaningful. Events with little radiation are therefore selected by a cut on the acollinearity angle between the electron and positron, θacol=πθe+esubscript𝜃acol𝜋subscript𝜃superscript𝑒superscript𝑒\theta_{\rm{acol}}=\pi-\theta_{e^{+}e^{-}}. A cut of θacol<10subscript𝜃acolsuperscript10\theta_{\rm{acol}}<10^{\circ} roughly corresponds to a cut of s/s>0.80superscript𝑠𝑠0.80s^{\prime}/s>0.80 for the s𝑠s-channel contribution. A sample with a smaller t𝑡t-channel contribution is identified by requiring the observed electron to satisfy the condition |cosθe|<0.70subscript𝜃superscript𝑒0.70\left|\cos\theta_{e^{-}}\right|<0.70. The observed number of events, measured cross-sections, and corresponding SM predictions are shown in Table 1. These same results are shown in comparison with lower energy data in Figure 6. For the lepton-pair events we also measure the forward-backward asymmetry. The results are shown graphically in Figure 7, along with the lepton angular distributions, and agree with the SM predictions. For the non-radiative hadronic events we also measure RbsubscriptRb\rm{R_{b}}, the fraction of hadronic events which decay into a bb¯b¯b\rm{b\overline{b}} pair, using a secondary-vertex tagging method similar to the one described in Reference [8]. We find Rb(161GeV)=0.141±0.028(stat.)±0.012(syst.)\rm{R_{b}}(161\rm{GeV})=0.141\pm 0.028(\rm{stat.})\pm 0.012(\rm{syst.}). Figure 8 plots RbsubscriptRb\rm{R_{b}} as a function of center-of-mass energy for the three OPAL measurements at LEP1 [8], LEP1.5, and this measurement. All three measurements are within one standard deviation of the SM expectation.

2 fermions Sel. events σ𝜎\sigma (pb) σSMsuperscript𝜎SM\sigma^{\rm{SM}} (pb)
Hadrons (s/s>0.01superscript𝑠𝑠0.01s^{\prime}/s>0.01) 147214721472 152±4±2plus-or-minus15242152\pm 4\pm 2 149149149
Hadrons (s/s>0.8superscript𝑠𝑠0.8s^{\prime}/s>0.8) 370370370 35.3±2.0±0.7plus-or-minus35.32.00.735.3\pm 2.0\pm 0.7 33.233.233.2
e+esuperscriptesuperscripte\rm{e^{+}e^{-}}(|cosθe|<0.70subscript𝜃superscript𝑒0.70\mbox{$|\cos\theta_{e^{-}}|$}<0.70, θacol<10subscript𝜃acolsuperscript10\theta_{\rm{acol}}<10^{\circ}) 285285285 28.1±1.7±0.2plus-or-minus28.11.70.228.1\pm 1.7\pm 0.2 28.128.128.1
e+esuperscriptesuperscripte\rm{e^{+}e^{-}}(|cosθe±|<0.96subscript𝜃superscript𝑒plus-or-minus0.96\mbox{$|\cos\theta_{e^{\pm}}|$}<0.96, θacol<10subscript𝜃acolsuperscript10\theta_{\rm{acol}}<10^{\circ}) 444744474447 435±7±6plus-or-minus43576435\pm 7\pm 6 424424424
e+esuperscriptesuperscripte\rm{e^{+}e^{-}}(|cosθe±|<0.90subscript𝜃superscript𝑒plus-or-minus0.90\mbox{$|\cos\theta_{e^{\pm}}|$}<0.90, θacol<170subscript𝜃acolsuperscript170\theta_{\rm{acol}}<170^{\circ}) 158215821582 158±4±2plus-or-minus15842158\pm 4\pm 2 153153153
μ+μsuperscript𝜇superscript𝜇\mu^{+}\mu^{-}(s/s>0.01superscript𝑠𝑠0.01s^{\prime}/s>0.01) 989898 12.5±1.2±0.5plus-or-minus12.51.20.512.5\pm 1.2\pm 0.5 11.311.311.3
μ+μsuperscript𝜇superscript𝜇\mu^{+}\mu^{-}(s/s>0.8superscript𝑠𝑠0.8s^{\prime}/s>0.8) 444444 4.6±0.7±0.2plus-or-minus4.60.70.24.6\pm 0.7\pm 0.2 4.54.54.5
τ+τsuperscript𝜏superscript𝜏\tau^{+}\tau^{-}(s/s>0.01superscript𝑠𝑠0.01s^{\prime}/s>0.01) 646464 15.7±2.0±0.7plus-or-minus15.72.00.715.7\pm 2.0\pm 0.7 11.311.311.3
τ+τsuperscript𝜏superscript𝜏\tau^{+}\tau^{-}(s/s>0.8superscript𝑠𝑠0.8s^{\prime}/s>0.8) 434343 6.7±1.0±0.3plus-or-minus6.71.00.36.7\pm 1.0\pm 0.3 4.54.54.5
Table 1: Numbers of events and measured cross-sections at s=161.3𝑠161.3\sqrt{s}=161.3 GeV. For the cross-sections, the first error is statistical and the second is systematic. The last column shows the SM cross-section predictions from ZFITTER [9] (qq¯q¯q\rm{q}\overline{\rm{q}}, μ+μsuperscript𝜇superscript𝜇\mu^{+}\mu^{-}, and τ+τsuperscript𝜏superscript𝜏\tau^{+}\tau^{-}) and ALIBABA [10] (e+e)superscriptesuperscripte\left(\rm{e^{+}e^{-}}\right).

These analyses are described in detail in Reference [7].

4 Search Physics at LEP2

The increased center-of-mass energy at LEP2 opens up an entirely new region of parameter space for a variety of possible new physics signatures. OPAL has a wide and varied program in order to be as sensitive to as many topologies as possible. The principal signature is that of missing momentum (PP\not\!\rm{P}) plus a pair of acoplanar jets, leptons, or some combination thereof. These simple topologies allow sensitivity to SM Higgs, Supersymmetric (SUSY) Higgs, chargino, neutralino, slepton, stop, sbottom, excited lepton, and both charged and neutral heavy lepton production processes. By including 4-jet topologies, and exploiting for particular search channels the presence of hard photons, b-jets, and/or resonances, OPAL achieves reasonable efficiencies over a large parameter space for many models. No significant excess is observed in any of our searches, and a variety of limits are set at the 95%percent9595\% confidence level. Although there are OPAL results for all of the above mentioned processes [11], I will only discuss here the results obtained from the SM Higgs, the chargino and neutralino, and the anomalous 4-jet production searches.

4.1 Search for the Standard Model Higgs Boson

The higher center-of-mass energy available at LEP2 increases the sensitivity of the search for a SM Higgs boson. At this centre-of-mass energy, the main production process for the SM Higgs boson is e+eZ0H0superscriptesuperscriptesuperscriptZ0superscriptH0\mbox{$\rm{e^{+}e^{-}}$}\rightarrow\rm{Z^{0}H^{0}}. The dominant decay is H0bb¯superscriptH0b¯b\mbox{$\rm{H}^{0}$}\rightarrow\mbox{$\rm{b}\overline{\rm{b}}$}, with a branching ratio of approximately 86%. Other relevant decay modes are: H0τ+τsuperscriptH0superscript𝜏superscript𝜏\mbox{$\rm{H}^{0}$}\rightarrow\mbox{$\tau^{+}\tau^{-}$} (8%), H0cc¯superscriptH0c¯c\mbox{$\rm{H}^{0}$}\rightarrow\mbox{$\rm{c}\overline{\rm{c}}$} (4%), and H0superscriptH0absent\mbox{$\rm{H}^{0}$}\rightarrow gluons (2%) [12]. In the mass range of interest, these branching ratios exhibit only a mild dependence on the Higgs boson mass.

The OPAL search is sensitive to the principal final state topologies, namely: (i) the four-jet channel, e+eZ0H0qq¯bb¯superscriptesuperscripteZ0H0qq¯bb¯\mbox{$\rm{e}^{+}\rm{e}^{-}$}\rightarrow\mbox{$\rm{Z}^{0}$}\mbox{$\rm{H}^{0}$}\rightarrow\mbox{$\rm{q\overline{q}}$}\mbox{$\rm{b}\overline{\rm{b}}$}; (ii) the missing energy channel, mainly from e+eZ0H0νν¯qq¯superscriptesuperscripteZ0H0νν¯qq¯\mbox{$\rm{e}^{+}\rm{e}^{-}$}\rightarrow\mbox{$\rm{Z}^{0}$}\mbox{$\rm{H}^{0}$}\rightarrow\mbox{$\nu\overline{\nu}$}\mbox{$\rm{q\overline{q}}$}, but including a small contribution from the W+WsuperscriptWsuperscriptW\rm{W^{+}W^{-}} fusion process e+eνν¯H0superscriptesuperscripteνν¯H0\mbox{$\rm{e}^{+}\rm{e}^{-}$}\rightarrow\mbox{$\nu\overline{\nu}$}\mbox{$\rm{H}^{0}$}; (iii) the tau channels, e+eZ0H0τ+τqq¯superscriptesuperscripteZ0H0τ+τqq¯\mbox{$\rm{e}^{+}\rm{e}^{-}$}\rightarrow\mbox{$\rm{Z}^{0}$}\mbox{$\rm{H}^{0}$}\rightarrow\mbox{$\tau^{+}\tau^{-}$}\mbox{$\rm{q\overline{q}}$} and qq¯q¯q\rm{q\overline{q}}τ+τsuperscript𝜏superscript𝜏\tau^{+}\tau^{-}; and (iv) the electron and muon channels, predominantly from e+eZ0H0e+eqq¯superscriptesuperscripteZ0H0e+eqq¯\mbox{$\rm{e}^{+}\rm{e}^{-}$}\rightarrow\mbox{$\rm{Z}^{0}$}\mbox{$\rm{H}^{0}$}\rightarrow\mbox{$\rm{e}^{+}\rm{e}^{-}$}\mbox{$\rm{q\overline{q}}$} and μ+μsuperscript𝜇superscript𝜇\mu^{+}\mu^{-}qq¯q¯q\rm{q\overline{q}}, but including a small contribution from the Z0superscriptZ0{\rm{Z}^{0}}Z0superscriptZ0{\rm{Z}^{0}} fusion process e+ee+eH0superscriptesuperscriptee+eH0\mbox{$\rm{e}^{+}\rm{e}^{-}$}\rightarrow\mbox{$\rm{e}^{+}\rm{e}^{-}$}\mbox{$\rm{H}^{0}$}. These topologies account for about 95% of all Higgs boson final states.

Table 2 lists the typical efficiency for each channel and gives the observed and expected number of background events for the approximately 101010 pb-1 of data collected at s=161𝑠161\mbox{$\sqrt{s}$}=161 GeV. The observations are in good agreement with the number of expected events from Standard Model background processes. By combining this data with data taken at sMZ0𝑠subscriptMsuperscriptZ0\mbox{$\sqrt{s}$}\approx\rm{M_{Z^{0}}}, we derive a lower limit on the mass of the Higgs boson of MH0>65.0subscriptMsuperscriptH065.0\rm{M_{H^{0}}}>65.0 GeV at the 95%percent9595\% confidence level. This limit is shown in Figure 9.

H0superscriptH0\rm{H}^{0} Z0superscriptZ0\rm{Z}^{0} Eff(%)\rm{Eff}\left(\%\right) NbkgsubscriptNbkg\rm{N_{bkg}} NobssubscriptNobs\rm{N_{obs}}
bb¯b¯b{\rm{b}\overline{\rm{b}}} qq¯q¯q{\rm{q}\overline{\rm{q}}} 232323 0.80.80.8 111
qq¯q¯q{\rm{q}\overline{\rm{q}}} νν¯𝜈¯𝜈{\nu\overline{\nu}} 464646 0.90.90.9 111
qq¯q¯q{\rm{q}\overline{\rm{q}}} τ+τsuperscript𝜏superscript𝜏\tau^{+}\tau^{-} 202020 0.20.20.2 00
qq¯q¯q{\rm{q}\overline{\rm{q}}} ¯¯{\ell\overline{\ell}} 656565 0.10.10.1 00
Table 2: The channel by channel efficiency for a Higgs boson of mass MH=65subscriptMH65\rm{M_{H}}=65 GeV is given along with the number of expected background events from SM processes. The number of observed events is also given and is consistent with the background expectation.

A more detailed description of this analysis can be found in Reference [13].

4.2 Search for Chargino and Neutralino Production

We perform a direct search for the pair production of charginos and neutralinos, whose existence is predicted in SUSY theories. Charginos, χ~j±subscriptsuperscript~𝜒plus-or-minus𝑗\tilde{\chi}^{\pm}_{j}, are the mass eigenstates formed by the mixing of the fields of the fermionic partners of the charged gauge bosons (winos) and those of the charged Higgs bosons (charged higgsinos). Fermionic partners of the photon, the ZZ\rm{Z} boson, and the neutral Higgs bosons mix to form the mass eigenstates called neutralinos, χ~i0subscriptsuperscript~𝜒0𝑖\tilde{\chi}^{0}_{i}. In each case, the index j𝑗j or i𝑖i increases with increasing mass.

If charginos are light enough, they can be pair produced in e+esuperscriptesuperscripte\rm{e^{+}e^{-}}collisions through γ𝛾\gamma or ZsuperscriptZ\rm{Z}^{*} exchange in the s𝑠s-channel and sneutrino (ν~~𝜈\tilde{\nu}) exchange in the t𝑡t-channel. Neutralino pairs (χ~i0χ~j0subscriptsuperscript~𝜒0𝑖subscriptsuperscript~𝜒0𝑗\tilde{\chi}^{0}_{i}\tilde{\chi}^{0}_{j}) can be produced through an s𝑠s-channel γ𝛾\gamma or ZsuperscriptZ\rm{Z}^{*} exchange, or by t𝑡t-channel selectron (e~~𝑒\tilde{e}) exchange.

We assume that the lightest neutralino, χ~10subscriptsuperscript~𝜒01\tilde{\chi}^{0}_{1}, is the lighest supersymmetric particle and that R-parity is conserved. Experimentally these assumptions have the consequence that the χ~10subscriptsuperscript~𝜒01\tilde{\chi}^{0}_{1} is stable and invisible. The lightest chargino, χ~1±subscriptsuperscript~𝜒plus-or-minus1\tilde{\chi}^{\pm}_{1}, can then decay via χ~1±χ~10+νsubscriptsuperscript~𝜒plus-or-minus1subscriptsuperscript~𝜒01superscript𝜈\tilde{\chi}^{\pm}_{1}\rightarrow\tilde{\chi}^{0}_{1}\ell^{+}\nu or χ~1±χ~10qq¯subscriptsuperscript~𝜒plus-or-minus1subscriptsuperscript~𝜒01qsuperscript¯q\tilde{\chi}^{\pm}_{1}\rightarrow\tilde{\chi}^{0}_{1}\rm{q\overline{q}^{\prime}} while the χ~20subscriptsuperscript~𝜒02\tilde{\chi}^{0}_{2} can then decay into the final states χ~10νν¯subscriptsuperscript~𝜒01𝜈¯𝜈\tilde{\chi}^{0}_{1}\nu\overline{\nu}, χ~10+subscriptsuperscript~𝜒01superscriptsuperscript\tilde{\chi}^{0}_{1}\ell^{+}\ell^{-}, or χ~10qq¯subscriptsuperscript~𝜒01q¯q\tilde{\chi}^{0}_{1}\rm{q\overline{q}}. These assumptions have the additional consequence that since events of the type e+eχ~10χ~10γsuperscriptesuperscriptesubscriptsuperscript~𝜒01subscriptsuperscript~𝜒01𝛾\mbox{$\rm{e^{+}e^{-}}$}\rightarrow\tilde{\chi}^{0}_{1}\tilde{\chi}^{0}_{1}\gamma would suffer from a large irreducible background from the standard model process e+eνν¯γsuperscriptesuperscripte𝜈¯𝜈𝛾\mbox{$\rm{e^{+}e^{-}}$}\rightarrow\nu\overline{\nu}\gamma, we can only achieve a reasonable sensitivity for events of the type e+eχ~20χ~10superscriptesuperscriptesubscriptsuperscript~𝜒02subscriptsuperscript~𝜒01\mbox{$\rm{e^{+}e^{-}}$}\rightarrow\tilde{\chi}^{0}_{2}\tilde{\chi}^{0}_{1}, and e+eχ~30χ~10superscriptesuperscriptesubscriptsuperscript~𝜒03subscriptsuperscript~𝜒01\mbox{$\rm{e^{+}e^{-}}$}\rightarrow\tilde{\chi}^{0}_{3}\tilde{\chi}^{0}_{1}. Note that the final state kinematics, and therefore the detection efficiencies, will depend on the mass difference between the chargino and the lightest neutralino, ΔM±=M(χ~1±)M(χ~10)ΔsubscriptMplus-or-minusMsuperscriptsubscript~𝜒1plus-or-minusMsuperscriptsubscript~𝜒10\Delta\rm{M}_{\pm}=\rm{M}(\mbox{$\tilde{\chi}_{1}^{\pm}$})-\rm{M}(\mbox{$\tilde{\chi}_{1}^{0}$}). Similarly for the neutralinos, whose detection efficiency will depend upon the mass difference ΔM0=M(χ~20)M(χ~10)ΔsubscriptM0Msuperscriptsubscript~𝜒20Msuperscriptsubscript~𝜒10\Delta\rm{M}_{0}=\rm{M}(\mbox{$\tilde{\chi}_{2}^{0}$})-\rm{M}(\mbox{$\tilde{\chi}_{1}^{0}$}).

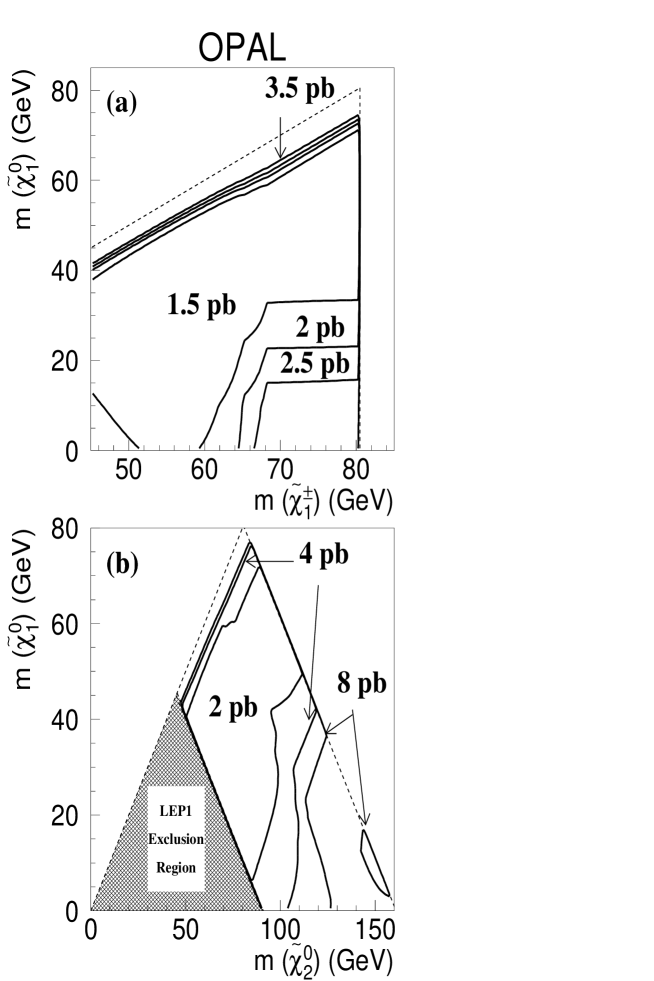
Typical efficiencies for the various final state topologies are given in Table 3 along with the total number of observed and expected events. No significant excess is observed. Table 4 gives the 95%percent9595\% confidence level lower limits that we extract in the context of the Minimal Supersymmetric Standard Model (MSSM) theory assuming that ΔM±>10ΔsubscriptMplus-or-minus10\Delta\rm{M_{\pm}}>10 GeV and ΔM0>10ΔsubscriptM010\Delta\rm{M_{0}}>10 GeV. Figure 10 shows the 95%percent9595\% confidence level upper limit cross-section contours for χ~1+χ~1subscriptsuperscript~𝜒1subscriptsuperscript~𝜒1\tilde{\chi}^{+}_{1}\tilde{\chi}^{-}_{1} and χ~20χ~10subscriptsuperscript~𝜒02subscriptsuperscript~𝜒01\tilde{\chi}^{0}_{2}\tilde{\chi}^{0}_{1} production assuming the decays χ~1±χ~10W±subscriptsuperscript~𝜒plus-or-minus1subscriptsuperscript~𝜒01superscriptWabsentplus-or-minus\tilde{\chi}^{\pm}_{1}\rightarrow\tilde{\chi}^{0}_{1}\rm{W}^{*\pm} and χ~20χ~10Zsubscriptsuperscript~𝜒02subscriptsuperscript~𝜒01superscriptZ\tilde{\chi}^{0}_{2}\rightarrow\tilde{\chi}^{0}_{1}\rm{Z}^{*} occur with 100%percent100100\% branching fraction.

P+Acoplanar::PAcoplanarabsent\not\!\rm{P}+\rm{Acoplanar:}
jetsjets\rm{jets} jets+jets\rm{jets}+\ell leptonsleptons\rm{leptons}
smallΔM±ΔsubscriptMplus-or-minus\Delta\rm{M}_{\pm} 1020%10percent2010-20\% 1520%15percent2015-20\% 1124%11percent2411-24\%
χ~1±superscriptsubscript~𝜒1plus-or-minus\tilde{\chi}_{1}^{\pm} large ΔM±ΔsubscriptMplus-or-minus\Delta\rm{M}_{\pm} 4060%40percent6040-60\% 3065%30percent6530-65\%
BR 45%percent4545\% 45%percent4545\% 10%percent1010\%
smallΔM0ΔsubscriptM0\Delta\rm{M}_{0} 520%5percent205-20\% 522%5percent225-22\%
χ~0superscript~𝜒0\tilde{\chi}^{0} large ΔM0ΔsubscriptM0\Delta\rm{M}_{0} 2045%20percent4520-45\%
BR 4080%40percent8040-80\% 2060%20percent6020-60\%
0.7±0.2plus-or-minus0.70.20.7\pm 0.2 expected background
222 events observed
Table 3: Typical efficiencies for the various topologies used in the chargino and neutralino searches along with the number of expected events from SM processes. The number of observed events is consistent with this background expectation.
Mass tanβ=1.5𝛽1.5\tan\beta=1.5 tanβ=35𝛽35\tan\beta=35
(GeV) Min. m0subscript𝑚0m_{0} m0subscript𝑚0m_{0}=111 TeV Min. m0subscript𝑚0m_{0} m0subscript𝑚0m_{0}=111 TeV
Mχ~1±subscriptMsuperscriptsubscript~𝜒1plus-or-minus\rm{M}_{\mbox{$\tilde{\chi}_{1}^{\pm}$}} 62.062.062.0 78.578.578.5 66.566.566.5 78.878.878.8
Mχ~10subscriptMsuperscriptsubscript~𝜒10\rm{M}_{\mbox{$\tilde{\chi}_{1}^{0}$}} 12.012.012.0 30.330.330.3 35.835.835.8 41.341.341.3
Mχ~20subscriptMsuperscriptsubscript~𝜒20\rm{M}_{\mbox{$\tilde{\chi}_{2}^{0}$}} 45.345.345.3 51.951.951.9 67.267.267.2 80.080.080.0
Mχ~30subscriptMsuperscriptsubscript~𝜒30\rm{M}_{\mbox{$\tilde{\chi}_{3}^{0}$}} 86.386.386.3 94.394.394.3 112.5112.5112.5 112.5112.5112.5
Table 4: Lower limits on chargino and neutralino masses at the 95%percent9595\% confidence level in the context of the MSSM and assuming ΔM>10Δ𝑀10\Delta M>10 GeV. The limits are derived for both the minimal m0subscript𝑚0m_{0} consistent with present experimental constraints and m0=1subscript𝑚01m_{0}=1 TeV for the two cases tanβ=1.5𝛽1.5\tan\beta=1.5 and tanβ=35𝛽35\tan\beta=35. The limits on the χ~30superscriptsubscript~𝜒30\tilde{\chi}_{3}^{0} mass are obtained mainly from excluded regions in the MSSM parameter space resulting from the direct search for lighter neutralinos and χ~1±superscriptsubscript~𝜒1plus-or-minus\tilde{\chi}_{1}^{\pm}.

A more detailed description of this analysis can be found in Reference [14].

4.3 Anomalous Four-Jet Production

Using LEP1.5 data, the ALEPH collaboration reported a large excess of four-jet events [15]. We have performed an analogous analysis sensitive to anomalous four-jet production. Using a sample of simulated SUSY h0A0qqqqsuperscripth0superscriptA0qqqq\rm{h^{0}A^{0}}\rightarrow\rm{qqqq} (s=133𝑠133\mbox{$\sqrt{s}$}=133 GeV) as a benchmark for comparison, we achieve the same efficiency and background and a comparable mass resolution (to within 10%percent1010\%) as the ALEPH analysis, thus ensuring that the two analyses have the same sensitivity. For each event passing the cuts, the invariant mass of each jet-jet pair is calculated for all possible jet-jet combinations. The sum of the di-jet masses for that combination yielding the minimum mass difference between the two pairings is shown in Figure 11, which includes all data taken at the center-of-mass energies 133133133, 161161161, and 172172172 GeV. We expect 26.026.026.0 events and observe 202020. The distribution of the sum of the di-jet masses is consistent with the SM background expectation. If systematic effects are neglected, the ALEPH and OPAL data are consistent at the level of 106similar-toabsentsuperscript106\sim 10^{-6}. It should be noted that the inclusion of the systematic effects would reduce this significance.

5 WWWW\rm{WW} Physics at LEP2

At the center-of-mass energy s=161𝑠161\mbox{$\sqrt{s}$}=161 GeV the W+WsuperscriptWsuperscriptW\rm{W^{+}W^{-}} production cross-section is dominated by the so called “CC03” diagrams [16]: s𝑠s-channel γ𝛾\gamma or ZsuperscriptZ\rm{Z^{*}} exchange, and t𝑡t-channel neutrino exchange. This center-of-mass energy lies just above the W pair production threshold, and the cross-section here has a particularly strong dependence on the value of the mass of the W-boson, MWsubscriptMW\rm{M}_{\rm{W}}, so that it is possible to extract MWsubscriptMW\rm{M}_{\rm{W}} from the data by measuring the cross-section and comparing with theoretical predictions in the context of the SM. These measurements are complementary to those at the Tevatron collider [17] and to those which will be performed during the later phases of LEP2 operation by directly reconstructing the W decay products. In addition, the two s𝑠s-channel contributions to the cross-section are sensitive to the triple gauge couplings, WWZ𝑊𝑊𝑍WWZ and WWγ𝑊𝑊𝛾WW\gamma.

5.1 Measurement of the W Boson Mass

The analysis is sensitive to all expected decay topologies, the fully hadronic decays, W+Wqq¯qq¯superscriptWsuperscriptWq¯qq¯q\mbox{$\rm{W^{+}W^{-}}$}\rightarrow{\rm{q\overline{q}q\overline{q}}}, the semi-leptonic decays, W+Wqq¯νsuperscriptWsuperscriptWq¯q𝜈\mbox{$\rm{W^{+}W^{-}}$}\rightarrow{\rm{q\overline{q}}\ell\nu}, and the fully leptonic decays, W+WννsuperscriptWsuperscriptW𝜈𝜈\mbox{$\rm{W^{+}W^{-}}$}\rightarrow{\ell\nu\ell\nu} (\ell = e𝑒e, μ𝜇\mu, or τ𝜏\tau). The dominant background is Z0/γff¯superscriptZ0𝛾f¯f\rm{Z^{0}}/\gamma\rightarrow\rm{f\overline{f}}, where ff\rm{f} is any charged fermion. Other backgrounds arise from four-fermion processes which do not contain two resonant W bosons in the intermediate state. These four-fermion backgrounds fall into two classes: those which can interfere with the W+WsuperscriptWsuperscriptW\rm{W^{+}W^{-}} four-fermion states, and those which cannot. The interfering four-fermion backgrounds are particularly problematic because they can also depend on MWsubscriptMW\rm{M}_{\rm{W}}. This mass-dependent four-fermion background is taken into account when extracting MWsubscriptMW\rm{M}_{\rm{W}} from the observed data. In addition, the cross-section for the process e+eW+WsuperscriptesuperscriptesuperscriptWsuperscriptW\mbox{$\rm{e^{+}e^{-}}$}\rightarrow\mbox{$\rm{W^{+}W^{-}}$}, arising from the CC03 diagrams, is also measured from the data assuming that the interference terms have only a small effect on the accepted W+WsuperscriptWsuperscriptW\rm{W^{+}W^{-}} cross-section. This is a reasonable assumption given the current level of statistical precision.

Fully hadronic W+Wqq¯qq¯superscriptWsuperscriptWq¯qq¯q\mbox{$\rm{W^{+}W^{-}}$}\rightarrow{\rm{q\overline{q}q\overline{q}}} events are selected as high-multiplicity, spherical, four-jet events, whose kinematics are compatible with the e+eW+WsuperscriptesuperscriptesuperscriptWsuperscriptW\mbox{$\rm{e^{+}e^{-}}$}\rightarrow\mbox{$\rm{W^{+}W^{-}}$} hypothesis. The semi-leptonic W+Wqq¯νsuperscriptWsuperscriptWq¯q𝜈\mbox{$\rm{W^{+}W^{-}}$}\rightarrow{\rm{q\overline{q}}\ell\nu} events are characterized by two, high-multiplicity, back-to-back jets, an energetic lepton candidate (a low multiplicity jet in the case of =τ𝜏\ell=\tau), and large missing transverse momentum due to the escaping neutrino. The fully-leptonic decays, W+WννsuperscriptWsuperscriptW𝜈𝜈\mbox{$\rm{W^{+}W^{-}}$}\rightarrow{\ell\nu\ell\nu} are selected as energetic, acoplanar, lepton pairs with large missing transverse momentum. The efficiencies, and expected number of signal (assuming the world average W-boson mass [18]) and background events for each channel are given in Table 5. Summing over all channels, we expect 27.6±2.5plus-or-minus27.62.527.6\pm 2.5 events and observe 282828.

expected
Channel Eff (%percent\%) Signal Bkgd Total Obs
qqqqqqqq\rm{qqqq} 575757 9.69.69.6 3.43.43.4 13.0±1.1plus-or-minus13.01.113.0\pm 1.1 141414
qqeνqqe𝜈\rm{qqe}\nu 717171 3.93.93.9 0.20.20.2 4.1±0.5plus-or-minus4.10.54.1\pm 0.5 333
qqμνqq𝜇𝜈\rm{qq}\mu\nu 777777 4.24.24.2 0.20.20.2 4.5±0.5plus-or-minus4.50.54.5\pm 0.5 222
qqτνqq𝜏𝜈\rm{qq}\tau\nu 424242 2.32.32.3 1.01.01.0 3.2±0.4plus-or-minus3.20.43.2\pm 0.4 777
νν𝜈𝜈\ell\nu\ell\nu 656565 2.62.62.6 0.20.20.2 2.8±0.3plus-or-minus2.80.32.8\pm 0.3 222
Total 616161 22.622.622.6 5.05.05.0 27.6±2.5plus-or-minus27.62.527.6\pm 2.5 282828
Table 5: The efficiency, background, and number of observed events for each of the WW final state topologies. The efficiency is calculated assuming the world average W mass and taking as signal only the CC03 diagrams. The backgrounds correspond to all other diagrams and assumes that the interference effects can be neglected.

By neglecting the MWsubscriptMW\rm{M}_{\rm{W}} dependence of the interfering four-fermion backgrounds, we can measure the W-pair (CC03) production cross-section using the information from each channel separately. For each channel, the probability of obtaining the number of observed events is calculated as a function of the W+WsuperscriptWsuperscriptW\rm{W^{+}W^{-}} cross-section using Poisson statistics and assuming SM branching ratios. A likelihood is formed from the product of the Poisson probabilities for each channel. The maximum likelihood value yields a CC03 cross-section of

σWW=3.620.82+0.93(stat)±0.16(syst)pb.subscript𝜎WWplus-or-minussubscriptsuperscript3.620.930.82stat0.16systpb\sigma_{\rm{WW}}=3.62^{+0.93}_{-0.82}(\rm{stat})\pm 0.16(\rm{syst})\rm{pb}. (1)

The systematic uncertainty is evaluated by means of repeated MC trials. The procedure takes into account the correlated luminosity uncertainties and the small correlated systematic uncertainties between the semi-leptonic channels.

To determine the W-boson mass we parameterize the total accepted cross-section for each channel, including the effects of interfering four-fermion final states, as a function of MWsubscriptMW\rm{M}_{\rm{W}} as shown in Figure 12. We employ a maximum likelihood technique analogous to the one described above to determine

MW=80.800.410.10+0.44+0.09±0.03GeV,subscriptMWplus-or-minussubscriptsuperscript80.800.440.090.410.100.03GeV\mbox{$\rm{M}_{\rm{W}}$}=80.80^{+0.44+0.09}_{-0.41-0.10}\pm 0.03\rm{GeV}, (2)

where the first and second uncertainties are statistical and systematic, respectively, and the third arises from the current estimate of the LEP beam energy uncertainty. As a cross-check, the value of MWsubscriptMW\rm{M}_{\rm{W}} can also be determined from the CC03 cross-section measurement described above by employing the semi-analytic program GENTLE [19] to derive the dependence of σWWsubscript𝜎WW\sigma_{\rm{WW}} on MWsubscriptMW\rm{M}_{\rm{W}}, and by assuming that the experimental acceptance does not significantly vary as a function of MWsubscriptMW\rm{M}_{\rm{W}}. The W+WsuperscriptWsuperscriptW\rm{W^{+}W^{-}} cross-section and resulting MWsubscriptMW\rm{M}_{\rm{W}} measured in this CC03 framework are shown in Figure 13. This measurement is consistent with the value determined in the full four-fermion analysis.

This analysis is described in more detail in Reference [20].

5.2 Measurement of the Triple Gauge Couplings

Anomalous triple gauge couplings (TGCs) can affect both the total production cross-section and the shape of the differential cross-section as a function of the WW\rm{W} production angle. The relative contributions of each helicity state of the W-bosons are also changed, which in turn affects the distributions of their decay products.

The most general Lorentz invariant Lagrangian has up to 14 independent WWVWWV\rm{WWV} couplings. Requiring electromagnetic gauge invariance and CC\rm{C} and PP\rm{P} invariance reduces this parameter set to five, 3 describing the WWZWWZ\rm{WWZ} vertex and 2 descibing the WWγWW𝛾\rm{WW}\gamma vertex. This parameter space can be further reduced by considering constraints available from lower energy data and precise measurements at LEP1 [16]. As a result of these considerations, three specific linear combinations of these couplings have been proposed which are not tightly constrained by the lower energy data. These are:

αBϕsubscript𝛼𝐵italic-ϕ\displaystyle\alpha_{B\phi} \displaystyle\equiv ΔκγΔg1zcos2θwΔsubscript𝜅𝛾Δsubscriptsuperscript𝑔𝑧1superscript2subscript𝜃𝑤\displaystyle\Delta\kappa_{\gamma}-\Delta g^{z}_{1}\cos^{2}\theta_{w}
αWϕsubscript𝛼𝑊italic-ϕ\displaystyle\alpha_{W\phi} \displaystyle\equiv Δg1zcos2θwΔsubscriptsuperscript𝑔𝑧1superscript2subscript𝜃𝑤\displaystyle\Delta g^{z}_{1}\cos^{2}\theta_{w}
αWsubscript𝛼𝑊\displaystyle\alpha_{W} \displaystyle\equiv λγsubscript𝜆𝛾\displaystyle\lambda_{\gamma}

with the constraints that Δκz=Δg1zΔκγtan2θwΔsubscript𝜅𝑧Δsubscriptsuperscript𝑔𝑧1Δsubscript𝜅𝛾𝑡𝑎superscript𝑛2subscript𝜃𝑤\Delta\kappa_{z}=\Delta g^{z}_{1}-\Delta\kappa_{\gamma}tan^{2}\theta_{w} where the ΔΔ\Delta indicates the deviation of the respective quantity from the SM expectation and θwsubscript𝜃𝑤\theta_{w} is the weak mixing angle. We are most sensitive to the WϕWitalic-ϕ\rm{W}\phi model, which is the only model we presently consider assuming αBϕsubscript𝛼𝐵italic-ϕ\alpha_{B\phi} and αWsubscript𝛼𝑊\alpha_{W} are zero.

We use both the total cross-section and relevant differential kinematic distributions to set limits on αWϕsubscript𝛼𝑊italic-ϕ\alpha_{W\phi}. For the cross-section analysis, the same selections are used as described in Section 5.1. For the analysis of the kinematic distributions we use only the qq¯νq¯q𝜈{\rm{q\overline{q}}\ell\nu} channels since - in contrast with the qq¯qq¯q¯qq¯q{\rm{q\overline{q}q\overline{q}}} channel - there is neither an ambiguity in assigning decay fermion pairs to each W, nor in determining the charges of each W. These selections are augmented in order to further reduce the background. The kinematic variables used are:

  1. 1.

    cosθWsubscript𝜃𝑊\cos\theta_{W}, the production angle of the WsuperscriptW\rm{W^{-}} with respect to the esuperscripte\rm{e^{-}} beam direction,

  2. 2.

    pWsubscript𝑝𝑊p_{W}, the momentum of the hadronically decaying W

  3. 3.

    cosθsubscriptsuperscript𝜃\cos\theta^{*}_{\ell}, the polar decay angle of the charged lepton with respect to the W flight direction measured in the W rest frame

  4. 4.

    ϕsubscriptsuperscriptitalic-ϕ\phi^{*}_{\ell}, the azimuthal decay angle of the charged lepton with respect to a plane defined by the W and the beam axis.

In the case of the qq¯eνq¯qe𝜈{\rm{q\overline{q}e}\nu} and qq¯μνq¯q𝜇𝜈{\rm{q\overline{q}}\mu\nu} channels we use variables resulting from a kinematic fit demanding energy and momentum conservation. For the qq¯τνq¯q𝜏𝜈{\rm{q\overline{q}}\tau\nu} channel we use energy and momentum constraints to calculate the energy of the of the τ𝜏\tau where the τ𝜏\tau flight direction is approximated by the direction of its observed decay products. As demonstrated in Figure 14, the resolution of the kinematic variables, as estimated from MC, is comparable for all the qq¯νq¯q𝜈{\rm{q\overline{q}}\ell\nu} channels.

The total cross-section measurement is used to calculate a likelihood, analogous to the one described in Section 5.1, except that σWWsubscript𝜎𝑊𝑊\sigma_{WW} is parameterized as a function of αWϕsubscript𝛼𝑊italic-ϕ\alpha_{W\phi}, assuming the world average MWsubscriptMW\rm{M}_{\rm{W}}. For the differential distributions, we calculate the likelihood for the observed qq¯νq¯q𝜈{\rm{q\overline{q}}\ell\nu} events to have their measured distributions of the kinematic variables as a function of αWϕsubscript𝛼𝑊italic-ϕ\alpha_{W\phi}. These likelihoods are independent and are added together to yield a total likelihood distribution, shown in Figure 15, from which we measure

αWϕ=0.610.61+0.73(stat)±0.35(syst).subscript𝛼𝑊italic-ϕplus-or-minussubscriptsuperscript0.610.730.61stat0.35syst\alpha_{W\phi}=-0.61^{+0.73}_{-0.61}(\rm{stat})\pm 0.35(\rm{syst}). (3)

The corresponding 95%percent9595\% confidence level limits are

2.1<αWϕ<1.62.1subscript𝛼𝑊italic-ϕ1.6-2.1<\alpha_{W\phi}<1.6 (4)

This analysis is described in more detail in Reference [21].

6 Summary

During the 1996 data taking run LEP ran for the first time at center-of-mass energies above the W-pair production threshold. This new energy regime offers new tests of the SM, opens up a previously unexplored region of parameter space for a wide variety of models beyond the SM, such as SUSY, and affords the first study of W+WsuperscriptWsuperscriptW\rm{W^{+}W^{-}} events from which we can measure MWsubscriptMW\rm{M}_{\rm{W}} and extract limits for anomalous triple gauge couplings. OPAL has established a wide and varied physics program exploiting these opportunities [4] [7] [11] [13] [14] [20] [21].

REFERENCES

  • [1] OPAL Collab.  K. Ahmet et al.  Nucl. Instrum. Methods A305 (1991) 251.
  • [2] OPAL Collab.  G. Alexander et al.  Z. Phys. C72 (1996) 191.
  • [3] OPAL Collab.  G. Alexander et al.  Z. Phys. C52 (1991) 175.
  • [4] OPAL Collab.  K. Ackerstaff et al.  CERN-PPE/97-015 Submitted to, Z. Phys.
  • [5] S. Cantani, L. Trentadue, G. Turnock, and B. R. Webber, Nucl. Phys. B407 (1993) 3; S. Cantani, G. Turnock, B. R. Webber, Phys. Lett. B295 (1992) 269; G. Dissertori and M. Schmelling, Phys. Lett. B361 (1995) 167.
  • [6] C. T. H. Davies et al.  Phys. Lett. B345 (1995) 42; G. P. Lepage, hep-lat/9607076 (1996).
  • [7] OPAL Collab.  K. Ackerstaff et al.  Phys. Lett. B391 (1997) 221.
  • [8] OPAL Collab.  K. Ackerstaff et al.  CERN-PPE/96-137 to be published in Z. Phys.
  • [9] D. Bardin et al.  CERN-TH 6443/92 (May 1992); Phys. Lett. B255 (1991) 290; Nucl. Phys. B351 (1991) 1; Z. Phys. C44 (1989) 493.
  • [10] W. Beenakker et al. Nucl. Phys. B349 (1991) 323.
  • [11] OPAL Collab. K. Ackerstaff et al. CERN-PPE/96-182, to be published in Phys. Lett. B; Phys. Lett. B393 (1997) 217; Phys. Lett. B391 (1997) 197; Phys. Lett. B391 (1997) 210; Phys. Lett. B389 (1996) 197.
  • [12] A. Djouadi, M. Spira, and P. M. Zerwas, Z. Phys. C70 (1996) 425.
  • [13] OPAL Collab. K. Ackerstaff et al.  Phys. Lett. B393 (1997) 231.
  • [14] OPAL Collab. K. Ackerstaff et al.  Phys. Lett. B389 (1996) 616.
  • [15] ALEPH Collab. D. Buskulic et al.  Z. Phys. C71 (1996) 179.
  • [16] Proceedings of CERN LEP2 Workshop, CERN 96-01, W. Beenakker et al.  eds. G. Altarelli, F. Zwirner, February 1996.
  • [17] D0 Collaboration, S. Abachi et al.  Phys. Rev. Lett. 77 (1996) 3309; CDF Collaboration, F. Abe et al.  Phys. Rev. Lett. 75 (1995) 11, Phys. Rev. D52 (1995) 4784.
  • [18] The Particle Data Group, R. M. Barnett et al.  Phys. Rev. D54 (1996) 1.
  • [19] D. Bardin et al.  Nucl. Phys. B, Proc. Suppl. 37B (1994) 148.
  • [20] OPAL Collab. K. Ackerstaff et al.  Phys. Lett. B389 (1996) 416.
  • [21] OPAL Collab. K. Ackerstaff et al.  CERN-PPE/97-04, to be published in Phys. Lett. B.
  • [22] S. Bethke, PITHA 96/30 (1996), Talk presented at the QCD Euroconference, Montpellier, France July 4-12 1996.
  • [23] OPAL Collab. G. Alexander et al.  Phys. Lett. B377 (1996) 181.
Fig. 1: Distribution of ssuperscript𝑠\sqrt{s^{\prime}} for the data (full points) with statistical errors. The Monte Carlo predictions for the e+eZ/γsuperscriptesuperscripteZ𝛾\mbox{$\rm{e^{+}e^{-}}$}\rightarrow\rm{Z}/\gamma events (solid line), the radiative background (dashed line), and the 4-fermion background (hatched) are also shown.
Fig. 2: Distributions of the event shape variables thrust (T𝑇T), thrust major, (Tmajorsubscript𝑇𝑚𝑎𝑗𝑜𝑟T_{major}), thrust minor (Tminorsubscript𝑇𝑚𝑖𝑛𝑜𝑟T_{minor}), oblateness (O𝑂O), sphericity (S𝑆S), and aplanarity (A𝐴A). Experimental statisitical error bars are delimited by the small horizontal bars. The total errors are shown by the vertical error lines. Predictions from several Monte Carlo generators are also shown.
Fig. 3: Values of αstrongsubscript𝛼strong\alpha_{\rm{strong}} as a function of energy [22]. The labels NLO and NNLO refer to the order of calculation used. NLO corresponds to 𝒪(αstrong2)𝒪superscriptsubscript𝛼strong2{\cal O}(\alpha_{\rm{strong}}^{2}) in e+esuperscriptesuperscripte\rm{e^{+}e^{-}} annihilations, and NNLO to 𝒪(αstrong3)𝒪superscriptsubscript𝛼strong3{\cal O}(\alpha_{\rm{strong}}^{3}). The label Lattice refers to αstrongsubscript𝛼strong\alpha_{\rm{strong}} values determined from lattice QCD calculations. The curve shows the 𝒪(αstrong3)𝒪superscriptsubscript𝛼strong3{\cal O}(\alpha_{\rm{strong}}^{3}) QCD prediction for αstrong(𝒬)subscript𝛼strong𝒬\alpha_{\rm{strong}}({\cal Q}) using αstrong(MZ)=0.118±0.006subscript𝛼strongsubscriptMZplus-or-minus0.1180.006\alpha_{\rm{strong}}(\rm{M_{Z}})=0.118\pm 0.006; the full line shows the central value while the dotted lines indicate the variation given by the uncertainty.
Fig. 4: (a) Corrected distribution of the charged particle multiplicity nchsubscript𝑛chn_{\rm{ch}}. Predictions from several Monte Carlo generators are also shown. (b) Mean charged particle multiplicity measurements as a function of s𝑠\sqrt{s}. The measurements are compared to a fit of the NLLA QCD prediction for the evolution of the charged particle multiplicity with s𝑠\sqrt{s} and to the predictions of several Monte Carlo generators.
Fig. 5: (a) Distribution of ξp=ln(1/xp)subscript𝜉𝑝1subscript𝑥𝑝\xi_{p}=\ln(1/x_{p}) for charged particles. Also shown are the MLLA QCD prediction and the predictions of several Monte Carlo generators. (b) Evolution of the position of the peak of the ξpsubscript𝜉𝑝\xi_{p} distribution, ξ0subscript𝜉0\xi_{0}, as a function of s𝑠\sqrt{s}, compared with a fit of a NLLA QCD prediction up to and including the data points at s=130𝑠130\mbox{$\sqrt{s}$}=130 GeV.
Fig. 6: Measured total cross-sections (s/s>0.01superscript𝑠𝑠0.01s^{\prime}/s>0.01) for different final states as a function of s𝑠\sqrt{s}. The cross-sections for μ+μsuperscript𝜇superscript𝜇\mu^{+}\mu^{-} and τ+τsuperscript𝜏superscript𝜏\tau^{+}\tau^{-} production have been reduced by a factor of ten for clarity. For the qq¯q¯q{\rm{q}\overline{\rm{q}}}, μ+μsuperscript𝜇superscript𝜇\mu^{+}\mu^{-}, and τ+τsuperscript𝜏superscript𝜏\tau^{+}\tau^{-} final states, the cross-sections at high energies (s130𝑠130\sqrt{s}\geq 130 GeV) are also shown for s/s>0.80superscript𝑠𝑠0.80s^{\prime}/s>0.80. The curves show the SM predictions of ZFITTER and ALIBABA.
Fig. 7: (a) Measured forward-backward asymmetry for e+esuperscriptesuperscripte\rm{e^{+}e^{-}} pairs selected with |cosθe|<0.7subscript𝜃superscript𝑒0.7\left|\cos\theta_{e^{-}}\right|<0.7 and θacol<10subscript𝜃acolsuperscript10\theta_{\rm{acol}}<10^{\circ} as a function of s𝑠\sqrt{s}. The curve shows the prediction of ALIBABA. (b) Measured asymmetries for the inclusive and exclusive samples of μ+μsuperscript𝜇superscript𝜇\mu^{+}\mu^{-} and τ+τsuperscript𝜏superscript𝜏\tau^{+}\tau^{-} combined. The curves show the predictions from ZFITTER for the inclusive (solid) and exclusive (dotted) selections as well as the Born-level expectation without QED radiative effects (dashed). The observed cosθ𝜃\cos\theta distributions of the outgoing lepton are shown in (c) to (e) (points) and are compared with Monte Carlo expectations (histograms). The arrows in (c) show the position of the cuts at |cosθe|<0.7subscript𝜃superscript𝑒0.7\left|\cos\theta_{e^{-}}\right|<0.7.
Fig. 8: Rbsubscript𝑅𝑏R_{b} as a function of s𝑠\sqrt{s}. The points are the OPAL measurements and the solid line is the ZFITTER prediction. The errors are the quadrature sum of the statistical and systematic contributions.
Fig. 9: Expected number of events as a function of the Higgs boson mass, MHsubscriptMH\rm{M_{H}}, for the search at s=161.3𝑠161.3\mbox{$\sqrt{s}$}=161.3 GeV (dotted), and at sMZ0𝑠superscriptsubscriptMZ0\mbox{$\sqrt{s}$}\approx\rm{M_{Z}^{0}} (dashed). Combining the searches yields the expectation given by the falling solid line. The 95% confidence level upper limit in the presence of three candidate events is given as the solid horizontal curve. The intersection of the two solid curves, indicated by the arrow, determines our 95% confidence level lower limit on the Higgs boson mass.

Refer to caption

Fig. 10: The 95% confidence level production cross-section contours for (a) e+eχ~1+χ~1superscriptesuperscriptesuperscriptsubscript~𝜒1superscriptsubscript~𝜒1\rm{e^{+}e^{-}}\rightarrow\tilde{\chi}_{1}^{+}\tilde{\chi}_{1}^{-}, and (b) e+eχ~10χ~20superscriptesuperscriptesuperscriptsubscript~𝜒10superscriptsubscript~𝜒20\rm{e^{+}e^{-}}\rightarrow\tilde{\chi}_{1}^{0}\tilde{\chi}_{2}^{0} assuming the decays χ~1±χ~10W±subscriptsuperscript~𝜒plus-or-minus1subscriptsuperscript~𝜒01superscriptWabsentplus-or-minus\tilde{\chi}^{\pm}_{1}\rightarrow\tilde{\chi}^{0}_{1}\rm{W}^{*\pm} and χ~20χ~10Zsubscriptsuperscript~𝜒02subscriptsuperscript~𝜒01superscriptZ\tilde{\chi}^{0}_{2}\rightarrow\tilde{\chi}^{0}_{1}\rm{Z}^{*} occur with 100%percent100100\% branching fraction. These limits have been obtained by combining the results of the s=161𝑠161\mbox{$\sqrt{s}$}=161 GeV and s=130136𝑠130136\mbox{$\sqrt{s}$}=130-136 GeV analyses [23].

Refer to caption Refer to caption Refer to caption

Fig. 11: Distribution of the dijet mass sum in 4-jet events for OPAL data combined from all data samples (s130𝑠130\mbox{$\sqrt{s}$}\geq 130 GeV) after all cuts in the search for anomalous 4-jet production. No W-pair veto has been applied. Plot (a) shows the distribution for the combination with the minimum dijet mass difference, ΔMΔ𝑀\Delta M, plot (b) accumulates the contributions from combinations for the smallest and the intermediate ΔMΔ𝑀\Delta M, and plot (c) contains contributions from all three combinations. Data are shown by points and SM backgrounds by the histogram. The hatched component of the background histogram denotes four-fermion processes (predominantly W+WsuperscriptWsuperscriptW\rm{W^{+}W^{-}}), while the unhatched component denotes Z0/γqq¯superscriptZ0𝛾q¯q\rm{Z}^{0}/\gamma\rightarrow{\rm{q}\overline{\rm{q}}}.
Fig. 12: The accepted cross-sections for each W+WsuperscriptWsuperscriptW\rm{W^{+}W^{-}} decay channel as a function of MWEbeamsubscriptMWsubscriptEbeam\rm{M_{W}}-\rm{E_{beam}}. In each case the functional dependence is parametrised by a second order polynomial. These are used in extracting the mass of the W boson and implicitly account for the four-fermion interference effects.
Fig. 13: Distributions of σWWsubscript𝜎𝑊𝑊\sigma_{WW} as a function of MWsubscriptMW\rm{M_{W}} as predicted by the semi-analytic program GENTLE for s=161.3𝑠161.3\mbox{$\sqrt{s}$}=161.3 GeV. The measured W+WsuperscriptWsuperscriptW\rm{W^{+}W^{-}} cross-section is shown as a shaded band and the corresponding W boson mass by vertical lines. For comparison, our principal measurement of MWsubscriptMW\rm{M_{W}} is shown as a point with error bars. The uncertainties include statistical and systematic contributions, but do not include the effect of the beam energy uncertainty.
Fig. 14: The resolution of the kinematic variables from the qq¯νq¯q𝜈{\rm{q\overline{q}}\ell\nu} events used in the TGC analysis. All distributions show the difference between reconstructed and generated quantities. The solid line is for qq¯eνq¯qe𝜈{\rm{q\overline{q}e}\nu} and qq¯μνq¯q𝜇𝜈{\rm{q\overline{q}}\mu\nu} events and the dashed line is for qq¯τνq¯q𝜏𝜈{\rm{q\overline{q}}\tau\nu} events.
Fig. 15: Likelihood distributions obtained from the cross-section (dotted) and differential distributions (dashed) for the TGC analysis. The solid line is the distribution obtained by adding these together. In all cases the minimum value of the negative log likelihood has been subtracted.