DESY-97-060
Measurement of Elastic Photoproduction at HERA
ZEUS Collaboration
Abstract
The reaction has been studied in interactions using the ZEUS detector at HERA. The cross section for elastic photoproduction has been measured as a function of the photon-proton centre of mass energy in the range GeV at a median photon virtuality of GeV2. The photoproduction cross section, , is observed to rise steeply with . A fit to the data presented in this paper to determine the parameter in the form yields the value . The differential cross section is presented over the range GeV2 where is the square of the four-momentum exchanged at the proton vertex. falls exponentially with a slope parameter of GeV-2. The measured decay angular distributions are consistent with -channel helicity conservation.
The ZEUS Collaboration
J. Breitweg,
M. Derrick,
D. Krakauer,
S. Magill,
D. Mikunas,
B. Musgrave,
J. Repond,
R. Stanek,
R.L. Talaga,
R. Yoshida,
H. Zhang
Argonne National Laboratory, Argonne, IL, USA p
M.C.K. Mattingly
Andrews University, Berrien Springs, MI, USA
F. Anselmo,
P. Antonioli, G. Bari,
M. Basile,
L. Bellagamba,
D. Boscherini,
A. Bruni,
G. Bruni,
G. Cara Romeo,
G. Castellini1,
L. Cifarelli2,
F. Cindolo,
A. Contin,
M. Corradi,
S. De Pasquale,
I. Gialas3,
P. Giusti,
G. Iacobucci,
G. Laurenti,
G. Levi,
A. Margotti,
T. Massam,
R. Nania,
F. Palmonari,
A. Pesci,
A. Polini,
G. Sartorelli,
Y. Zamora Garcia4,
A. Zichichi
University and INFN Bologna, Bologna, Italy f
C. Amelung,
A. Bornheim,
I. Brock,
K. Coböken,
J. Crittenden,
R. Deffner,
M. Eckert,
L. Feld5,
M. Grothe,
H. Hartmann,
K. Heinloth,
L. Heinz,
E. Hilger,
H.-P. Jakob,
U.F. Katz,
E. Paul,
M. Pfeiffer,
Ch. Rembser,
J. Stamm,
R. Wedemeyer6
Physikalisches Institut der Universität Bonn,
Bonn, Germany c
D.S. Bailey,
S. Campbell-Robson,
W.N. Cottingham,
B. Foster,
R. Hall-Wilton,
M.E. Hayes,
G.P. Heath,
H.F. Heath,
D. Piccioni,
D.G. Roff,
R.J. Tapper
H.H. Wills Physics Laboratory, University of Bristol,
Bristol, U.K. o
M. Arneodo7,
R. Ayad,
M. Capua,
A. Garfagnini,
L. Iannotti,
M. Schioppa,
G. Susinno
Calabria University,
Physics Dept.and INFN, Cosenza, Italy f
J.Y. Kim,
J.H. Lee,
I.T. Lim,
M.Y. Pac8
Chonnam National University, Kwangju, Korea h
A. Caldwell9,
N. Cartiglia,
Z. Jing,
W. Liu,
J.A. Parsons,
S. Ritz10,
S. Sampson,
F. Sciulli,
P.B. Straub,
Q. Zhu
Columbia University, Nevis Labs.,
Irvington on Hudson, N.Y., USA q
P. Borzemski,
J. Chwastowski,
A. Eskreys,
Z. Jakubowski,
M.B. Przybycień,
M. Zachara,
L. Zawiejski
Inst. of Nuclear Physics, Cracow, Poland j
L. Adamczyk,
B. Bednarek,
K. Jeleń,
D. Kisielewska,
T. Kowalski,
M. Przybycień,
E. Rulikowska-Zarȩbska,
L. Suszycki,
J. Zaja̧c
Faculty of Physics and Nuclear Techniques,
Academy of Mining and Metallurgy, Cracow, Poland j
Z. Duliński,
A. Kotański
Jagellonian Univ., Dept. of Physics, Cracow, Poland k
G. Abbiendi11,
L.A.T. Bauerdick,
U. Behrens,
H. Beier,
J.K. Bienlein,
G. Cases12,
O. Deppe,
K. Desler,
G. Drews,
U. Fricke,
D.J. Gilkinson,
C. Glasman,
P. Göttlicher,
J. Große-Knetter,
T. Haas,
W. Hain,
D. Hasell,
H. Heßling,
K.F. Johnson13,
M. Kasemann,
W. Koch,
U. Kötz,
H. Kowalski,
J. Labs,
L. Lindemann,
B. Löhr,
M. Löwe14,
J. Mainusch15,
O. Mańczak,
J. Milewski,
T. Monteiro16,
J.S.T. Ng17,
D. Notz,
K. Ohrenberg15,
I.H. Park18,
A. Pellegrino,
F. Pelucchi,
K. Piotrzkowski,
M. Roco19,
M. Rohde,
J. Roldán,
J.J. Ryan,
A.A. Savin,
U. Schneekloth,
W. Schulz20,
F. Selonke,
B. Surrow,
E. Tassi,
T. Voß21,
D. Westphal,
G. Wolf,
U. Wollmer22,
C. Youngman,
A.F. Żarnecki,
W. Zeuner
Deutsches Elektronen-Synchrotron DESY, Hamburg, Germany
B.D. Burow, H.J. Grabosch,
A. Meyer,
S. Schlenstedt
DESY-IfH Zeuthen, Zeuthen, Germany
G. Barbagli,
E. Gallo,
P. Pelfer
University and INFN, Florence, Italy f
G. Maccarrone,
L. Votano
INFN, Laboratori Nazionali di Frascati, Frascati, Italy f
A. Bamberger,
S. Eisenhardt,
P. Markun,
T. Trefzger23,
S. Wölfle
Fakultät für Physik der Universität Freiburg i.Br.,
Freiburg i.Br., Germany c
J.T. Bromley,
N.H. Brook,
P.J. Bussey,
A.T. Doyle,
D.H. Saxon,
L.E. Sinclair,
E. Strickland,
M.L. Utley24,
R. Waugh,
A.S. Wilson
Dept. of Physics and Astronomy, University of Glasgow,
Glasgow, U.K. o
I. Bohnet,
N. Gendner, U. Holm,
A. Meyer-Larsen,
H. Salehi,
K. Wick
Hamburg University, I. Institute of Exp. Physics, Hamburg,
Germany c
L.K. Gladilin25,
R. Klanner, E. Lohrmann,
G. Poelz,
W. Schott26,
F. Zetsche
Hamburg University, II. Institute of Exp. Physics, Hamburg,
Germany c
T.C. Bacon,
I. Butterworth,
J.E. Cole,
V.L. Harris,
G. Howell,
B.H.Y. Hung,
L. Lamberti27,
K.R. Long,
D.B. Miller,
N. Pavel,
A. Prinias28,
J.K. Sedgbeer,
D. Sideris,
A.F. Whitfield29
Imperial College London, High Energy Nuclear Physics Group,
London, U.K. o
U. Mallik,
S.M. Wang,
J.T. Wu
University of Iowa, Physics and Astronomy Dept.,
Iowa City, USA p
P. Cloth,
D. Filges
Forschungszentrum Jülich, Institut für Kernphysik,
Jülich, Germany
J.I. Fleck30,
T. Ishii,
M. Kuze,
M. Nakao,
K. Tokushuku,
S. Yamada,
Y. Yamazaki31
Institute of Particle and Nuclear Studies, KEK,
Tsukuba, Japan g
S.H. An,
S.B. Lee,
S.W. Nam,
H.S. Park,
S.K. Park
Korea University, Seoul, Korea h
F. Barreiro,
J.P. Fernandez,
R. Graciani,
J.M. Hernández,
L. Hervás,
L. Labarga,
M. Martinez, J. del Peso,
J. Puga,
J. Terron,
J.F. de Trocóniz
Univer. Autónoma Madrid,
Depto de Física Teóríca, Madrid, Spain n
F. Corriveau,
D.S. Hanna,
J. Hartmann,
L.W. Hung,
J.N. Lim,
W.N. Murray,
A. Ochs,
M. Riveline,
D.G. Stairs,
M. St-Laurent,
R. Ullmann
McGill University, Dept. of Physics,
Montréal, Québec, Canada b
T. Tsurugai
Meiji Gakuin University, Faculty of General Education, Yokohama, Japan
V. Bashkirov,
B.A. Dolgoshein,
A. Stifutkin
Moscow Engineering Physics Institute, Mosocw, Russia l
G.L. Bashindzhagyan,
P.F. Ermolov,
Yu.A. Golubkov,
L.A. Khein,
N.A. Korotkova,
I.A. Korzhavina,
V.A. Kuzmin,
O.Yu. Lukina,
A.S. Proskuryakov,
L.M. Shcheglova,
A.V. Shumilin,
A.N. Solomin,
S.A. Zotkin
Moscow State University, Institute of Nuclear Physics,
Moscow, Russia m
C. Bokel, M. Botje,
N. Brümmer,
F. Chlebana19,
J. Engelen,
P. Kooijman,
A. Kruse,
A. van Sighem,
H. Tiecke,
W. Verkerke,
J. Vossebeld,
M. Vreeswijk,
L. Wiggers,
E. de Wolf
NIKHEF and University of Amsterdam, Netherlands i
D. Acosta,
B. Bylsma,
L.S. Durkin,
J. Gilmore,
C.M. Ginsburg,
C.L. Kim,
T.Y. Ling,
P. Nylander,
T.A. Romanowski32
Ohio State University, Physics Department,
Columbus, Ohio, USA p
H.E. Blaikley,
R.J. Cashmore,
A.M. Cooper-Sarkar,
R.C.E. Devenish,
J.K. Edmonds,
N. Harnew,
M. Lancaster33,
J.D. McFall,
C. Nath,
V.A. Noyes28,
A. Quadt,
J.R. Tickner,
H. Uijterwaal,
R. Walczak,
D.S. Waters,
T. Yip
Department of Physics, University of Oxford,
Oxford, U.K. o
A. Bertolin,
R. Brugnera,
R. Carlin,
F. Dal Corso,
M. De Giorgi, U. Dosselli,
S. Limentani,
M. Morandin,
M. Posocco,
L. Stanco,
R. Stroili,
C. Voci,
F. Zuin
Dipartimento di Fisica dell’ Universita and INFN,
Padova, Italy f
J. Bulmahn,
R.G. Feild34,
B.Y. Oh,
J.R. Okrasiński,
J.J. Whitmore
Pennsylvania State University, Dept. of Physics,
University Park, PA, USA q
Y. Iga
Polytechnic University, Sagamihara, Japan g
G. D’Agostini,
G. Marini,
A. Nigro,
M. Raso
Dipartimento di Fisica, Univ. ’La Sapienza’ and INFN,
Rome, Italy
J.C. Hart,
N.A. McCubbin,
T.P. Shah
Rutherford Appleton Laboratory, Chilton, Didcot, Oxon,
U.K. o
E. Barberis33,
T. Dubbs,
C. Heusch,
M. Van Hook,
W. Lockman,
J.T. Rahn,
H.F.-W. Sadrozinski,
A. Seiden,
D.C. Williams
University of California, Santa Cruz, CA, USA p
O. Schwarzer,
A.H. Walenta
Fachbereich Physik der Universität-Gesamthochschule
Siegen, Germany c
H. Abramowicz,
G. Briskin,
S. Dagan35,
T. Doeker,
S. Kananov,
A. Levy36
Raymond and Beverly Sackler Faculty of Exact Sciences,
School of Physics, Tel-Aviv University,
Tel-Aviv, Israel e
T. Abe, M. Inuzuka,
K. Nagano,
I. Suzuki,
K. Umemori
Department of Physics, University of Tokyo,
Tokyo, Japan g
R. Hamatsu,
T. Hirose,
K. Homma,
S. Kitamura37,
T. Matsushita,
K. Yamauchi
Tokyo Metropolitan University, Dept. of Physics,
Tokyo, Japan g
R. Cirio,
M. Costa,
M.I. Ferrero,
S. Maselli,
V. Monaco,
C. Peroni,
M.C. Petrucci,
R. Sacchi,
A. Solano,
A. Staiano
Universita di Torino, Dipartimento di Fisica Sperimentale
and INFN, Torino, Italy f
M. Dardo
II Faculty of Sciences, Torino University and INFN -
Alessandria, Italy f
D.C. Bailey,
M. Brkic,
C.-P. Fagerstroem,
G.F. Hartner,
K.K. Joo,
G.M. Levman,
J.F. Martin,
R.S. Orr,
S. Polenz,
C.R. Sampson,
D. Simmons,
R.J. Teuscher30
University of Toronto, Dept. of Physics, Toronto, Ont.,
Canada a
J.M. Butterworth, C.D. Catterall,
T.W. Jones,
P.B. Kaziewicz,
J.B. Lane,
R.L. Saunders,
J. Shulman,
M.R. Sutton
University College London, Physics and Astronomy Dept.,
London, U.K. o
B. Lu,
L.W. Mo
Virginia Polytechnic Inst. and State University, Physics Dept.,
Blacksburg, VA, USA q
J. Ciborowski,
G. Grzelak38,
M. Kasprzak,
K. Muchorowski39,
R.J. Nowak,
J.M. Pawlak,
R. Pawlak,
T. Tymieniecka,
A.K. Wróblewski,
J.A. Zakrzewski
Warsaw University, Institute of Experimental Physics,
Warsaw, Poland j
M. Adamus
Institute for Nuclear Studies, Warsaw, Poland j
C. Coldewey,
Y. Eisenberg35,
D. Hochman,
U. Karshon35,
D. Revel35
Weizmann Institute, Nuclear Physics Dept., Rehovot,
Israel d
W.F. Badgett,
D. Chapin,
R. Cross,
S. Dasu,
C. Foudas,
R.J. Loveless,
S. Mattingly,
D.D. Reeder,
W.H. Smith,
A. Vaiciulis,
M. Wodarczyk
University of Wisconsin, Dept. of Physics,
Madison, WI, USA p
S. Bhadra,
W.R. Frisken,
M. Khakzad,
W.B. Schmidke
York University, Dept. of Physics, North York, Ont.,
Canada a
1 also at IROE Florence, Italy
2 now at Univ. of Salerno and INFN Napoli, Italy
3 now at Univ. of Crete, Greece
4 supported by Worldlab, Lausanne, Switzerland
5 now OPAL
6 retired
7 also at University of Torino and Alexander von Humboldt
Fellow
8 now at Dongshin University, Naju, Korea
9 also at DESY and Alexander von
Humboldt Fellow
10 Alfred P. Sloan Foundation Fellow
11 supported by an EC fellowship
number ERBFMBICT 950172
12 now at SAP A.G., Walldorf
13 visitor from Florida State University
14 now at ALCATEL Mobile Communication GmbH, Stuttgart
15 now at DESY Computer Center
16 supported by European Community Program PRAXIS XXI
17 now at DESY-Group FDET
18 visitor from Kyungpook National University, Taegu,
Korea, partially supported by DESY
19 now at Fermi National Accelerator Laboratory (FNAL),
Batavia, IL, USA
20 now at Siemens A.G., Munich
21 now at NORCOM Infosystems, Hamburg
22 now at Oxford University, supported by DAAD fellowship
HSP II-AUFE III
23 now at ATLAS Collaboration, Univ. of Munich
24 now at Clinical Operational Research Unit,
University College, London
25 on leave from MSU, supported by the GIF,
contract I-0444-176.07/95
26 now a self-employed consultant
27 supported by an EC fellowship
28 PPARC Post-doctoral Fellow
29 now at Conduit Communications Ltd., London, U.K.
30 now at CERN
31 supported by JSPS Postdoctoral Fellowships for Research
Abroad
32 now at Department of Energy, Washington
33 now at Lawrence Berkeley Laboratory, Berkeley
34 now at Yale University, New Haven, CT
35 supported by a MINERVA Fellowship
36 partially supported by DESY
37 present address: Tokyo Metropolitan College of
Allied Medical Sciences, Tokyo 116, Japan
38 supported by the Polish State
Committee for Scientific Research, grant No. 2P03B09308
39 supported by the Polish State
Committee for Scientific Research, grant No. 2P03B09208
| a | supported by the Natural Sciences and Engineering Research Council of Canada (NSERC) |
|---|---|
| b | supported by the FCAR of Québec, Canada |
| c | supported by the German Federal Ministry for Education and Science, Research and Technology (BMBF), under contract numbers 057BN19P, 057FR19P, 057HH19P, 057HH29P, 057SI75I |
| d | supported by the MINERVA Gesellschaft für Forschung GmbH, the German Israeli Foundation, and the U.S.-Israel Binational Science Foundation |
| e | supported by the German Israeli Foundation, and by the Israel Science Foundation |
| f | supported by the Italian National Institute for Nuclear Physics (INFN) |
| g | supported by the Japanese Ministry of Education, Science and Culture (the Monbusho) and its grants for Scientific Research |
| h | supported by the Korean Ministry of Education and Korea Science and Engineering Foundation |
| i | supported by the Netherlands Foundation for Research on Matter (FOM) |
| j | supported by the Polish State Committee for Scientific Research, grant No. 115/E-343/SPUB/P03/120/96 |
| k | supported by the Polish State Committee for Scientific Research (grant No. 2 P03B 083 08) and Foundation for Polish-German Collaboration |
| l | partially supported by the German Federal Ministry for Education and Science, Research and Technology (BMBF) |
| m | supported by the German Federal Ministry for Education and Science, Research and Technology (BMBF), and the Fund of Fundamental Research of Russian Ministry of Science and Education and by INTAS-Grant No. 93-63 |
| n | supported by the Spanish Ministry of Education and Science through funds provided by CICYT |
| o | supported by the Particle Physics and Astronomy Research Council |
| p | supported by the US Department of Energy |
| q | supported by the US National Science Foundation |
1 Introduction
This paper reports new data on the photoproduction of the meson using the ZEUS detector at HERA. It is part of our continuing study of vector meson () production in both the photoproduction [1, 2, 3, 4] and the deep inelastic scattering regimes [5, 6]. Previous results have established a weak dependence on the photon-proton centre of mass energy, , of the vector meson photoproduction cross sections ( with ) if there is no hard scale in the process, as expected from soft diffraction. By contrast, the cross sections for elastic and production in deep inelastic scattering at GeV2 exhibit a stronger dependence ( with ) where sets the hard scale. In the photoproduction of the meson the mass of the itself provides the hard scale and the cross section exhibits a strong dependence ( with ). The total virtual photon-proton cross section [7, 8] also exhibits a change in energy dependence as increases beyond GeV2. Overall, the data illuminate the transition from the soft, non-perturbative regime to the kinematic region where perturbative descriptions become applicable.
photoproduction has been measured as a function of from threshold to GeV in fixed target experiments [9, 10, 11] and extended to GeV at HERA [4, 12, 13]. A review of the low energy experimental results can be found in reference [14]. In this paper we extend our earlier study of elastic photoproduction [4] to include the determination of the differential cross section and the angular distributions of the decay leptons. In addition, the six-fold increase in the size of the data sample allows us to determine the parameter from the data presented here alone.
The was detected via its leptonic (electron pair and muon pair) decay modes in the kinematic range GeV. After a brief description of the ZEUS detector, the data taking conditions, the kinematics of elastic production at HERA, and the event selection are described. The dependence of the cross section , the distribution and the decay angular distributions are then presented.
2 Experimental Conditions
2.1 HERA
During 1994 HERA operated with a proton beam energy of 820 GeV and a positron beam energy of 27.5 GeV. In the positron and proton beams 153 colliding bunches were stored together with 17 unpaired proton bunches and 15 unpaired positron bunches. The time between bunch crossings was 96 ns. The typical instantaneous luminosity was cm-2 s-1.
2.2 The ZEUS Detector
The main ZEUS detector components used in this analysis are outlined below. A detailed description of the ZEUS detector can be found elsewhere [15]. In the following the ZEUS coordinate system will be used, the axis of which is coincident with the nominal proton beam axis, the axis is horizontal and points towards the centre of HERA and the axis completes a right handed coordinate system. The origin of the coordinate system lies at the nominal interaction point.
The momentum and trajectory of a charged particle were reconstructed using the Vertex Detector (VXD) [16] and the Central Tracking Detector (CTD) [17]. The VXD and the CTD are cylindrical drift chambers which are placed in the solenoidal magnetic field of 1.43 T produced by a thin superconducting solenoid. The CTD surrounds the VXD and covers the angular region (where is the polar angle with respect to the proton direction).
The high resolution uranium-scintillator calorimeter CAL [18] surrounding the coil is divided into three parts, the forward calorimeter (FCAL), the barrel calorimeter (BCAL) and the rear calorimeter (RCAL), which cover polar angles from to , to , and to , respectively. Each part consists of towers which are longitudinally subdivided into electromagnetic (EMC) and hadronic (HAC) readout cells.
The proton remnant tagger (PRT), a set of scintillation counters surrounding the beam pipe at small forward angles, serves to tag events with proton dissociation. It is situated at cm and covers the angular range from 6 to 26 mrad.
The muon detectors [19], situated outside the calorimeter, consist of limited streamer tubes (LST) placed both inside and outside the magnetised iron yoke. The inner chambers (BMUI and RMUI) were used to tag the muons from the . The BMUI and the RMUI cover the polar angles between and , respectively.
Proton-gas events occuring upstream of the nominal interaction point are out of time with respect to the interactions and were rejected by timing measurements made by the scintillation counter arrays Veto Wall, C5 and SRTD situated along the beam line at cm, cm, and cm respectively.
The luminosity was determined from the rate of the Bethe-Heitler process where the photon was measured by the LUMI calorimeter located in the HERA tunnel at m [20]. The luminosity was determined with a precision of 1.5% for the measurements presented below.
3 Kinematics
Figure 1a shows a schematic diagram for the reaction:
| (1) |
where each symbol in parentheses denotes the four-momentum of the corresponding particle.
The kinematics of the inclusive scattering of unpolarised positrons and protons are described by the positron-proton centre of mass energy squared () and any two of the following variables
-
•
, the negative four-momentum squared of the exchanged photon;
-
•
, the fraction of the positron energy transferred to the hadronic final state in the rest frame of the initial state proton;
-
•
, the centre of mass energy squared of the photon-proton system, where is the proton mass.
For a complete description of the exclusive reaction (, where denotes a pair of electrons or muons) the following additional variables are required
-
•
, the four-momentum transfer squared at the proton vertex;
-
•
the angle between the production plane and the positron scattering plane in the photon-proton frame, ;
-
•
the polar and azimuthal angles, and , of the decay leptons in the rest frame.
In the present analysis, is not measured because events were selected in which the scattered positron was not detected. In such untagged photoproduction events the value ranges from the kinematic minimum , where is the electron mass, to the value at which the scattered positron starts to be observed in the uranium calorimeter , with a median of approximately . Since the typical is small, the photon-proton centre of mass energy can be expressed as
| (2) |
where and are the laboratory energies of the incoming proton and the and is the longitudinal momentum of the . The four-momentum transfer squared, t, at the proton vertex for is given by
| (3) |
where is the momentum of the transverse to the beam axis. Non-zero values of cause to differ from by less than . A correction is applied to the distribution to correct for this effect as described in section 9.3 [1].
4 Trigger
ZEUS uses a three-stage trigger system [15]. The electron and muon pair triggers are outlined below, followed by a summary of trigger requirements common to both channels.
Electron Channel
The First Level Trigger (FLT) required 1, 2 or 3 track segments to be found in the CTD, with at least one segment pointing to the interaction region. The sum of all the energy deposited in the EMC section of the calorimeter was required to exceed 0.66 GeV. In addition, either the total energy in the calorimeter had to be greater than 2 GeV or the total energy in FCAL (ignoring the cells closest to the beam pipe) had to be greater than 2.5 GeV.
The Second Level Trigger (SLT) required the total energy in the HAC section of the calorimeter to be less than 1 GeV and the total energy in the EMC section to be greater than 1.5 GeV. The ratio of HAC to EMC energy in RCAL and BCAL separately had to be less than 0.1 or the HAC energy had to be less than 0.2 GeV.
The Third Level Trigger (TLT) matched tracks measured in the CTD to electromagnetic energy deposits in the calorimeter. A cluster of contiguous cells, each with an energy of at least 0.3 GeV, was defined as electromagnetic if more than 90% of the total cluster energy was contained in EMC cells. An electron candidate was defined as a track with momentum transverse to the beam direction in excess of 0.4 GeV passing within 30 cm of the centre of an electromagnetic cluster. At least two electron candidates of opposite charge were required. At the distance of closest approach the separation between the two tracks was required to be less than 7 cm. An event was kept if the invariant mass of any pair exceeded 2 GeV.
Muon Channel
At the FLT, track segments had to be found in the inner barrel muon chambers (BMUI) accompanied by a reconstructed energy deposition of at least 0.464 GeV in a CAL trigger tower. Note that on average a muon produces a visible signal of 0.8 GeV in a trigger tower. Alternatively, hits had to be found in the RMUI chambers accompanied by a reconstructed energy deposit of at least 0.464 GeV in an RCAL trigger tower [15]. At least one and no more than five track segments had to be found in the CTD, with at least one pointing to the interaction region.
No requirements were imposed at the SLT.
At the TLT a muon candidate was formed when a track found in the CTD matched a cluster of energy in the calorimeter consistent with the passage of a minimum ionising particle (m.i.p.) and a track in the inner muon chambers. An event containing a muon candidate for which was accepted if the momentum exceeded 1 GeV. The transverse momentum of a muon candidate for which was required to exceed 1 GeV.
Common Requirements
An event was rejected at the FLT if the time of arrival of any signal observed in the Veto Wall, the C5 counter or the SRTD was inconsistent with the time of the bunch crossing. In order to increase the purity of the sample the sum of energy in the inner ring of FCAL was required to be less than 1.25 GeV.
At the SLT, the total energy in the calorimeter () and the component of the momentum () was calculated. The sums run over all calorimeter cells for which the energy, , deposited in the cell is above threshold and the polar angle at which the cell is found is denoted by . Beam-gas events were rejected by exploiting the excellent time resolution of the calorimeter. In order to remove inclusive beam-gas background in time with the bunch crossing, an event was rejected if the ratio was greater than 0.96.
Finally, at the TLT, and were calculated again using the CAL energies reconstructed at the TLT, and an event was accepted if GeV and .
5 Offline Event Selection
To be accepted an event was required to have exactly two tracks of opposite charge with pseudorapidity, , in the range . Denoting the polar angle of a track by , is defined such that . The two tracks were required to fit to a common vertex consistent with an interaction. The tracks had to match to clusters of energy in the calorimeter and events were rejected if more than 1 GeV was deposited in calorimeter cells not associated with either of the two tracks. As shown in equation (2), was determined from the measured of the decay leptons. The requirement that the value of lie in the range GeV restricted the sample to a region of high acceptance. Selection criteria specific to the electron and muon channel are described below.
Electron Channel
The electron sample comes from an integrated luminosity of pb-1. The algorithm used to define the electron pair sample at the TLT was reapplied offline with the final detector calibrations. The transverse momentum threshold of each of the two oppositely charged tracks was increased to 0.8 GeV. In order to reduce contamination from misidentified pions, the energy of at least one of the electromagnetic clusters matched to the tracks by the TLT algorithm applied offline was required to be larger than 1 GeV.
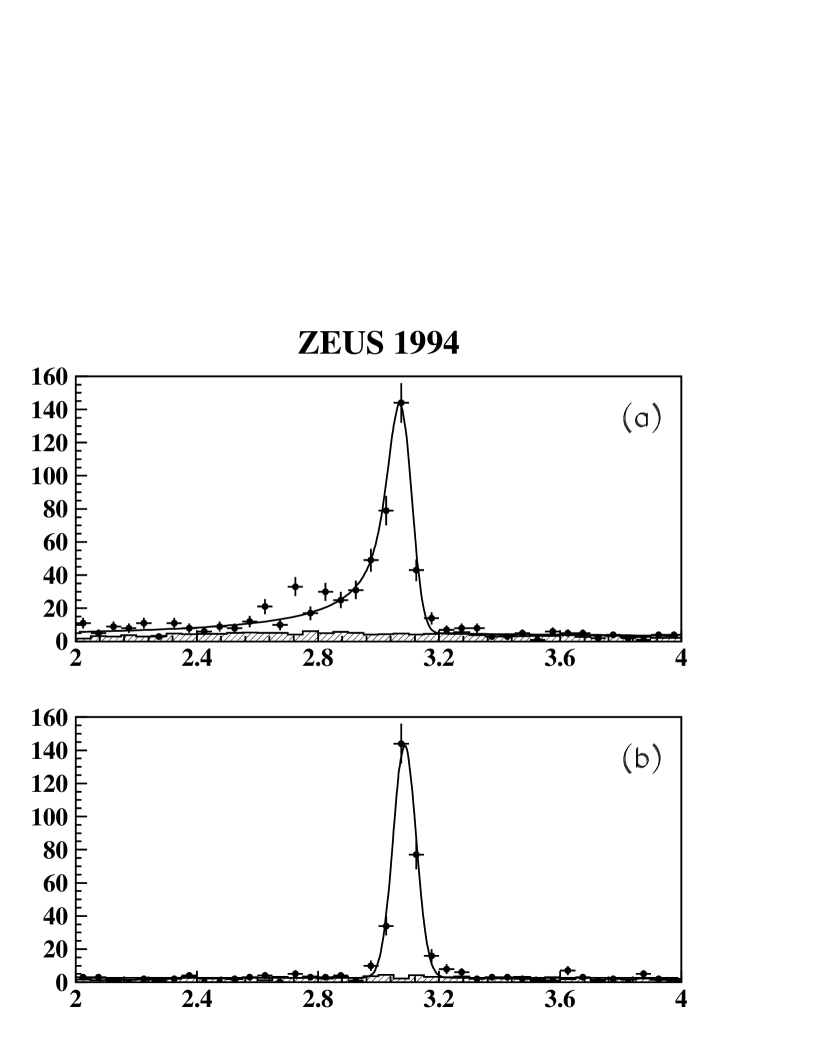
Figure 2a shows the mass distribution of the electron pair sample. A clear peak at the mass is observed. The signal region, GeV, contains 392 events. The cross sections and angular distributions presented below are obtained by calculating acceptances and background contributions for this range. The solid line shows an unbinned likelihood fit in which a Gaussian resolution function has been convoluted with a radiative mass spectrum and a polynomial describing the background. The mass estimated by the fit is GeV, the rms width is MeV, and the number of events attributable to production estimated by the fit over the mass range GeV is .
Muon Channel
The muon sample comes from an integrated luminosity of pb-1. The momentum of each track was required to exceed 1 GeV. At least one of the two tracks had to match a m.i.p. cluster in the calorimeter and a track segment in the barrel or rear muon chambers. To remove cosmic ray contamination the calorimeter signals were required to be in time with the beam crossing and the distance between the two tracks must be less than 2 cm at their distance of closest approach to the beamline. To further reduce the cosmic ray background the tracks were required not to be collinear. This was achieved by calculating the cosine of the angle, , between the two tracks at the interaction point. An event was rejected if .
The mass distribution for the events passing the muon pair selection is shown in figure 2b. A clear peak over a flat background is observed. The signal region, GeV, contains 289 events. The cross sections and angular distributions presented below are obtained by calculating acceptances and background contributions for this range. An unbinned likelihood fit to the sum of a Gaussian signal plus a flat background gives a value of GeV for the mass, MeV for the rms width and for the number of events attributable to production in the mass range GeV.
6 Monte Carlo Simulation and Acceptance Calculation
The reaction (figure 1a) was modelled using the DIPSI Monte Carlo program [21]. This Monte Carlo is based on the model of Ryskin [22] in which it is assumed that the exchanged photon fluctuates into a pair which then interacts with a gluon ladder emitted by the incident proton. The events are generated with a cross section proportional to and with an exponential distribution proportional to . Good agreement between the generated and observed distributions is obtained for and GeV-2. In order to determine the systematic error on the acceptance was varied in the range . The acceptance was found to be insensitive to the variation of in the range GeV-2.
Events were generated in the range GeV and between and GeV2. The centre of mass decay of the was generated with a distribution with . Varying the value of from 1 to 0.4, corresponding to about one standard deviation variation around the measurement presented in section 9.4, the acceptance grows by less than %. A systematic error due to this uncertainty is included in the total systematic error as described in section 8. The effects of positron initial and final state radiation and that of vacuum polarisation loops were neglected; the effects on the integrated cross section have been estimated to be smaller than 4% [1].
The events were then passed through a detailed simulation of the ZEUS detector and trigger. Parameterisations of noise distributions obtained from data taken with a random trigger were used to simulate the calorimeter noise contribution to the energy measurements. The simulated events were subjected to the same reconstruction and analysis programs as the data. The distributions of the reconstructed kinematic quantities obtained using DIPSI are in good agreement with those from the data. The overall acceptance was obtained as the ratio of the number of accepted Monte Carlo events to the number generated in the selected kinematic range. The acceptance, calculated in this manner, accounts for the geometric acceptance, for the detector, trigger and reconstruction efficiencies, and for the detector resolution. Table 1 shows the acceptances in various ranges determined for each decay mode.
7 Background
In addition to elastic photoproduction, the following processes may contribute to the final sample:
-
•
The Bethe-Heitler process in which a lepton pair is produced by the fusion of a photon radiated by the positron with a photon radiated by the proton. This process was simulated using the LPAIR Monte Carlo [23] which was used to generate events in which the proton remains intact (‘elastic’ events) and events in which the proton dissociates (‘dissociative’ events). The size of the Bethe-Heitler contribution to the non-resonant background is shown in figure 2 where the mass distributions are plotted. The QED cross section [24] for the elastic and dissociative Bethe-Heitler processes have been used to determine the normalisation of the appropriate LPAIR Monte Carlo sample. Figure 2 shows that the Bethe-Heitler process saturates the non-resonant background in the muon channel and is the dominant source of non-resonant background in the electron channel. The calculated background due to the Bethe-Heitler process in the signal region is for the electron channel and for the muon channel.
-
•
Pions misidentified as electrons in the electron sample. For masses larger than 2.5 GeV the Bethe-Heitler contribution saturates the non-resonant background. The residual contribution of misidentified pions in the final sample was shown to be less than 1.5% by studying the distribution of obtained using the pulse height information from the CTD. No subtraction has been made for pion misidentification. A systematic error of % attributed to the uncertainty in the pion contamination was included in the final systematic error.
-
•
produced via the production and decay of . The only decay mode giving a significant contribution to the signal is .
-
•
Proton dissociative production (figure 1b). The EPSOFT Monte Carlo was used to simulate this process. EPSOFT is based on the assumption that the diffractive cross section is of the form where is the mass of the dissociative system. The simulation of the hadronisation of the dissociative system includes a parameterisation of the resonance spectrum. To cross-check the results the generator PYTHIA [25] was also used which contains a different parameterisation of the resonance spectrum.
After the subtraction of the Bethe-Heitler contribution, the production of mesons via the decay of the and proton dissociative production are the only significant sources of background and will be discussed separately below.
The contribution was determined using a sample of events in which the decayed to a muon pair (branching ratio [26]). This sample was obtained using the same cuts as those used to isolate the sample (see section 5). A signal of events was found at the mass in a sample for which the integrated luminosity, , was pb-1. The corresponding acceptance, , computed with DIPSI, was . The number of events from production entering the elastic sample via the decay was estimated using the formula
| (4) |
where is the branching ratio for the decay , is that for the decay ( [26], is the luminosity from which the muon sample defined in section 5 was drawn ( pb-1) and is the acceptance for the process (), using DIPSI . The formula (4) leads to a contamination of ()%. This result was cross-checked by selecting events in which the decayed into . In this case events were found at the mass and a contamination of % was estimated. The two results may be combined to give a final estimate of the contamination of %. This contamination was subtracted from both the electron and muon sample.
The proton dissociative process is characterised by a cross section of the form
| (5) |
In order to estimate the value of , dissociative events were selected in which the was accompanied by an energy deposit in the inner ring of FCAL or in the PRT. The value GeV-2 was found to give the best description of the distribution of the PRT tagged sample. The systematic error in the dissociative contribution caused by the uncertainty in was estimated by varying in the range GeV-2. This assumption is consistent with the result GeV-2 reported by the H1 collaboration[13]. The value was used as the central value in the simulation of the distribution and varied in the range to estimate the systematic error. This assumption is consistent with the result recently obtained at Fermilab for the diffractive dissociation of the proton in collisions [27]. The mass of the nucleonic system was generated in the range .
The proton dissociative contribution to the electron sample was determined by selecting a sample, , for which the requirement that GeV was replaced by the three cuts . , and were calculated by summing the energy in the FCAL, BCAL and RCAL respectively. The calorimeter cells associated with the electron candidates were excluded from these sums. The cut on selects dissociative events in which energy is deposited in the proton direction, while the cut on ensures that events in which the scattered positron is detected in RCAL do not enter the sample. The cut on ensures that inelastic events depositing energy in BCAL also do not enter the sample. The proton dissociative sample, , was further examined by studying the distribution of the energy weighted pseudorapidity defined by
| (6) |
where is the energy of a calorimeter cell and is the pseudorapidity of the cell and the sum runs over all cells containing more than 200 MeV but excluding those matched to the tracks forming the candidate. The distribution of for dissociative events, simulated using the EPSOFT Monte Carlo, is strongly peaked at . In the sample there are 2 events for which . The ratio of the number of EPSOFT events passing the elastic cuts to the number with GeV, GeV, GeV and was 58. This leads to a dissociative contribution to the elastic to electron sample of . The first error is statistical and the second error is the systematic error resulting from the allowed variation of in the Monte Carlo generation of dissociative events. When the calculation is repeated with EPSOFT replaced by PYTHIA the result differs by -18% from that reported above. The third error quoted in the dissociative contribution reflects this uncertainty in the simulation of the dissociative final state. The change in the dissociative contribution obtained when was varied in the range GeV-2 was found to be negligible.
The same procedure was applied to the muon sample with the only difference that the cut on was not applied. The proton dissociative sample obtained contained 7 events and the ratio of the number of EPSOFT events passing the elastic cuts to the number with GeV, GeV, GeV was 11. This leads to a dissociative contribution of .
Independent estimates of the dissociative contribution were made using dissociative events tagged by the PRT. EPSOFT was used to estimate the fraction of untagged dissociative events in the elastic sample since it was found that PYTHIA gives a poor description of the multiplicity distribution observed in the PRT. The dissociative contamination estimated in this way was for the electron channel and for the muon channel. The errors quoted are statistical only.
The four independent results were combined to give a final estimate of the dissociative contribution of %.
8 Systematic Errors
Several factors contribute to the systematic errors in the elastic J/ cross section measurement. In the following they are divided in two categories: decay channel specific errors and common systematic errors. The first category contains systematic errors specific to the electron or muon decay channel, while the second contains systematic errors common to both decay channels. Table 2 summarises all these systematic errors.
Decay channel specific errors:
-
•
Trigger: For the electron channel, the dominant systematic error due to the FLT acceptance is given by the requirement GeV. At the SLT the dominant systematic error is contributed by the simulation of the calorimeter noise. For the muon channel, the dominant systematic error is contributed by the uncertainties in the simulation of the trigger threshold and the CTD-FLT track reconstruction. No systematic error in either channel is attributed to the TLT acceptance since all cuts are superseded by more stringent requirements offline.
-
•
Event selection: In this class we include the systematic errors due to uncertainties in the measurement of momentum, transverse momentum, and the choice of the mass window. For the electron channel uncertainties in the cuts used to define an electron cluster also contribute. For the muon channel this class also contains the uncertainties coming from the collinearity cut. Each cut was varied within a range determined by the resolution of the quantity in question and the changes induced in the results were taken as an estimate of the corresponding systematic error. The different systematic errors were summed in quadrature.
-
•
Pion misidentification: This class applies to the electron channel only; the method used to determine the systematic error was described in section 7.
-
•
Muon chamber efficiency: The systematic error attributed to errors in the muon chamber reconstruction efficiency was estimated by using cosmic ray events.
-
•
Branching ratio: The error on the branching ratio as quoted in [26].
Common systematic errors:
-
•
Acceptance: The uncertainty in the acceptance was estimated by varying the parameters and as described in section 6.
-
•
Elastic definition: The systematic uncertainty contributed by the criterion used to classify an event as elastic was estimated by changing the elastic definition: GeV to GeV and to GeV.
-
•
Radiative corrections: The effects of positron initial and final state radiation and that of vacuum polarisation loops were neglected; the effects on the integrated cross section have been estimated to be smaller than 4% [1]. We take 4% as an estimate of the systematic error attributable to this source.
-
•
Helicity distribution: The centre of mass decay of the was generated with a distribution. The systematic error was evaluated by varying the value of from 1 to 0.4.
-
•
distribution in proton dissociation: As explained in section 7 this is obtained by changing the parameter in the range .
-
•
Model of dissociation: The dependence on the modelling of the hadronic final state in proton dissociation was obtained by comparing the contamination obtained using PYTHIA with that obtained using EPSOFT (see section 7).
-
•
contamination: As explained in section 7 the systematic error on the contribution is 1%.
-
•
Luminosity: As indicated in section 2.2 the uncertainty of the luminosity determination is 1.5%.
9 Results
9.1 Integrated Cross Sections
The cross section for elastic electroproduction is given by
| (7) |
where is the integrated luminosity, is the acceptance, is the branching ratio for to decay into electron or muon pairs [26] and is the number of signal events after background subtraction. and were determined in the signal regions defined for the electron and muon channels in section 5. In the range GeV and for GeV2 the electroproduction cross section is
| (8) |
using the electron sample and
| (9) |
using the muon sample. The model error quoted above is due to the difference between the value of the dissociative contribution estimated using EPSOFT and using PYTHIA. In the systematic error we have summed in quadrature all the decay-channel-specific errors and the common systematic errors. The electron and muon cross section results are compatible with each other and with previous measurements in the same range [4, 12, 13].
9.2 Photoproduction Cross Section
The photoproduction cross section is related to the cross section by [28]
| (10) |
where is the mean cross section in a range of and is the effective flux of virtual photons accompanying the positron. The integrals run over the full range of and from to where and are the minimum and maximum values of respectively. The photoproduction cross section has been determined in four bins. The results for each of the lepton decay modes and the combined results are reported in table 1. The procedure described in section 9.1 was used to calculate the errors on the cross sections presented in table 1. For the combined results the following procedure was used. The weighted mean cross section was calculated; the weights being obtained by summing the statistical and decay channel specific errors in quadrature. The first error reported on the combined results in table 1 is the error on the weighted mean, the second error is the sum of the common systematic errors added in quadrature. The third error reported on the combined results in table 1 is the systematic error associated with the model of diffraction. The combined results are shown in figure 3 where is plotted as a function of . The points are plotted at the mean values of reported in table 1. A clear growth of with is observed over the range covered by this experiment.
The ZEUS data in the range GeV were fit to the form with the result . The systematic error was obtained as follows. For each source of systematic error in turn the cross sections were displaced from their central values, the fit was performed and the value recorded. The systematic error on was taken to be . The result of the fit is shown in figure 3a. This value of disfavours that expected in the Donnachie-Landshoff model [29] (the soft pomeron model) in which is expected to take the value in this range. The curve corresponding to the soft pomeron model is shown in figure 3a as a dotted line arbitrarily normalised to the second ZEUS data point.
It is interesting to compare the ratio, , of the cross section for elastic photoproduction to the cross section for elastic production as a function of . At GeV while at GeV [10, 11, 30]. The results presented in the present paper may be combined with those presented in reference [1] to determine that at GeV showing that rises with . These values are to be compared with expected on the basis of the quark charges and a flavour independent production mechanism.
The data are replotted in figure 3b together with other measurements of elastic photoproduction. The results of two pomeron models [31, 32] are shown in figure 3b. In the model of reference [31] the effective pomeron intercept is assumed to depend upon , where is the mass of the charm quark and the constant . The model of reference [32] assumes a fixed pomeron intercept but includes both a scale dependent pomeron coupling and a mass threshold function. Both models give a good description of the data.
Attempts have been made to describe elastic production in perturbative QCD, pQCD. In the approach of Ryskin [22] the pomeron is described as a gluon ladder evaluated in the leading logarithm approximation. In this model the cross section is proportional to , where is the strong coupling constant (assumed fixed and set equal to 0.25) and is the gluon momentum density in the proton. The quantities and are given by
| (11) |
and give the effective momentum fraction and scale at which the gluon density is probed respectively. In the present case both and are negligible in comparison to . For elastic photoproduction takes a value of approximately 2.5 GeV2 [22] while the measurements presented here are sensitive to values of in the range [4]. If a gluon distribution of the form is assumed then the dependence of may be written . The value of reported above gives . This is consistent with our measurement of the gluon distributions based on an analysis of the scaling violations of extrapolated back to GeV2 [33].
Figure 3b shows the results of the pQCD calculation of presented in [34] which extends the Ryskin model beyond leading order and includes the effects of the relativistic motion of the and within the and the rescattering of the pair on the proton. Good agreement with the data is obtained using the MRS-A′ [35] parton distributions. Other choices of parton distributions compatible with HERA measurements of also give an acceptable description of the dependence of over the range GeV.
9.3 Differential Cross Sections
Figure 4a shows the differential photoproduction cross section for the full range ( GeV). The results from the electron and muon samples have been combined using the procedure described in section 9.2. The contribution from proton dissociative production and the Bethe-Heitler process have been subtracted bin by bin. The cross section exhibits the exponential fall characteristic of diffractive processes. A binned likelihood fit to the form
| (12) |
was performed in which the function in equation 12 was integrated and compared with the measured cross section bin by bin. Fitting over the range GeV2 gives the result
| (13) |
The differential cross section may be obtained by dividing bin by bin by a factor which corrects for the small of the photon. Figure 4b shows the correction factor, , which is slowly varying and close to 1 for GeV2. The differential cross section obtained in this way is plotted in figure 4c. Again, the cross section exhibits an exponential fall and a binned likelihood fit to the form
| (14) |
was performed in which the function in equation 14 was integrated and compared with the measured cross section bin by bin. Fitting over the range GeV2 gives the result
| (15) |
The systematic error contains the contribution coming from the uncertainty in the correction factor . The fit for was repeated for GeV2 and GeV2. The small changes in obtained are included in the systematic error quoted in equation 15. The size of the statistical and systematic errors on the parameter prevents us from investigating the dependence of on using the data presented here. The slope is in agreement with the result obtained by the H1 collaboration [12, 13] in the same range. We have previously determined the parameter in elastic , and photoproduction to be GeV-2 [1], GeV-2 [2] and GeV-2 [3] respectively. In geometrical models of vector meson production these results may be interpreted as indicating that the radius of the is smaller than that of the , and . When the parameter is measured in exclusive production in deep inelastic scattering for values in the range GeV2 a value of GeV-2 is obtained which is significantly smaller than the slope obtained in elastic photoproduction [5]. Thus, in exclusive production falls as is raised from 0 reaching a value of GeV-2 at of order 10 GeV2 comparable to that reported here for photoproduction where the hard scale in the scattering process may be set by .
9.4 Decay Angular Distributions
The decay angular distributions can be used to determine elements of the spin-density matrix [36]. In the -channel helicity frame the is at rest and the quantisation axis is taken to lie along the direction in the photon-proton centre of mass system. The decay angular distribution is a function of and , the polar and azimuthal angles of the positive lepton in the helicity frame. The angular distributions can be shown to be [37]
| (16) |
| (17) |
In the present experiment GeV2 so that the is expected to be produced predominantly by transverse photons. If -channel helicity is conserved (SCHC) then the spin density matrix parameters and should be close to zero. Under the assumption of SCHC, can be related to the ratio of the photoproduction cross sections for longitudinal and transverse photons
| (18) |
where is the virtual photon polarisation, i.e. the ratio of the flux of longitudinally polarised photons to the flux of transversely polarised photons. The mean value of over the kinematic range of and sampled by the present experiment is .
The decay angular distributions are presented in figure 5. No subtraction of the dissociative contribution has been made for the distributions presented in figure 5 since it is assumed that the elastic and dissociative processes have the same angular dependence. The distribution of the polar angle of the positive lepton is shown in figure 5a. A fit has been used to determine . The result (which gives ) is consistent with SCHC. The distribution of the azimuthal angle of the positive lepton is shown in figure 5b. The distribution is flat and a fit has been made to determine . Again, the result is consistent with SCHC.
10 Summary
The cross section for elastic photoproduction has been measured using the ZEUS detector at HERA. A significant rise in the cross section with has been observed for in the range GeV. The rise in the cross section with may be parameterised by with . The measured value of is inconsistent with the soft pomeron model. Models based on the vector dominance model plus the exchange of a pomeron can be made to describe the data if the effective pomeron intercept, or the effective pomeron coupling is assumed to depend on the hard scale in the process. QCD based models, which describe the process in terms of the exchange of a gluon ladder evaluated at leading order or beyond leading order, are consistent with the data.
The differential cross section has been measured and falls exponentially with . The slope of the exponential has been measured to be GeV-2 in the range GeV2. In geometrical models of vector meson production these results may be interpreted as indicating that the radius of the is smaller than that of the , and as measured in photoproduction.
The decay angular distributions are consistent with -channel helicity conservation.
Acknowledgements
We thank the DESY Directorate for their strong support and encouragement. The experiment was made possible by the inventiveness and the diligent efforts of the DESY machine group. The design, construction and installation of the ZEUS detector have been made possible by the ingenuity and dedicated efforts of many people from inside DESY and from the home institutes who are not listed as authors. Their contributions are acknowledged with great appreciation.
References
-
[1]
ZEUS Collab., M. Derrick et al.,
Z. Phys C69 (1995) 39.
ZEUS Collab., M. Derrick et al., Z. Phys. C73 (1997) 253. - [2] ZEUS Collab., M. Derrick et al., Z. Phys. C73 (1996) 73.
- [3] ZEUS Collab., M. Derrick et al., Phys. Lett. B377 (1996) 259.
- [4] ZEUS Collab., M. Derrick et al, Phys. Lett. B350 (1995) 120.
- [5] ZEUS Collab., M. Derrick et al., Phys. Lett. B356 (1995) 601.
- [6] ZEUS Collab., M. Derrick et al., Phys. Lett. B380 (1996) 220.
-
[7]
ZEUS Collab., M. Derrick et al.,
Z. Phys. C69 (1995) 607.
ZEUS Collab., M. Derrick et al., Z. Phys. C65 (1995) 379.
ZEUS Collab., M. Derrick et al., Phys. Lett. B316 (1993) 412. -
[8]
H1 Collab., T. Ahmed et al.,
Nucl. Phys. B439 (1995) 471.
H1 Collab., I. Abt et al., Nucl. Phys. B407 (1993) 515. -
[9]
B. Knapp et al., Phys. Rev. Lett. 34 (1975) 1040.
U. Camerini et al., Phys. Rev. Lett. 35 (1975) 483.
B. Gittelman et al., Phys. Rev. Lett. 35 (1975) 1616.
T. Nash et al., Phys. Rev. Lett. 36 (1976) 1233.
BFP Collab., A.R. Clark et al., Phys. Rev. Lett. 43 (1979) 187.
EMC Collab., J.J. Aubert et al., Nucl. Phys. B213 (1983) 1.
NA14 Collab., R. Barate et al., Z. Phys. C33 (1987) 505.
E687 Collab., P.L. Frabetti et al., Phys. Lett. B316 (1993) 197.
NMC Collab., M. Arneodo et al., Phys. Lett B332 (1994) 195. - [10] E401 Collab., M. Binkley et. al., Phys Rev. Lett. 48 (1982) 73.
- [11] E516 Collab., B.H. Denby et al., Phys. Rev. Lett. 52 (1984) 795.
- [12] H1 Collab., T. Ahmed et al, Phys. Lett. B338 (1994) 507.
- [13] H1 Collab., S. Aid et al, Nucl. Phys. B472 (1996) 3.
- [14] S.D. Holmes et al. Ann. Rev. Nucl. Part. Sci. 35 (1985) 397.
- [15] ZEUS Collab., The ZEUS Detector, Status Report, DESY (1993).
- [16] C. Alvisi et al., Nucl. Instr. & Meth. A305 (1991) 30.
-
[17]
N. Harnew et al., Nucl. Instr. & Meth. A279 (1989) 290.
C.B. Brooks et al., Nucl. Instr. & Meth. A283 (1989) 477.
B. Foster et al., Nucl. Instr. & Meth. A338 (1994) 254. -
[18]
M. Derrick et al., Nucl. Instr. & Meth. A309 (1991) 77.
A. Andresen et al., Nucl. Instr. & Meth. A309 (1991) 101.
A. Bernstein et al., Nucl. Instr. & Meth. A336 (1993) 23. - [19] G. Abbiendi et al., Nucl. Instr & Meth. A333 (1993) 342.
-
[20]
D. Kisielewska et al., DESY-HERA 85-25 (1985),
J. Andruszkw et al., DESY-92-066 (1992). - [21] M. Arneodo, L. Lamberti and M.G. Ryskin, Comp. Phys. Comm. 100 (1997) 195.
- [22] M.G. Ryskin, Z. Phys C57 (1993) 89.
- [23] S.P. Baranov et al., Proc. of the Workshop ‘Physics at HERA’, Vol. III, Oct. 1991, 1478.
- [24] J.A.M. Vermaseren, Nucl.Phys., B229 (1983) 347.
-
[25]
T. Sjöstrand and M. Bengtsson,
Comp. Phys. Comm. 43 (1987) 367.
M. Bengtsson and T. Sjöstrand, Comp. Phys. Comm. 46 (1987) 43.
T. Sjöstrand, Proc. of the Workshop ‘Physics at HERA’, Vol. III, Oct. 1991, 1405. - [26] Particle Data Group, R.M. Barnett et al., Phys. Rev. D54 (1996) 1.
- [27] CDF Collab., F. Abe et al., Phys. Rev. D50 (1994) 5535.
-
[28]
V.N. Gribov et al., Sov. Phys. JETP 14 (1962) 1308.
V.M. Budnev et al., Phys. Rep. 15C (1975) 181. - [29] A. Donnachie and P.V. Landshoff, Phys. Lett. B348 (1995) 213.
- [30] R.M. Egloff et al., Phys. Rev. Lett. 43 (1979) 657.
- [31] L.P.A. Haakman, A. Kaidalov, J.H. Koch, Phys. Lett. B365 (1996) 411.
- [32] L.L. Jenkovszky, E.S. Martynov and F. Paccanoni, Novy Svet Hadrons (1996) 170.
- [33] ZEUS Collaboration, M. Derrick et al., Phys. Lett. B345 (1995) 576.
- [34] M.G. Ryskin, R.G. Roberts, A.D. Martin, E.M. Levin, RAL-TR-95-065.
- [35] A.D. Martin, W.J. Stirling, R.G. Roberts, Phys. Lett. B354 (1995) 155.
-
[36]
K. Schilling et al., Nucl. Phys B15 (1970) 397.
K. Schilling and G. Wolf, Nucl. Phys. B61 (1973) 381. -
[37]
B. Humpert and A.C.D. Wright, Phys. Let. B65 (1976) 463.
B. Humpert and A.C.D. Wright, Phys. Rev. D15 (1977) 2503. - [38] J.J. Sakurai, Phys. Rev. Lett. 22 (1969) 981.
| Range | Mode | (nb) | (nb) | (nb) | |||
| (GeV) | combined | ||||||
| 40-60 | 0.0411 | ||||||
| 0.0411 | |||||||
| 60-80 | 0.0266 | ||||||
| 0.0266 | |||||||
| 80-100 | 0.0189 | ||||||
| 0.0189 | |||||||
| 100-140 | 0.0251 | ||||||
| 0.0251 |
| Breakdown of Contributions to the Systematic Error | ||||||||
|---|---|---|---|---|---|---|---|---|
| Values are quoted in percent | ||||||||
| Decay Channel Specific Systematic Errors | ||||||||
| Electron Channel | Muon Channel | |||||||
| bin (GeV) | 40-60 | 60-80 | 80-100 | 100-140 | 40-60 | 60-80 | 80-100 | 100-140 |
| Trigger | ||||||||
| Event selection | ||||||||
| Pion misidentification | ||||||||
| Muon chamber | ||||||||
| efficiency | ||||||||
| Branching ratio | ||||||||
| Subtotal | ||||||||
| Common Systematic Errors | ||||||||
| bin (GeV) | 40-60 | 60-80 | 80-100 | 100-140 | ||||
| Acceptance | ||||||||
| Elastic definition | ||||||||
| Radiative corrections | ||||||||
| Helicity distribution | ||||||||
| Proton dissociation | ||||||||
| Model of dissociation | ||||||||
| contamination | ||||||||
| Luminosity | ||||||||
| Total Systematic Errors | ||||||||
| Electron Channel | Muon Channel | |||||||
| bin (GeV) | 40-60 | 60-80 | 80-100 | 100-140 | 40-60 | 60-80 | 80-100 | 100-140 |
| Total | ||||||||