Production of charm mesons at high transverse momentum
in 515 GeV/ -nucleon collisions
Abstract
We present results on the production of high transverse momentum charm mesons in collisions of 515 GeV/ negative pions with beryllium and copper targets. The experiment recorded a large sample of events containing high transverse momentum () showers detected in an electromagnetic calorimeter. From these data, a sample of charm mesons has been reconstructed via their decay into the fully charged mode. A measurement of the single inclusive transverse momentum distribution of charged mesons from 1 to 8 GeV/ is presented. An extrapolation of the measured differential cross section yields an integrated cross section of b per nucleon for mesons with . The data are compared with expectations based upon next-to-leading order perturbative QCD, as well as with results from pythia. We also compare our integrated cross section with measurements from other experiments.
pacs:
PACS number(s): 13.85.Ni, 14.40.Lb, 13.60.Hb, 13.85.-tI INTRODUCTION
Over the past decade, measurements of charm production in hadronic interactions have provided valuable tests of the applicability of perturbative QCD (pQCD) to the production of heavy quarks[1, 2, 3, 4]. Quark-antiquark annihilation and gluon fusion are the leading order (LO) contributors to charm quark hadroproduction. The next-to-leading order (NLO) contributions to the cross sections have been evaluated[5, 6, 7, 8], and are comparable to the leading-order contributions. While the results of the NLO calculations can accommodate the charm cross sections observed in -nucleon interactions[9, 10, 11, 12, 13, 14, 15], the large size of the NLO contributions is an indication that still higher order contributions may be significant. Furthermore, NLO calculations of the total charm quark cross section exhibit significant sensitivity to the choice of input parameters, including the charm quark mass (), the renormalization and factorization scales, as well as the parton distribution functions (PDF’s). For example, the calculated charm cross section changes by a factor of 3 when the renormalization scale is varied from to . Varying the charm quark mass from 1.2 GeV/ to 1.8 GeV/ changes the calculated charm cross section by as much as an order of magnitude[16, 17]. While there is significant theoretical uncertainty in the total charm quark production cross section, there is less uncertainty in the shapes of the differential distributions. The shapes of the LO and NLO single inclusive charm quark distributions versus are rather similar, and their shapes exhibit smaller sensitivity to variations in or the renormalization scale[16, 18].
To compare measurements of charm hadron production to the results of pQCD calculations, the consequences of hadronization of the produced charm quarks must be taken into account. The fragmentation of charm quarks into charm hadrons is inherently a low momentum transfer process, and is therefore currently beyond the domain of pQCD. Nevertheless, the effects of fragmentation may be described phenomenologically by convoluting the partonic cross sections with a suitable fragmentation function. One hopes to describe the hadronization of charm quarks via a universal, process-independent fragmentation function, such as the Peterson et al.[19] form, as measured in collisions. Convoluting the NLO prediction for charm quark production with a fragmentation function results in a softening of the predicted spectrum of the charm hadrons relative to the charm quarks. The Peterson et al. fragmented NLO result is softer than the measured spectrum for charm hadrons, and it has been observed that the unfragmented NLO result for charm quarks reproduces the shape of observed charm hadron spectra reasonably well in the kinematic range and GeV/[1]. One might expect additional nonperturbative effects, such as the intrinsic transverse momentum of the incoming partons, to have an impact on the measured differential distributions. Frixione et al.[1] noted that the Peterson et al. fragmented NLO calculations of the charm spectra can be brought into agreement with data from experiments E769 and WA82, provided the partons (in each hadron) are supplemented with an average squared intrinsic transverse momentum, =2.0 (GeV/)2.
It is also of interest to compare the data with a Monte Carlo (MC) simulation that incorporates a model of the fragmentation process (such as the LUND string model[20] as implemented in pythia). Again, nonperturbative effects may need to be taken into account to match the experimental results. pythia simulates the so-called “leading particle effect”, which results in an enhanced forward production for mesons whose light quark is a spectator valence quark from the incoming beam particle. In addition to initial state radiation effects, pythia also includes additional intrinsic transverse momentum characterized by the parameter [21]. Reasonable agreement has been achieved between a pythia MC simulation and the E769 data using a value of 1 GeV/[22].
Fermilab experiment E706[23] was designed to study high phenomena, principally associated with direct photons[24, 25] and high jets[26]. Jets arising from large momentum transfer collisions are expected to be rich in high charm particles. The high requirement of the E706 trigger enhances the fraction of selected events containing charm by nearly an order of magnitude compared to a minimum bias trigger. Since the selected events result from high transverse momentum interactions, the data constitute a unique sample in which to study charm particles (other recent fixed target charm experiments frequently employed lower threshold or minimum bias triggers, and yielded a rich sample of mostly lower events). From a theoretical standpoint, one might expect the pQCD calculations to become more reliable in the kinematic range accessible to E706. This paper presents results of a study of high charm particles produced in 515 GeV/ -nucleon collisions. The measured differential cross sections are compared to NLO pQCD calculations and results from a pythia MC simulation. We also compare the integrated cross section with NLO pQCD calculations and other recent measurements.
II APPARATUS
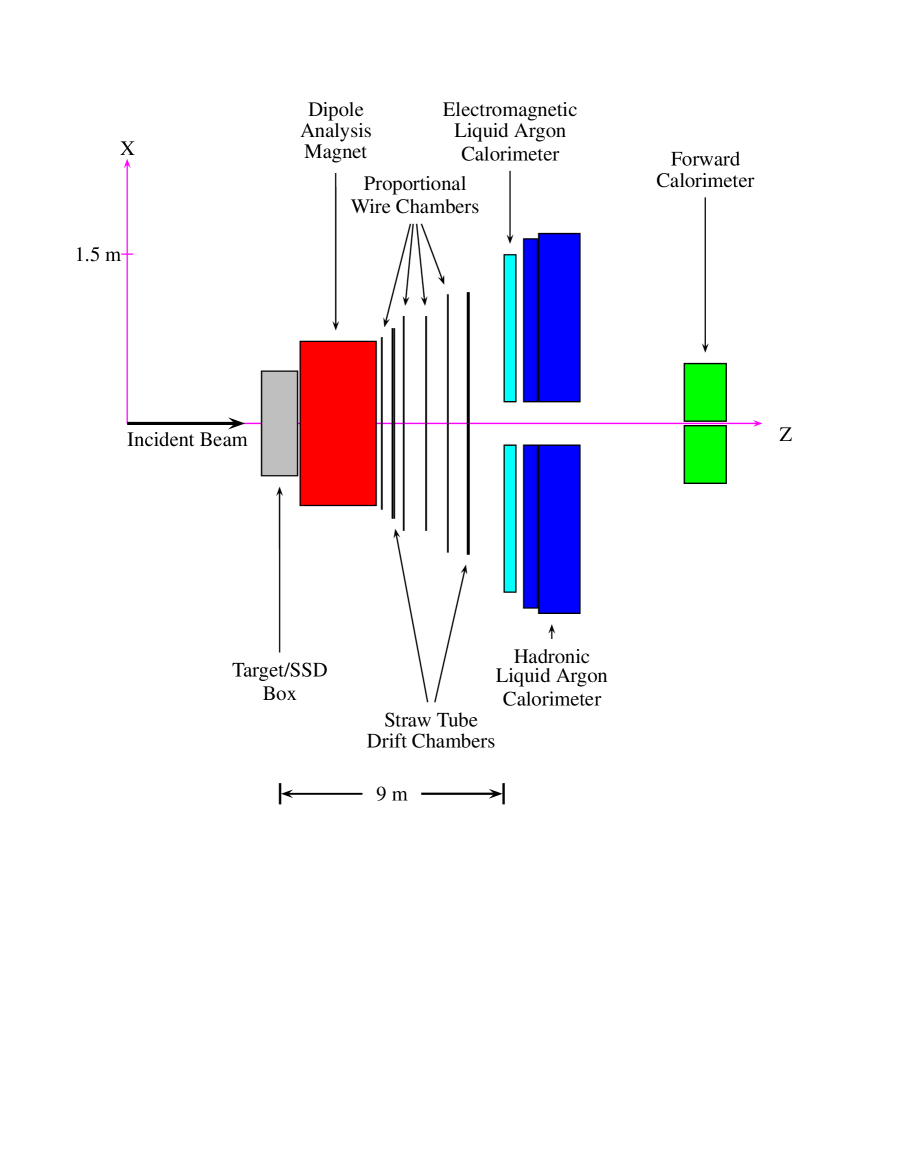
Experiment E706 was performed in the Fermilab Meson West beam line. The unseparated negative secondary 515 GeV/ beam was primarily composed of pions with a small admixture of kaons (5%). Figure 1 displays a diagram of the key elements of the Meson West spectrometer for this measurement[27]. The detector included a precision charged particle tracking system and a large acceptance liquid argon calorimeter (LAC). The charged tracking system employed silicon microstrip detectors (SSD), a large aperture dipole analysis magnet, proportional wire chambers (PWC), and straw tube drift chambers (STDC). The LAC contained a finely segmented electromagnetic section (EMLAC) as well as a hadronic section. The high trigger was based upon signals originating from showers detected in the EMLAC. Only data from the charged particle tracking system and the electromagnetic section of the calorimeter contributed directly to this analysis.
A Charged particle tracking system
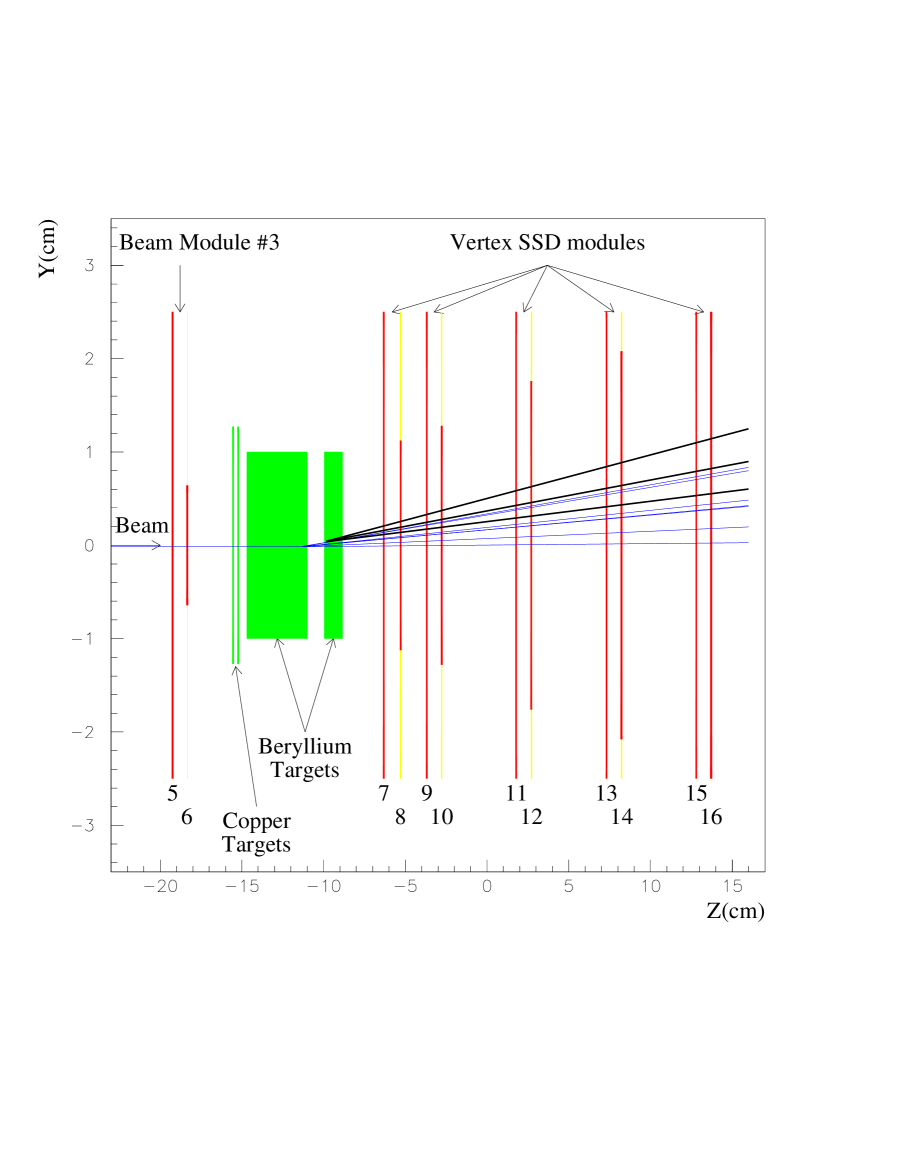
The target region of the Meson West spectrometer (shown in Fig. 2) consisted of nuclear targets and a SSD system[28]. The targets included two 780 m thick copper pieces followed by two beryllium cylinders of length 3.71 cm and 1.12 cm, respectively. A 1 cm air gap between the two beryllium cylinders was designed for use in searches for heavy quark decays[29]. The targets were supported in a Rohacell stand which had a cylindrical hole bored along the beam axis where the targets were positioned. Three beam SSD modules were located upstream of the target and 5 vertex SSD modules were located downstream of the target. Each module was composed of a pair of single-sided SSD planes with strips aligned vertically and horizontally along the and axes, respectively. All of the SSD planes were 50 m pitch detectors, with the exception of the pair of vertex SSD’s nearest the target, which consisted of a high resolution 25 m pitch central region and 50 m pitch outer regions. A total of 8912 strips were instrumented, providing an angular acceptance of 125 mrad in each view.
A large dipole analysis magnet was located downstream of the SSD system. Charged particles passing through the magnet received a impulse of 450 MeV/ in the horizontal plane. Four PWC stations[30, 31] were located downstream of this dipole analysis magnet, each separated by 1 m. Each station consisted of four proportional wire sense planes with wires oriented at the angles ( view), ( view), ( view), and ( view). Thus, the and views were orthogonal to one another, as were the and views. Within each sense wire plane, the spacing between the sense wires was 0.254 cm. A total of 13,440 sense wires were instrumented. The STDC system[32] consisted of two stations, with each station consisting of 4 view planes followed by 4 view planes. The and view planes in the upstream station consisted of 160 and 128 tubes, respectively. Each tube had a diameter of 1.03 cm. Each plane of the downstream STDC consisted of 168 tubes, and each tube had a diameter of 1.59 cm. The hit resolution of individual tubes in the STDC’s was typically in the range of 200 to 300 m.
B Electromagnetic calorimeter
The EMLAC[33, 34], which was located 9 m downstream of the target, was assembled from four independent quadrants, each of which instrumented of the azimuthal acceptance of the detector. The inner and outer radii of the EMLAC were 20 cm and 160 cm respectively, corresponding to a center of mass rapidity coverage of to 1 (for the incident 515 GeV/ beam). Each quadrant was composed of 66 layers. Each layer consisted of an absorber sheet (which was 2 mm of lead in all but the first layer), a 2.5 mm liquid argon gap, a pair of octant-size copper-clad G-10 anode boards, and another 2.5 mm argon gap. In alternating layers, the copper cladding of the G-10 anode boards was cut to form either concentric (R) strips or azimuthal () strips. The locations and widths of the R strips on the radial anode boards were such that the R strips were focussed on the target region so that neutral particles produced in the target passed through the same R strip in each successive radial anode board. The width of the R strips on the first anode board was 5.5 mm. The interleaved azimuthal anode boards were subdivided at a radius of 40 cm into inner and outer regions. Each of the inner strips subtended an angle of radians in azimuth while the outer strips subtended an angle of radians. Longitudinally, the EMLAC was read out in two sections. The front section consisted of the first 22 layers (8.5 radiation lengths) while the back consisted of the remaining 44 layers (18 radiation lengths). For each section in each octant, signals from corresponding R () strips were ganged together and read out independently.
C Trigger
The trigger selected events producing high transverse momentum showers in the EMLAC. This event selection process involved four stages; beam and interaction definitions, a pretrigger requirement, and the final trigger requirements[35]. The beam definition required that a single beam particle was detected in the beam hodoscope located 2 m upstream of the target. A scintillation counter with a inch diameter hole was located downstream of the beam hodoscope and was used to reject interactions initiated by particles in the beam halo. Pairs of interaction counters were mounted near the upstream and downstream mirror plates of the dipole analysis magnet. An interaction was defined as a coincidence between signals from at least two of these four interaction counters. To minimize potential confusion due to out-of-time interactions, a cleaning filter rejected any interactions that occurred within 60 ns of each other. For those interactions that satisfied the beam and interaction definition, the deposited in various regions of the EMLAC was evaluated by weighting the energy signals from the EMLAC R channel amplifier fast outputs by , where is the polar angle that the strip subtends with respect to the nominal beam axis. The pretrigger requirement was satisfied if the detected in the inner 128 R channels or the outer 128 R channels of at least one octant was greater than a threshold of 1.7 GeV/ (for the PRETRIGGER HI). A pretrigger signal was issued only if the signals from a given octant satisfied that pretrigger requirement and there was no evidence in that octant of substantial noise or significant attributable to an earlier interaction and there was no incident beam halo muon detected[36]. The pretrigger signal latched the data from the various subsystems while the final trigger decision was being evaluated.
The experiment employed several different high trigger definitions that were based upon the LOCAL and GLOBAL signals from octants that satisfied the pretrigger. Local trigger groups were formed by clustering the 256 R channels in each octant into 32 groups of 8 channels. Each of the adjacent pairs of groups of 8 channels (groups 1&2, 2&3, , 31&32) formed a local group of 16 strips. If the detected in any of these groups of 16 was above a specified high (or low) threshold, then a LOCAL HI (or LO) signal was generated for that octant. A GLOBAL HI (or LO) signal for a given octant was generated if the summed from the groups of 8 in that octant was above a specified high (or low) threshold. In order to suppress coherent noise effects, only groups of 8 registering at least 250 MeV/ contributed to this global sum. (This cutoff was applied independently to signals from groups of 8 from the front and back sections of the EMLAC.) Three of the trigger types, which accounted for 80% of the E706 data, were used in this charm analysis; they were the SINGLE LOCAL HI, the LOCALGLOBAL HI, and the TWO-GAMMA triggers. The SINGLE LOCAL HI trigger required a LOCAL HI signal from an octant that satisfied the PRETRIGGER HI. The LOCAL HI threshold was 3 GeV/. The LOCALGLOBAL HI trigger required the coincidence of a LOCAL LO signal (threshold 1.7 GeV/), a GLOBAL HI signal (threshold 3 GeV/), and a PRETRIGGER HI all from the same octant[37]. The TWO-GAMMA trigger required LOCAL LO signals from any two octants that were separated by at least 90∘ in azimuth, where both octants also satisfied the lower threshold PRETRIGGER LO requirement.
In addition to the high triggers, a prescaled sample of low bias triggers were recorded concurrently. These low bias triggers included beam, interaction and pretrigger events, and constituted 10% of the recorded events.
III CHARGED TRACK RECONSTRUCTION
The charged tracks in the selected events were reconstructed first in the PWC system. Since the PWC system consisted of four views, three-dimensional (3D) information was extracted. Space tracks were formed by combining all possible () candidate track segments and searching for hits along the projections in the remaining two views. Space tracks were required to have a minimum of 11 hits if they involved all four PWC stations (16 planes), 10 hits if they involved three PWC stations (12 planes), and 6 hits if they involved only the two upstream PWC stations (8 planes).
The STDC pattern recognition was initially seeded by the 3D space tracks reconstructed in the PWC system (in order to correlate the hits in the and views of the straw tubes). Once the correlation was performed, an iterative procedure was used to form straw tracks using only the hits detected in the STDC’s. Straw track segments required a minimum of 4 hits in either the or view. The angular resolution of straw tracks was 0.06 mrad. After reconstructing the straw track segments, each space track was refit using the hit information from both the PWC and STDC systems.
After identifying the downstream space tracks, track segments were reconstructed in the and views of the SSD system. Four and five hit tracks were reconstructed, and then three hit tracks were formed from the previously unused hits. The SSD tracks had an average angular resolution that was similar to the STDC’s, and an impact parameter resolution at the primary vertex of 15 m (for GeV/). Track segments were also reconstructed from the hits in the beam SSD modules to measure the direction of the incident beam particle.
Three dimensional tracks were formed in the SSD system by linking the projected 3D downstream (PWC and STDC) tracks to corresponding projected SSD and track segments at the center of the analysis magnet. In the bend plane of the analysis magnet, a link between an SSD track segment and a downstream space track was established if the corrected difference between the positions at the magnet center of the projected SSD X track segment and the projected downstream track was within 3.3. A link between an SSD track segment and a downstream space track occurred when the corrected difference between the positions of the projected tracks at the magnet center was within 3.3 and the corrected slope difference between the tracks was within 3.3 [38]. The matching resolutions for the projections ( and ) and the slopes () were momentum dependent functions which were extracted from the data. SSD and view track segments were correlated with each other by virtue of being linked to the same downstream space track. Once the linking was complete, the primary vertex for the event was reconstructed[39]. Figure 3 shows a distribution of reconstructed primary vertex locations along the nominal beam direction ( axis) for events accumulated during the 1990 fixed target run. Based upon the primary vertex location, one can identify whether the interaction occurred in the beryllium, copper, or silicon (SSD) targets. The average resolution for the location of the primary vertex was 300 m. After the primary vertex was located, the direction cosines, charge, and momentum of each reconstructed charged track were evaluated. (The momentum scale was calibrated using and signals.) The average momentum resolution for charged tracks produced in the target region was , where is the momentum measured in GeV/.
After the full sample of events was reconstructed and the results written in the form of data summary tapes (DSTs), a secondary vertex analysis was performed to search for evidence of heavy quark production. Only events that had a reconstructed primary vertex in the copper or beryllium targets were used in this analysis ( cm cm). For each event, tracks having large transverse significance to the primary vertex were identified as secondary tracks. Transverse significance is defined as the measured impact parameter between a vertex and a given track candidate divided by the corresponding expected uncertainty. The algorithm evaluated all pairs of secondary tracks and selected only those pairs that were consistent with emanating from the same space point. For all such combinations, the algorithm determined whether any other secondary tracks had transverse significance of less than 3 units relative to the space point in question. All such tracks were added to the track list associated with that secondary vertex, and the vertex location and its associated uncertainties were reevaluated (via a minimization technique). A list of vertices, each determined by two or more space tracks was thus generated. Two track vertices were referred to as vees and all other vertices were referred to as secondary vertices. To minimize the losses introduced by only utilizing secondary tracks, all space tracks in the event were examined to determine whether they might belong to any given secondary vertex or vee. This phase of the program generated a list of additional tracks that might possibly belong to each of the secondary vertices or vees. Neither the secondary vertices nor the vees were refit with any of these additional tracks. Only those events with at least one reconstructed secondary vertex or vee contributed to this analysis.
IV CHARM SIGNALS IN THE E706 DATA
From the data sample acquired during the 1990 fixed target run, we have identified , , and signals in fully charged modes. The and signals (see Fig. 4) do not directly contribute to the measurements presented in this report, which are based upon the sample of mesons that were observed via their decay to the fully charged final state . The sample was extracted from the subset of events that contained at least one secondary vertex with 3 tracks or a vee with additional tracks attached to it. For all such vertices (vees), the three-body invariant mass was evaluated by assigning the charged pion mass to each of the two like-charge tracks while the oppositely charged track was assigned the kaon mass. To reduce the large combinatorial background, only secondary vertices that satisfied additional requirements contributed to the final analysis. The significant requirements were: (1) the impact parameter to the primary vertex of the parent momentum vector formed from the candidate decay products must be less than 50 m; (2) the longitudinal separation between the primary and secondary vertex normalized by the corresponding expected uncertainty in that separation must be at least six; (3) the impact parameter of each candidate decay track to the secondary vertex (vee) must be less than 0.4 of the corresponding impact parameter to the primary vertex for every candidate decay track that contributed to the determination of the secondary vertex (vee) location; (4) for those tracks that contributed to the secondary vertex finding, the product of the secondary to primary vertex impact parameter ratios must be less than 0.005 for secondary vertices or less than 0.002 for vees.
Figure 5 shows the invariant mass spectrum from the events satisfying the above analysis requirements. The mass distribution contains 110 17 combinations above background in the mass region (1.8 to 1.94 GeV/) with and GeV/. Figure 6, which shows mass spectra in several intervals, illustrates the broad range populated by this sample. This large range is a consequence of the E706 trigger, which preferentially selected high interactions. The high trigger thresholds coupled with the large combinatorial background compromise our ability to observe a significant signal for mesons with GeV/ [as indicated in Fig. 6(a)]. (The main source of background is secondary interactions in the target.) The signal region was defined to be between 1.80 and 1.94 GeV/, except for the interval GeV/, where a narrower mass range of 1.82 to 1.92 GeV/ was employed. This more restrictive mass requirement reduces the statistical uncertainty with only a minimal loss of efficiency. Since the resolution of the reconstructed signal (19 MeV) observed in the data and our MC simulation were consistent, the small loss of events resulting from the narrower mass range was absorbed into the reconstruction efficiency. The background in the signal region was estimated via a linear interpolation between the lower and upper sideband regions. The uncertainty in the number of background combinations was estimated by fitting the background to first and second order polynomials over several mass regions (which included the signal region).
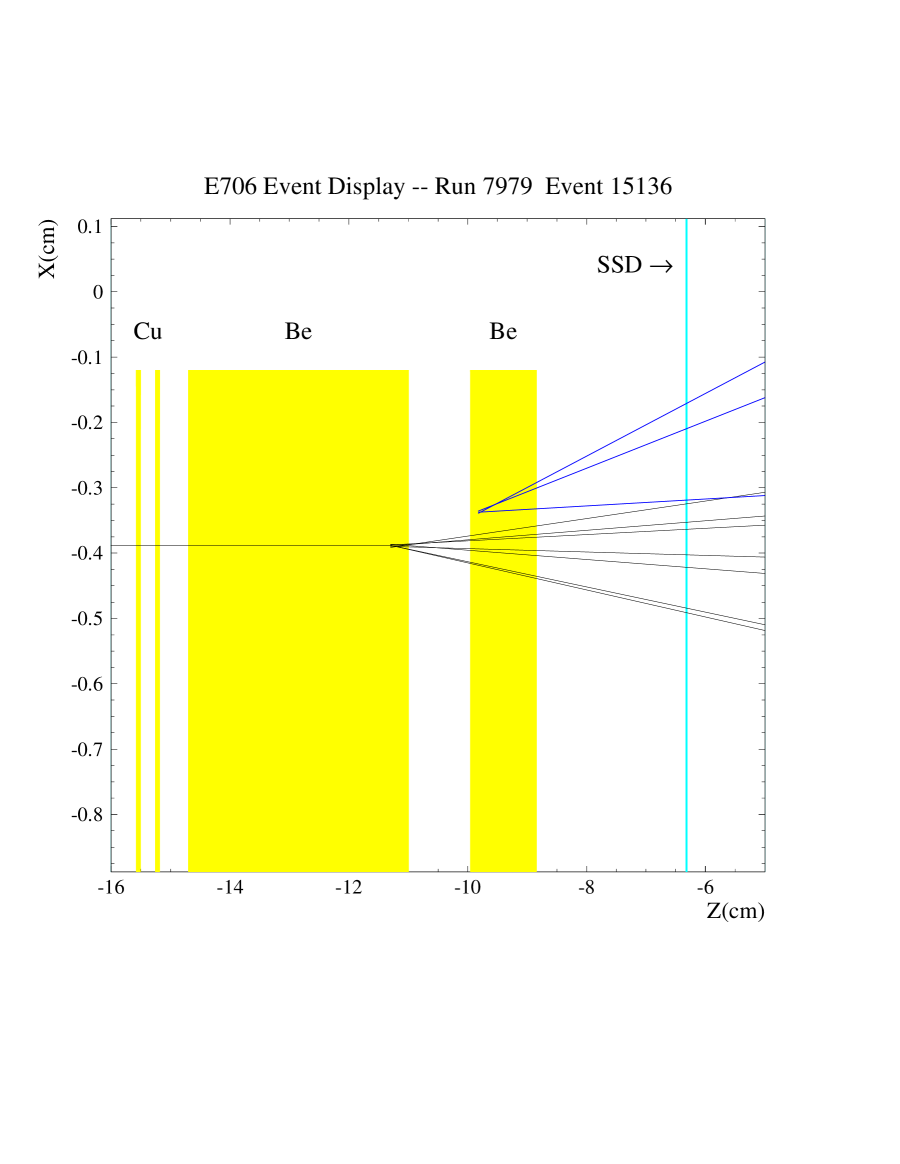
Figure 7 shows the tracks from an event containing a reconstructed charm particle candidate with a of 4.1 GeV/. The figure shows the various target elements, the first vertex SSD plane, and the projected charged tracks from the event which reveal a primary vertex and a displaced three-track secondary vertex. Due to the high transverse momentum of the charm candidate, the secondary vertex is well isolated from the other charged tracks in the event. Note that the vertical scale is magnified with respect to the horizontal scale; the polar angle of the widest angle track is no more than about .
V EFFICIENCIES
An event simulation was used to estimate the efficiency for selecting events containing charged mesons and for detecting those decays. The simulation includes an event generator and a detector simulation. The event generator simulates particle production in high energy collisions, and the detector simulation models the response of the detectors to the generated particles. The details of this simulation and the evaluation of the efficiencies are discussed below.
A Event generation
The event generator chosen to produce full events was the pythia 5.6/jetset 7.3 package[40]. The physics processes employed in the event generation are specified by the user. The physics processes investigated in this analysis included minimum bias events and a pure charm event sample. The former was used to tune the MC parameters to match the global characteristics of events observed in the data. Once the MC simulation was tuned, the efficiencies for triggering on and selecting events containing charm particles were evaluated using the pure charm event sample. pythia describes the hard scattering between hadrons via leading order perturbative QCD matrix elements, and simulates the NLO contributions through effective K factors[40, 41]. Parton showers are produced via perturbative branchings of one parton into two or more partons. The pythia simulation also includes initial state radiation of the incoming partons, which by default, is activated. jetset handles the nonperturbative fragmentation of the final state colored partons into colorless hadrons using the LUND string model[20]. In addition, jetset handles the decays of unstable particles via a list of decay modes and branching ratios that are extracted from Particle Data Group tables. For each event, the event generator provides a list of the resulting stable particles (and their associated kinematic variables) that can be used as input to the E706 detector simulation. The detector simulation is based upon the geant software package[42].
The event generator was first tuned to match various distributions observed in our data which were relevant to this analysis. Since the trigger discriminated using electromagnetic depositions, it is important to reproduce the spectrum of particles that produce electromagnetic showers. Figure 8 shows the spectrum of ’s measured in the data and the corresponding spectra generated by pythia for several choices of the parameter. The data distribution was measured using the low bias triggers, and the MC spectrum was generated using minimum bias events. In each case, the MC spectrum is normalized to the same integral as the data over the kinematic range shown in the figure. The data are reasonably described by the pythia result generated using a value of 1 GeV/, which is larger than the pythia default value of 0.44 GeV/. The spectra of charged tracks were also compared and exhibited a similar level of agreement. We chose a value of 1.0 GeV/ for further study. To improve the match between the charged particle multiplicity observed in our data and pythia, we adjusted the pythia parameter designated as the effective minimum transverse momentum for multiple interactions[43], which increased the mean track multiplicity by 30%. Figure 9 shows the multiplicity distributions of charged tracks as reconstructed in the PWC system and in the and views of the SSD system for both the data sample and the Monte Carlo sample (after adjustment of the aforementioned pythia parameter) for events that satisfied at least one of the triggers used in this analysis. The corresponding data and MC distributions are similar, indicating that the adjusted MC simulates the particle multiplicity of high energy collisions reasonably well. Rapidity distributions of charged tracks in the MC and data were also found to be in reasonable agreement. With these modifications, the pythia simulation adequately describes the distributions of final state particles observed in our data.
B Trigger simulation
As previously described, the E706 trigger utilized signals from the electromagnetic section of the LAC. Since the EMLAC consists of 27 radiation lengths, but only 1 interaction length, photons deposit nearly all of their energy in the EMLAC, whereas hadrons usually do not. Consequently, high photons and electrons were more likely to trigger the apparatus than hadrons of the same . To investigate the impact of the requirements imposed by the trigger on observed events, we developed a software simulation of the online trigger. Corrections for the losses resulting from the high thresholds of the various triggers were evaluated by subjecting pythia events to this software trigger simulation. The main features of the trigger simulation are discussed in this section.
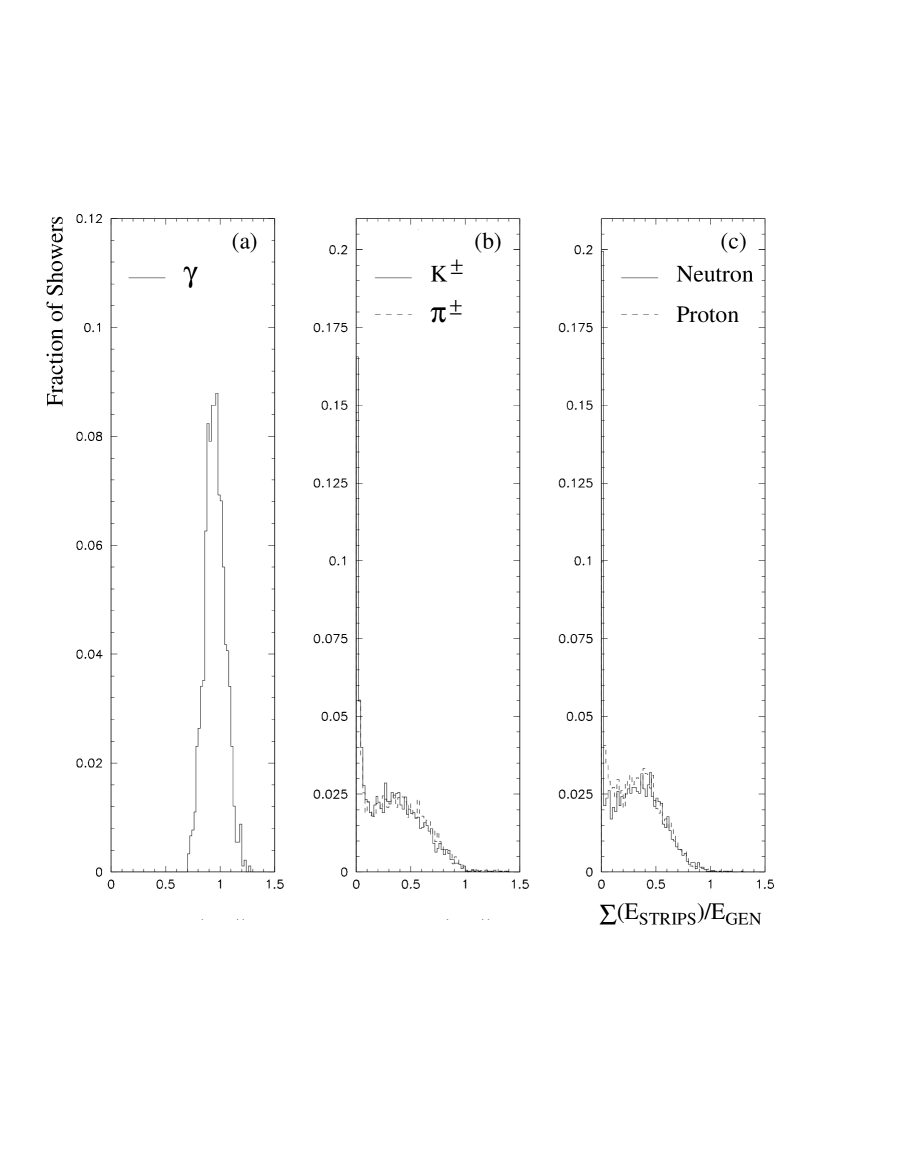
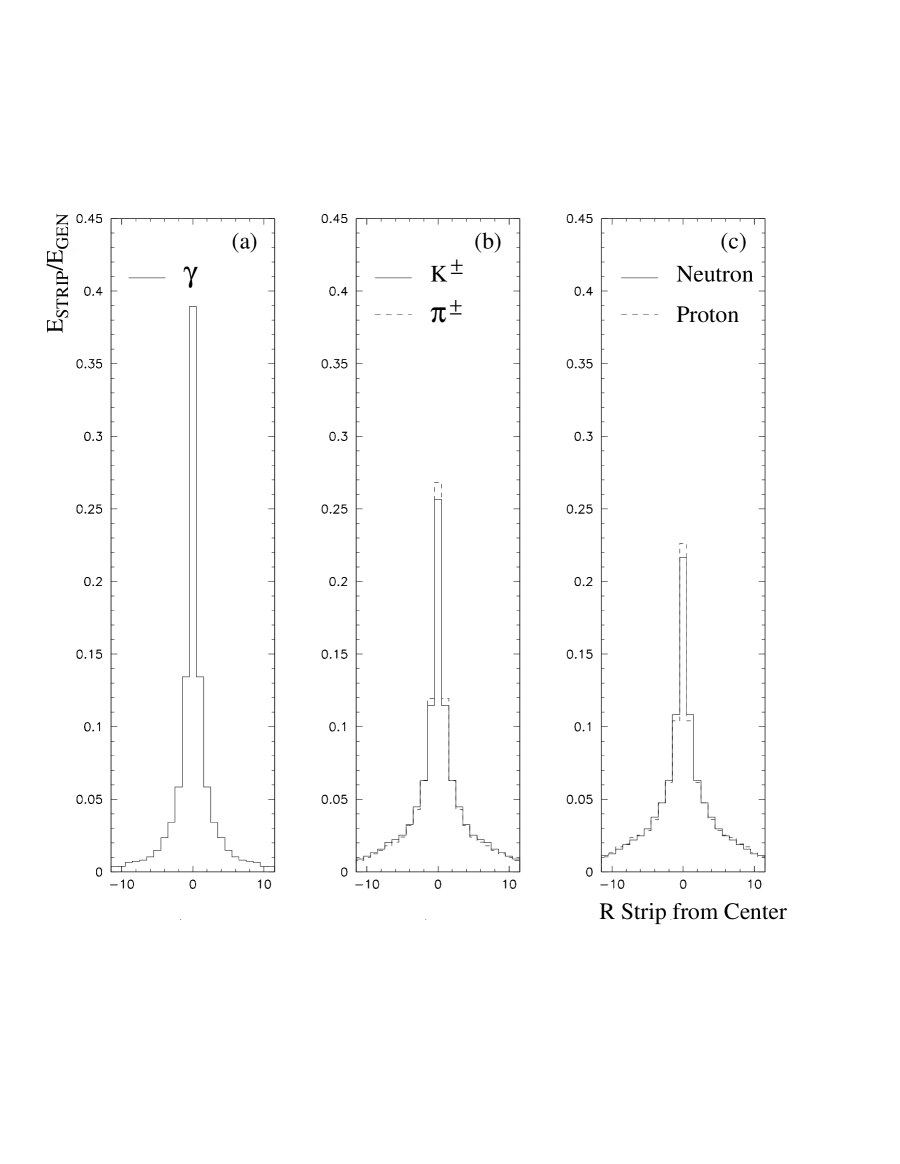
The trigger simulation depends upon the modeling of the energy deposited in the active volume of the EMLAC by incident particles. In order to generate a substantial number of events in a timely manner, the showers generated in the EMLAC by incident particles were parametrized. After accounting for the energy loss in the inactive material in front of the calorimeter (such as the cryostat wall), the (calibrated) energy response of the EMLAC to incident photons and electrons was parametrized by an energy resolution function, , where is the energy in GeV. The response of the EMLAC to incident hadrons was investigated using the geant software package[42]. Individual hadrons at a fixed energy of 20 GeV were generated in the target region and propagated through the full detector simulation (resulting in full showers in the EMLAC). The simulated calibrated energy response relative to the incident hadron energy was evaluated for various incident hadron types and the resulting distributions are shown in Fig. 10(b) and (c). [For comparison, the corresponding distribution for incident 20 GeV photons is shown in Fig. 10(a).] These distributions were used to parametrize the response of the EMLAC to incident hadrons. Since these distributions were generated based upon the full shower response of the EMLAC, they already include the effects of the intrinsic energy resolution of the EMLAC. The shapes of these distributions were found to be relatively insensitive to variations in the incident energy for 6 GeV, and hadrons below this energy were generally not detected. The transverse and longitudinal development of showers were also parametrized based upon full shower geant studies. In the transverse direction, a radial shower profile was used to generate the simulated energy deposition on the R strips near the centroid of the shower (see Fig. 11). The longitudinal shower development for incident photons and hadrons was parametrized as the ratio of the energy in the front section of the EMLAC with respect to the total energy deposited in the EMLAC[39]. These parameterizations of the response of the EMLAC to incident photons and hadrons were used to provide an efficient simulation of the distribution of energy deposited in the EMLAC for each of the incident particles generated by pythia which impinged on the active region of the EMLAC. In this manner, the total energy deposited on each R strip was estimated as the scalar sum of the energy depositions of the individual particles in that given event.
The trigger detected by each R strip was evaluated by weighting the energy detected on that strip by the appropriate measured strip trigger weight, which increased as . (The strip trigger weights were measured and evaluated independently for each trigger type used in this analysis.) From the in the strips, LOCAL and GLOBAL sums were calculated analogously to the online trigger method. These sums and the measured trigger efficiency curves for each trigger were used to evaluate the event trigger probabilities for each trigger type for each event. The simulated event was either accepted or rejected based upon these trigger probabilities.
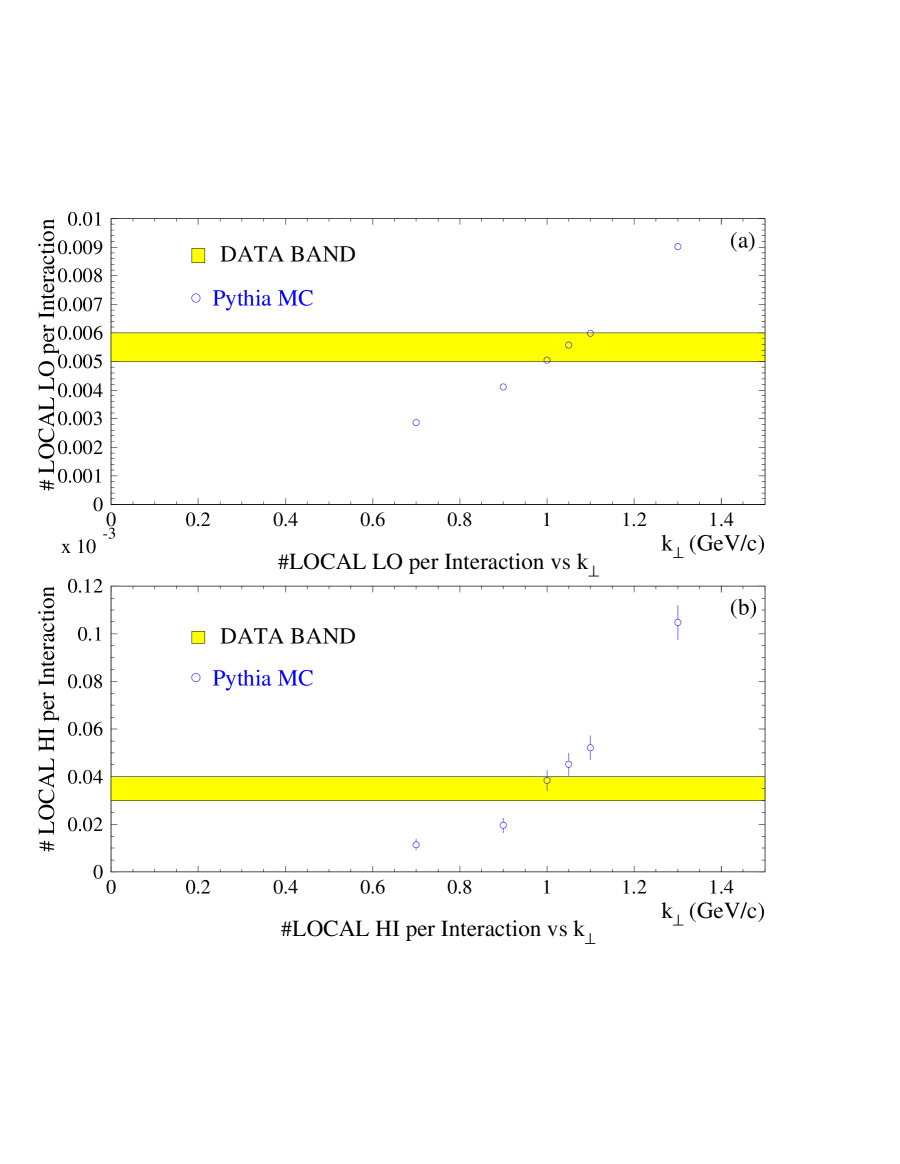
This trigger simulation was tested by comparing the fraction of interactions in which the LOCAL LO and LOCAL HI requirements were satisfied in the Monte Carlo simulation and the low bias data. The interactions in the low bias data were required to have a reconstructed vertex in the target region and events containing beam halo muons were excluded. Several MC event samples were generated using the minimum bias event generator and varying the parameter from 0.7 GeV/ to 1.3 GeV/. For each of these samples, we measured the rate at which the LOCAL LO and LOCAL HI signals were generated. Figure 12(a) shows the rate of LOCAL LO signal generation in the data sample compared to the corresponding rate determined from the MC samples. Figure 12(b) shows a similar comparison for the LOCAL HI signal. The open circles represent the MC results for the various choices, and the shaded band represents the data and its associated uncertainty. Both the LOCAL LO and LOCAL HI signal rates are reproduced by the pythia MC simulation using a value of 1 GeV/. The relative rates between the SINGLE LOCAL HI, LOCALGLOBAL HI, and TWO-GAMMA triggers were also consistent between the MC and data samples. These observations indicate that the tuned MC simulation provides reasonable estimates of the rates at which high energy interactions satisfy the various triggers that contributed to this analysis.
C Trigger efficiency for charm events
Since the tuned pythia MC simulation reproduced the kinematic distributions of final state hadrons, as well as the observed trigger rates in the data, we used this simulation to evaluate the trigger efficiency for charm events. The trigger efficiency is determined by calculating the probability that an event containing a meson (which decays to ) will satisfy the SINGLE LOCAL HI, LOCALGLOBAL HI, or TWO-GAMMA trigger. (We compared the integrated cross sections determined using each trigger type individually, and found them to be consistent within uncertainties.) The average trigger efficiency is evaluated as a function of the of the charged meson that decayed to the final state. Figure 13(a) shows the resulting trigger efficiency for the central value of 1 GeV/, as well as for other reasonable choices of values based upon Fig. 12. In Fig. 13(b), the ratios of the trigger efficiencies for the larger (and smaller) values with respect to the central value are presented. The systematic uncertainty associated with this choice was determined based on the fractional difference between the mean value of the efficiencies determined via the larger and smaller choices. It is also plausible that the trigger efficiency will be sensitive to the value of the charm quark mass that is used in the MC simulation. Figure 14(a) shows the trigger efficiency versus the transverse momentum of the for three choices of (1.2, 1.35, and 1.5 GeV/). Figure 14(b) shows the ratio of trigger efficiencies for the larger and smaller charm quark mass values with respect to the central value. The uncertainty associated with the choice of =1.35 GeV/ was determined based upon the fractional change in the mean value of the trigger efficiency when was varied from 1.2 GeV/ to 1.5 GeV/.
D Tracking simulation
In addition to correcting for losses due to the trigger, we must also evaluate the efficiency of reconstructing the decay vertex once the event has triggered the apparatus. All of the tracking detectors were modeled within the framework of geant to estimate the losses due to the geometrical acceptance of the tracking system and detector performance. Various detector effects, such as efficiency, resolution and noise, were evaluated in the data and then incorporated into the MC simulation. Hit efficiencies are modeled as a function of transverse position in the tracking detectors. Figure 15 shows the number of hits on the reconstructed tracks in the PWC system, and the and views of the SSD system for both the MC and data samples. The consistency between these distributions indicates that the tracking detector efficiencies are well modelled. We also tuned the MC simulation to reproduce the hit multiplicities in the charged tracking detectors. Figure 16 shows the MC and data distributions for the average hit multiplicity in the PWC planes, and the 25 m and 50 m pitch SSD planes, respectively. Both the effects of delta rays and noise hits have been included in this simulation[44]. The mean hit multiplicity from the data and the MC simulation are similar; however, the data distributions are slightly broader. The impact of increasing the hit multiplicity assumed in the MC simulation on the charged meson reconstruction efficiency is discussed in the next section. Finally, we investigate how well the resolution of the detector is simulated. The impact parameter distribution provides a measure of the angular precision of the SSD tracks, and this is pertinent to separating heavy quark decay vertices from the primary vertex. Figure 17 shows the MC and data impact parameter distributions of all charged tracks relative to the primary vertex for the and track segments of the SSD system. The MC distribution is 5% narrower than the corresponding data distribution. The effect of this difference on the estimated reconstruction efficiency will be addressed in the next section.
The decay of into provides an opportunity to compare high statistics MC and data distributions relevant to secondary vertex finding. A large sample of mesons were reconstructed in the data using displaced two track secondary vertices. A sample of full events enriched with mesons was generated using the minimum bias event generator from pythia, and reconstructed using the secondary vertex algorithm described in this paper. The background subtracted signals are shown in Fig. 18. The MC and data mass resolutions are in good agreement. Figure 19(a) shows the 3D impact parameter distributions of the and tracks (from the signal region) to the vee location. Figure 19(b) shows the difference in the reconstructed coordinate of the vee as determined in the and views independently. In both cases, the MC simulation reproduces the distributions observed in the data. We have compared the distributions of other analysis variables as well and found similar agreement[39].
E Charged meson reconstruction efficiency
The reconstruction efficiency, which includes acceptance losses, detector effects, and analysis requirements, is evaluated using the sample of pythia charm events generated with =1.0 GeV/ that satisfy at least one of the high triggers. Figure 20 shows the reconstruction efficiency as a function of the reconstructed transverse momentum. The average reconstruction efficiency for each bin is defined as the value of the parametrization shown in Fig. 20 evaluated at the center of the bin. The reconstruction efficiency increases from 9% in the lowest bin (1 to 2 GeV/) to 17% in our highest bin (6 to 8 GeV/). The inset in Fig. 20 illustrates the reconstruction efficiency versus for mesons with GeV/.
To estimate the systematic uncertainty in the reconstruction efficiency, two additional versions of the MC simulation were evaluated. One version included more noise hits than the default version, and the other had reduced hit multiplicity. The extreme values were determined based upon variations observed in the data at different times during the data taking period. The variations in hit multiplicity were typically less than 10% of the central value. The primary causes of these variations in the average hit multiplicity are variations in the beam intensity and detector performance. Increasing the number of noise hits results in a degradation of the track and vertex resolution which reduces the reconstruction efficiency. Reducing the hit multiplicity has the opposite effect. We compared the impact parameter distributions of charged tracks to the primary vertex for these two MC versions and found that the higher hit multiplicity version more accurately reproduced the data result. However, the hit and track multiplicity in this version of the MC was larger than that observed in the data. The sensitivity of the reconstruction efficiency to the choice of either matching the track multiplicity distribution or the impact parameter distribution from the MC simulation and the data reflects an uncertainty in the reported reconstruction efficiency. The 10% systematic uncertainty in the reconstruction efficiency is based on the relative difference between the results from these two versions of the MC simulation.
VI RESULTS
The observed signals and the efficiencies for triggering on and reconstructing these events are tabulated in Tables I and II for charged mesons in the kinematic ranges and , respectively. Using these numbers, the cross section in each bin is given by , where is the number of mass combinations above background in the given bin, is the efficiency for reconstructing those events, is the integrated luminosity, and is the branching ratio for , which is 9.10.6%[45]. The integrated luminosity per nucleon is 7.80.8 events/pb for this data sample, including target transverse fiducial cuts and corrections for beam absorption. In combining the signals from the beryllium and copper targets, nuclear effects were assumed to be negligible for the hadroproduction of open charm. The dependences of cross sections per nucleus on atomic mass are often parametrized as , where is the atomic mass of the target nucleus. Recent measurements of meson production yield values of consistent with one[2, 46, 47]. No significant (or ) dependence of is observed[47]. The differential and integrated cross sections are discussed in the following subsections.
A Differential cross sections
The differential cross sections per nucleon integrated over the ranges and are presented in Table III[48] and displayed in Fig. 21. Due to the steeply falling spectra and the large widths of the bins, the data points are plotted at values, , that correspond to the average values of the cross section in the appropriate bins as determined from the pythia MC spectra[49]. The uncertainty in the cross section is obtained from the quadrature sum of the statistical and systematic uncertainties.
Figure 22 shows our measured cross sections and the results of the pythia MC simulation. Common systematic uncertainties in the luminosity and branching ratio have been excluded from the uncertainties shown in this figure. The shapes of the spectra generated by the pythia MC simulation are consistent with our measured spectra. These pythia results were normalized to our measured cross section integrated over and GeV/. The consistency between the data and the corresponding pythia result integrated over the range [shown in Fig. 22(b)] indicates that pythia adequately models the fraction of the cross section in the range relative to the fraction in the range .
Figure 23 shows the differential charged cross section compared to results of NLO pQCD calculations[50]. The renormalization and factorization scales employed in the calculation of these differential distributions are as follows: and , where and and are the transverse momenta of the charm and anti-charm quarks. The solid curve shows the NLO pQCD result for charm quark production. The dotted curve illustrates the NLO pQCD result including the effects of Peterson et al. fragmentation (with =0.06). The other broken curves show the Peterson et al. fragmented NLO pQCD results for charm production supplemented with various values of . The pQCD cross sections shown in Fig. 23 have been normalized to our extrapolated integrated cross section (see next section). The results are integrated over the range . (The corresponding comparisons for results integrated over the range do not appear substantially different.) The common systematic uncertainties in the luminosity and branching ratio have been excluded from the uncertainties shown in this figure. The shapes of the theoretical spectra for unfragmented charm quark production are consistent with data on the hadroproduction of mesons from experiments E769[51] and WA82[1]. E653 reported that the shape of the unfragmented NLO pQCD transverse momentum distribution was “somewhat harder” than the observed distribution[15]. Our data probe a larger range, and the unfragmented theoretical spectrum is clearly harder than the spectrum observed in our data. Introducing Peterson et al. fragmentation into the calculation results in a softer spectrum whose shape better matches the shape observed. It is clear that the NLO pQCD spectrum generated using =1.5 GeV/ and supplemented with =3 (GeV/)2 is harder than our data, while the corresponding spectra generated with values between 1 and 2 (GeV/)2 are similar to what we observe. As noted in the Introduction, the meson spectra reported by experiments E769 and WA82 can also be described by the fragmented NLO pQCD results supplemented with a =2 (GeV/)2[1].
B Integrated cross section
Since the shapes of the E769 and WA82 meson spectra are consistent with the NLO pQCD calculations using Peterson et al. fragmentation supplemented with =2 (GeV/)2, we used that pQCD calculation to estimate the extrapolation factor necessary to account for the low portion ( GeV/) of the cross section. We find an extrapolation factor of 2.7. The uncertainty in that factor is estimated to be 15% (which corresponds to the range of values obtained from the fragmented NLO calculation supplemented with =1.5 (GeV/)2 and the unfragmented NLO pQCD calculation). An additional factor of 1.070.03 accounts for the mesons produced with . This factor was evaluated using the spectrum of mesons from the pythia MC simulation. The uncertainty was based on half the difference between the factor predicted for and mesons separately.
Using these factors, the total cross section is b per nucleon. The systematic error estimate includes uncertainties in the trigger and reconstruction efficiencies, normalization, branching ratio, and the extrapolation. The cross section for is b per nucleon. This result is compared in Fig. 24 with previous measurements [9, 10, 11, 12, 13, 14, 15] of the inclusive cross section in interactions at other beam energies. Where appropriate, the results from other experiments have been adjusted to reflect current branching ratio values. The error bars represent the statistical and systematic uncertainties added in quadrature. The figure also shows the results of NLO pQCD calculations of the charm cross section[5, 6, 50]. The results have been adjusted by a factor of 2 to account for the associated production of charm and are reduced by a factor of 1.6 to reflect the partial coverage ()[16, 52]. Since it is expected that the to charm fraction is nearly constant over this energy range[1], the results are also multiplied by a factor of 0.22 to account for the fragmentation process . This factor was extracted from published measurements of the forward production charm hadron cross sections[11]. The pQCD calculations use the SMRS2[53] and HMRSB[54] parton distribution functions for the pion and nucleons, respectively. The solid curves in the figure are the values of the calculated charm cross section generated using a charm quark mass of GeV/ and renormalization scales of and . To illustrate the sensitivity of the calculation to variations in the input parameters, the corresponding results are also displayed for a charm quark mass of 1.35 GeV/ (dashed curves). The calculations are expected to exhibit similar sensitivities to other inputs, such as the factorization scale and parton distribution functions. While these theoretical uncertainties in the normalization of the charm cross section are large at NLO, the energy dependence of the calculated charged meson cross section is less sensitive to these uncertainties and adequately describes the energy dependence suggested by the data points from the various experiments.
VII CONCLUSIONS
We have analyzed a large sample of 515 GeV/ interactions in copper and beryllium targets selected via a high transverse momentum electromagnetic shower trigger to study the hadronic production of high transverse momentum charged mesons. Secondary vertices from decays were reconstructed in a charged particle tracking system which included silicon strip detectors, a dipole magnet, proportional wire chambers, and straw tube drift chambers. The data span the kinematic range and GeV/, a range which exceeds previously reported measurements.
The measured differential cross section is consistent with results from pythia, provided pythia is supplemented with a 1 GeV/. Our measured charged meson spectrum is not well described by the NLO pQCD calculations for charm quark production that describe the lower results reported by E769[51]. Our data are consistent with the charm spectra resulting from Peterson et al. fragmented NLO pQCD calculations supplemented with a of 1 to 2 (GeV/)2. This observation is consistent with previous reports on the comparison of the measured inclusive spectra of hadroproduced charm particles to fragmented NLO pQCD calculations supplemented with additional [1].
An extrapolation based upon our measured spectrum yields an integrated cross section of b per nucleon for . This value is consistent with the trend observed in measurements at other incident beam energies. The total cross section for 515 GeV/ -nucleon interactions is b per nucleon.
Acknowledgements.
We thank M. Mangano and T. Sjöstrand for sharing their valuable insights on the phenomenology of charm hadroproduction and for helping us to understand and utilize their programs. We also thank S. Kwan for several valuable discussions related to charm hadroproduction. We are grateful for the valuable contributions of our colleagues on Fermilab experiment E672. We thank the U. S. Department of Energy, the National Science Foundation, including its Office of International Programs, the Universities Grants Commission of India, and Fermilab for their support of this research.REFERENCES
- [1] S. Frixione, M. L. Mangano, P. Nason, and G. Ridolfi, Nucl. Phys. B431, 453 (1994).
- [2] M. Dameri, in Heavy Quarks at Fixed Target-Proceedings of the 2 day Frascati Workshop, 1993, Vol. 1 of Frascati Physics Series, edited by S. Bianco and F. L. Fabbri (INFN, Roma, Italy, 1993), pp. 167–180, (and references therein).
- [3] J. A. Appel, Annu. Rev. Nucl. Part. Sci. 42, 367 (1992).
- [4] S. P. K. Tavernier, Rep. Prog. Phys. 50, 1439 (1987).
- [5] P. Nason, S. Dawson, and R. K. Ellis, Nucl. Phys. B303, 607 (1988).
- [6] P. Nason, S. Dawson, and R. K. Ellis, Nucl. Phys. B327, 49 (1989).
- [7] W. Beenakker, H. Kuijf, W. L. van Neerven, and J. Smith, Phys. Rev. D 40, 54 (1989).
- [8] W. Beenakker et al., Nucl. Phys. B351, 507 (1991).
- [9] (NA11) ACCMOR Collaboration, R. Bailey et al., Z. Phys. C 30, 51 (1986).
- [10] (NA32) ACCMOR Collaboration, S. Barlag et al., Z. Phys. C 39, 451 (1988), (includes +15% shift cited in Ref. [12]).
- [11] Fermilab E769 Collaboration, G. A. Alves et al., Phys. Rev. Lett. 77, 2388 (1996).
- [12] (NA32) ACCMOR Collaboration, S. Barlag et al., Z. Phys. C 49, 555 (1991).
- [13] (NA16) LEBC-EHS Collaboration, M. Aguilar-Benitez et al., Phys. Lett. B 135, 237 (1984).
- [14] NA27 LEBC-EHS Collaboration, M. Aguilar-Benitez et al., Phys. Lett. 161B, 400 (1985); Z. Phys. C 31, 491 (1986).
- [15] Fermilab E653 Collaboration, K. Kodama et al., Phys. Lett. B 284, 461 (1992).
- [16] M. L. Mangano, P. Nason, and G. Ridolfi, Nucl. Phys. B405, 507 (1993).
- [17] R. Vogt, Z. Phys. C 71, 475 (1996).
- [18] The shapes of the calculated spectra are not entirely independent of the choices of the input parameters of the calculation. For illustrations of the sensitivity to the choice of PDF and/or the renormalization scale formulation, see Ref. [17].
- [19] C. Peterson, D. Schlatter, I. Schmitt, and P. M. Zerwas, Phys. Rev. D 27, 105 (1983).
- [20] B. Andersson, G. Gustafson, G. Ingelman, and T. Sjöstrand, Phys. Rep. 97, 33 (1983).
- [21] Similar but distinct symbols have been adopted for the supplemental intrinsic transverse momentum associated with the NLO pQCD calculation and for the pythia intrinsic transverse momentum parameter to emphasize that while the concept is similar in the two situations, the particular values of the parameter might be expected to differ due to the differing levels of contributions already incorporated in the calculations.
- [22] S. Kwan for the E791 Collaboration, Testing QCD in Charm Hadroproduction, Joint Experimental Theoretical Physics Seminar at Fermilab, June 1995.
- [23] Fermilab E706 Collaboration, G. Alverson et al., Phys. Rev. D 48, 5 (1993).
- [24] J. F. Owens, Rev. Mod. Phys. 59, 465 (1987).
- [25] T. Ferbel and W. R. Molzon, Rev. Mod. Phys. 56, 181 (1984).
- [26] Fermilab E706 Collaboration, G. Alverson et al., Phys. Rev. D 49, 3106 (1994).
- [27] The diagram does not include the veto walls and steel absorber located upstream of the detector elements shown. The diagram also excludes the downstream muon identification system, which was located downstream of the detector elements shown in the diagram, and which was used primarily by Fermilab E672 to select events containing high mass dimuons.
- [28] E. Engels Jr. et al., Nucl. Instrum. Methods Phys. Res. A 253, 523 (1987).
- [29] R. Jesik et al., Phys. Rev. Lett. 74, 495 (1995).
- [30] K. Hartman, Ph.D. thesis, Pennsylvania State University, 1990.
- [31] D. Brown, Ph.D. thesis, Michigan State University, 1992.
- [32] C. Bromberg et al., Nucl. Instrum. Methods Phys. Res. A 307, 292 (1991).
- [33] F. Lobkowicz et al., Nucl. Instrum. Methods Phys. Res. A 235, 332 (1985).
- [34] W. DeSoi, Ph.D. thesis, University of Rochester, 1990.
- [35] L. Sorrell, The E706 Trigger System, E706 Note 201, 1994 (unpublished); Ph.D. Thesis, Michigan State University, 1995.
- [36] Scintillation counter veto walls surrounding a large steel absorber located at the front end of the Meson West spectrometer tagged muons that were produced upstream of the experimental hall.
- [37] Note that both the SINGLE LOCAL HI trigger and the LOCALGLOBAL HI trigger are sensitive to high direct photons or photons from high decays, but the LOCALGLOBAL HI trigger exhibits greater sensitivity to high mesons that decay into more widely separated photons, such as or .
- [38] Corrections were applied to the measured , , and to account for the location of the center of curvature of the path of the charged particles, the change in , and for the effects of the fringe field of the analysis magnet.
- [39] S. Blusk, Ph.D. thesis, University of Pittsburgh, 1995.
- [40] T. Sjöstrand, Pythia 5.6 and Jetset 7.3 Physics and Manual CERN-TH.6488/92, (1992).
- [41] L. Cifarelli, E. Eşkut, and Yu. M. Shabelski, Nuovo Cimento 106A, 389 (1993).
- [42] F. Carminati, CERN Program Library Long Writeup W5013 (1993).
- [43] This particular pythia parameter is stored in the array element PARP(81), and it was reduced from 1.3 GeV to 0.7 GeV. See the pythia reference manual for additional details[40].
- [44] W. Chung, Ph.D. thesis, University of Pittsburgh, 1995.
- [45] Particle Data Group, R. M. Barnett et al., Phys. Rev. D 54, 1 (1996).
- [46] The determined from the mesons in this data sample was . See Ref. [39] for details.
- [47] Fermilab E769 Collaboration, G. A. Alves et al., Phys. Rev. Lett. 70, 722 (1993).
- [48] The two contributions to the uncertainties in the numbers of mesons quoted in Tables I and II are treated as uncorrelated statistical uncertainties in the differential cross section analyses. The two contributions to the uncertainties associated with each of the efficiencies are treated as uncorrelated systematic uncertainties in the differential cross section analyses.
- [49] G. D. Lafferty and T. R. Wyatt, Nucl. Instrum. Methods Phys. Res. A 355, 541 (1995).
- [50] The NLO pQCD calculations were performed using a set of programs provided by M. Mangano. (See Ref. [16] and references therein). Unless otherwise explicitly stated, the theoretical parameters were set to the defaults specified in Ref. [16].
- [51] Fermilab E769 Collaboration, G. A. Alves et al., Phys. Rev. Lett. 77, 2392 (1996).
- [52] The factor of 1.6 is from a NLO pQCD calculation, and therefore does not account for the leading particle effect which results in enhanced forward production of charm hadrons whose light quark is a spectator valence quark from the incoming beam particle.
- [53] P. J. Sutton, A. D. Martin, R. G. Roberts, and W. J. Stirling, Phys. Rev. D 45, 2349 (1992).
- [54] P. N. Harriman, A. D. Martin, W. J. Stirling, and R. G. Roberts, Phys. Rev. D 42, 798 (1990).
| bin (GeV/) | Number of | Trigger Eff. (%) | Fitted Recon. Eff. (%) |
|---|---|---|---|
| 1–2 | |||
| 2–3 | |||
| 3–4 | |||
| 4–6 | |||
| 6–8 |
| bin (GeV/) | Number of | Trigger Eff. (%) | Fitted Recon. Eff. (%) |
|---|---|---|---|
| 1–2 | |||
| 2–3 | |||
| 3–4 | |||
| 4–6 | |||
| 6–8 | 0 |
| bin | |||
| (GeV/) | (GeV/) | ||
| 1–2 | 1.440.02 | ||
| 2–3 | 2.410.02 | ||
| 3–4 | 3.410.02 | ||
| 4–6 | 4.700.05 | ||
| 6–8 | 6.750.05 | - |