Measurement of the Decay Amplitudes and Branching Fractions of and Decays
Abstract
Using data taken with the CLEO II detector, we present the first full angular analysis in the color-suppressed modes and . This leads to a complete determination of the decay amplitudes of these modes. In addition, we update the branching fractions for and .
C. P. Jessop,1 K. Lingel,1 H. Marsiske,1 M. L. Perl,1 S. F. Schaffner,1 D. Ugolini,1 R. Wang,1 X. Zhou,1 T. E. Coan,2 V. Fadeyev,2 I. Korolkov,2 Y. Maravin,2 I. Narsky,2 V. Shelkov,2 J. Staeck,2 R. Stroynowski,2 I. Volobouev,2 J. Ye,2 M. Artuso,3 A. Efimov,3 F. Frasconi,3 M. Gao,3 M. Goldberg,3 D. He,3 S. Kopp,3 G. C. Moneti,3 R. Mountain,3 Y. Mukhin,3 S. Schuh,3 T. Skwarnicki,3 S. Stone,3 G. Viehhauser,3 X. Xing,3 J. Bartelt,4 S. E. Csorna,4 V. Jain,4 S. Marka,4 A. Freyberger,5 R. Godang,5 K. Kinoshita,5 I. C. Lai,5 P. Pomianowski,5 S. Schrenk,5 G. Bonvicini,6 D. Cinabro,6 R. Greene,6 L. P. Perera,6 B. Barish,7 M. Chadha,7 S. Chan,7 G. Eigen,7 J. S. Miller,7 C. O’Grady,7 M. Schmidtler,7 J. Urheim,7 A. J. Weinstein,7 F. Würthwein,7 D. M. Asner,8 D. W. Bliss,8 W. S. Brower,8 G. Masek,8 H. P. Paar,8 V. Sharma,8 J. Gronberg,9 R. Kutschke,9 D. J. Lange,9 S. Menary,9 R. J. Morrison,9 H. N. Nelson,9 T. K. Nelson,9 C. Qiao,9 J. D. Richman,9 D. Roberts,9 A. Ryd,9 M. S. Witherell,9 R. Balest,10 B. H. Behrens,10 K. Cho,10 W. T. Ford,10 H. Park,10 P. Rankin,10 J. Roy,10 J. G. Smith,10 J. P. Alexander,11 C. Bebek,11 B. E. Berger,11 K. Berkelman,11 K. Bloom,11 D. G. Cassel,11 H. A. Cho,11 D. M. Coffman,11 D. S. Crowcroft,11 M. Dickson,11 P. S. Drell,11 K. M. Ecklund,11 R. Ehrlich,11 R. Elia,11 A. D. Foland,11 P. Gaidarev,11 B. Gittelman,11 S. W. Gray,11 D. L. Hartill,11 B. K. Heltsley,11 P. I. Hopman,11 J. Kandaswamy,11 N. Katayama,11 P. C. Kim,11 D. L. Kreinick,11 T. Lee,11 Y. Liu,11 G. S. Ludwig,11 J. Masui,11 J. Mevissen,11 N. B. Mistry,11 C. R. Ng,11 E. Nordberg,11 M. Ogg,11,***Permanent address: University of Texas, Austin TX 78712 J. R. Patterson,11 D. Peterson,11 D. Riley,11 A. Soffer,11 C. Ward,11 M. Athanas,12 P. Avery,12 C. D. Jones,12 M. Lohner,12 C. Prescott,12 S. Yang,12 J. Yelton,12 J. Zheng,12 G. Brandenburg,13 R. A. Briere,13 Y.S. Gao,13 D. Y.-J. Kim,13 R. Wilson,13 H. Yamamoto,13 T. E. Browder,14 F. Li,14 Y. Li,14 J. L. Rodriguez,14 T. Bergfeld,15 B. I. Eisenstein,15 J. Ernst,15 G. E. Gladding,15 G. D. Gollin,15 R. M. Hans,15 E. Johnson,15 I. Karliner,15 M. A. Marsh,15 M. Palmer,15 M. Selen,15 J. J. Thaler,15 K. W. Edwards,16 A. Bellerive,17 R. Janicek,17 D. B. MacFarlane,17 K. W. McLean,17 P. M. Patel,17 A. J. Sadoff,18 R. Ammar,19 P. Baringer,19 A. Bean,19 D. Besson,19 D. Coppage,19 C. Darling,19 R. Davis,19 N. Hancock,19 S. Kotov,19 I. Kravchenko,19 N. Kwak,19 S. Anderson,20 Y. Kubota,20 M. Lattery,20 J. J. O’Neill,20 S. Patton,20 R. Poling,20 T. Riehle,20 V. Savinov,20 A. Smith,20 M. S. Alam,21 S. B. Athar,21 Z. Ling,21 A. H. Mahmood,21 H. Severini,21 S. Timm,21 F. Wappler,21 A. Anastassov,22 S. Blinov,22,†††Permanent address: BINP, RU-630090 Novosibirsk, Russia. J. E. Duboscq,22 K. D. Fisher,22 D. Fujino,22,‡‡‡Permanent address: Lawrence Livermore National Laboratory, Livermore, CA 94551. R. Fulton,22 K. K. Gan,22 T. Hart,22 K. Honscheid,22 H. Kagan,22 R. Kass,22 J. Lee,22 M. B. Spencer,22 M. Sung,22 A. Undrus,22,† R. Wanke,22 A. Wolf,22 M. M. Zoeller,22 B. Nemati,23 S. J. Richichi,23 W. R. Ross,23 P. Skubic,23 M. Wood,23 M. Bishai,24 J. Fast,24 E. Gerndt,24 J. W. Hinson,24 N. Menon,24 D. H. Miller,24 E. I. Shibata,24 I. P. J. Shipsey,24 M. Yurko,24 L. Gibbons,25 S. D. Johnson,25 Y. Kwon,25 S. Roberts,25 and E. H. Thorndike25
1Stanford Linear Accelerator Center, Stanford University, Stanford, California 94309
2Southern Methodist University, Dallas, Texas 75275
3Syracuse University, Syracuse, New York 13244
4Vanderbilt University, Nashville, Tennessee 37235
5Virginia Polytechnic Institute and State University, Blacksburg, Virginia 24061
6Wayne State University, Detroit, Michigan 48202
7California Institute of Technology, Pasadena, California 91125
8University of California, San Diego, La Jolla, California 92093
9University of California, Santa Barbara, California 93106
10University of Colorado, Boulder, Colorado 80309-0390
11Cornell University, Ithaca, New York 14853
12University of Florida, Gainesville, Florida 32611
13Harvard University, Cambridge, Massachusetts 02138
14University of Hawaii at Manoa, Honolulu, Hawaii 96822
15University of Illinois, Champaign-Urbana, Illinois 61801
16Carleton University, Ottawa, Ontario, Canada K1S 5B6
and the Institute of Particle Physics, Canada
17McGill University, Montréal, Québec, Canada H3A 2T8
and the Institute of Particle Physics, Canada
18Ithaca College, Ithaca, New York 14850
19University of Kansas, Lawrence, Kansas 66045
20University of Minnesota, Minneapolis, Minnesota 55455
21State University of New York at Albany, Albany, New York 12222
22Ohio State University, Columbus, Ohio 43210
23University of Oklahoma, Norman, Oklahoma 73019
24Purdue University, West Lafayette, Indiana 47907
25University of Rochester, Rochester, New York 14627
One of the interests in decays is their role in violation measurements at asymmetric -factories. The vector-vector decay , with , is a mixture of -even and -odd eigenstates since it can proceed via an S, P, or D wave decay. If one eigenstate dominates or if the two eigenstates can be separated, this decay can be used to measure the angle of the unitarity triangle in a manner similar to which the -odd eigenstate is used.
Measurements of the decay amplitudes of transitions also provide a test of the factorization hypothesis in decays with internal -emission. Several phenomenological models, based on the factorization hypothesis, predict the longitudinal polarization fraction in , denoted , and the ratio of vector to pseudoscalar meson production, [1, 2, 3, 4, 5]. It has been noted [5, 6], that form factor models cannot simultaneously explain the earlier experimental data for these two quantities. The high values of measured by ARGUS [7] and CLEO II [8], with low statistics, are not consistent with factorization and the measured value of . The CDF collaboration has measured a lower value of [9]. Additional information about the validity of factorization can be obtained by a measurement of the decay amplitude phases, since any non-trivial phase differences indicate final state interactions and the breakdown of factorization [10].
In this paper we present a complete angular analysis and an update of the branching fractions for decays using the full CLEO II data sample. Assuming isospin symmetry, we determine the fraction of longitudinal polarization, the parity content and the phase differences of the decay amplitudes from the modes and using the and decay modes to , , , and . The is reconstructed in its leptonic decay modes to and . The measurements presented here supersede previous CLEO II results [8], which are based on a subset of the data used for this analysis.
The decay is described by three complex decay amplitudes. Following a suggestion of Dunietz et al. [11, 12], we measure the decay amplitudes , , and , where , , and denote S, P, and D wave amplitudes, respectively. Normalizing the decay amplitudes to and eliminating one overall phase leaves four independent parameters.
The full angular distribution of a meson decaying into two vector particles is specified by three angles. Previously the helicity angle basis [13] has been used for angular analyses of decays. Because of its convenience for extracting the parity information, we use a different set of angles, called the transversity basis [12]. The direction of the in the rest frame defines the x-axis of a right-handed coordinate system. The plane fixes the y-axis with and the normal to this plane defines the z-axis. The transversity angles and are then defined as polar and azimuth angles of the in the rest frame. The third angle, the decay angle , is defined as that of the in the rest frame relative to the negative of the direction in that frame. Using these definitions the full angular distribution of the decay is [12]:
For decays the interference terms containing switch sign while all other terms remain unchanged.
The data for this analysis were recorded with the CLEO II detector located at the Cornell Electron Storage Ring (CESR). We have used a data sample of approximately events taken on the resonance and representing an integrated luminosity of . To evaluate non- backgrounds, we have also collected a “continuum” data sample 60 MeV below the resonance, with an integrated luminosity of about .
The components of the CLEO II detector [14] most relevant to this analysis are the charged particle tracking, the CsI electromagnetic calorimeter and the muon counters. The tracking system comprises a set of precision drift chambers totaling 67 layers inside a 1.5 T solenoidal magnet. It measures both momentum and specific ionization () of charged particles.
Electron candidates are identified by their energy deposition in the calorimeter, which must equal their measured momenta, and their specific ionization, which must be consistent with that expected for electrons. At least one muon candidate is required to have penetrated five nuclear interaction lengths of material while the other must have penetrated at least three interaction lengths. The decays and have little background, therefore only one of the two leptons has to be positively identified. In this case the identified muon candidate must penetrate at least three interaction lengths. We require the dimuon invariant mass to be within 45 MeV of the mass, which corresponds to a selection. For the dielectron invariant mass we require to allow for the radiative tail. The energy resolution is improved by a factor of by performing a kinematic fit of the dilepton mass to the nominal mass. The kinematic fit does not affect the measurements of the transversity angles. The resolution of the angle measurements is better than 0.06 radian for all decay angles.
We require the charged hadron candidates to have measurements that lie within three standard deviations () of the expected values. We reconstruct candidates through the decay to and we reconstruct candidates through the decay to . Candidate mesons are required to have a invariant mass within 75 MeV of the nominal mass.
In symmetric annihilations at the (4S) resonance, the energy of a meson must equal the beam energy. We require the energy difference between the candidate and the beam energy to be less than 45 MeV for and , less than 30 MeV for and , and less than 60 MeV for and . These ranges correspond to approximately in . In the rare case, that an event has more than one candidate per mode we keep only the candidate with the highest probability, which is based on the measured and, if available, the measured , the mass, and the time-of-flight information. The resolution on the beam energy is an order of magnitude better than the resolution on the candidate energy. Therefore we substitute the beam energy in the calculation of the -candidate mass (referred to as the “beam-constrained mass” ). The detection efficiencies range from 48% for the mode down to 9% for with .
The most severe background in the modes is feed-across from one mode to another. For such events both the total energy and the beam-constrained mass are very close to the signal region. The biggest source of feed-across background is from swapping a random or misidentified slow for the correct one. Consequently most background events have the moving backwards with respect to the direction of flight. To suppress this background we require the decay angle to satisfy in these decays. This is equivalent to a constraint on the momentum, corresponding to a minimum of about 200 MeV. The total fraction of feed-across events in the signal region, averaged over all modes, is .
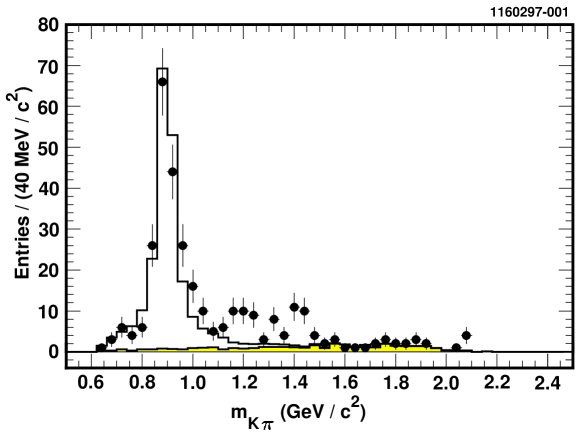
There might be a contribution from non-resonant decays in the signal region, though neither the previous CLEO measurement [8] nor CDF [9] found events in the mass sidebands. However, examining the invariant mass spectrum (Fig. 1) shows an excess of events between 1.1 and 1.45 GeV. By computing the kinematics of non-resonant decays, using both the momentum spectrum from inclusive decays [15] and several theoretical models [16], we do expect strangeness-containing final states with invariant masses in this region. Decays via higher resonances may have line shapes consistent with the distribution seen by us [17]. Unfortunately, due to the limited statistics for , we cannot distinguish between possible components. In addition, we considered many other possible origins for these events including feed-down from modes such as or , and feed-through from , and found none of these to contribute significantly. We estimate the amount of the non- contribution in the signal region to be with a conservatively chosen systematic uncertainty of .
Other misidentified decays, like , do not contribute significantly to the background since they lie outside the energy window. With a similar analysis CLEO has found 9 events for [18]. If a pion from the is misidentified as a kaon, could fall in the region but these events would fail the energy criterion. Feed-across between the and modes is also suppressed by the requirement on . Furthermore, the contributions are uniform in the beam-constrained mass.
We define combinatorial backgrounds to be events that do not contain a true decay. In both the Monte Carlo simulation and our continuum data sample we see very few such events.
We must correct our data for detection efficiency. To obtain the efficiency as a function of all three angles, a large Monte Carlo sample (120,000 events/ mode) is divided into a grid in , and . For each final state the efficiency is fitted separately with polynomials in three dimensions including all correlations. The efficiency distributions are nearly uniform in all angles except the decay angle, where it drops at high because of the slow pion.
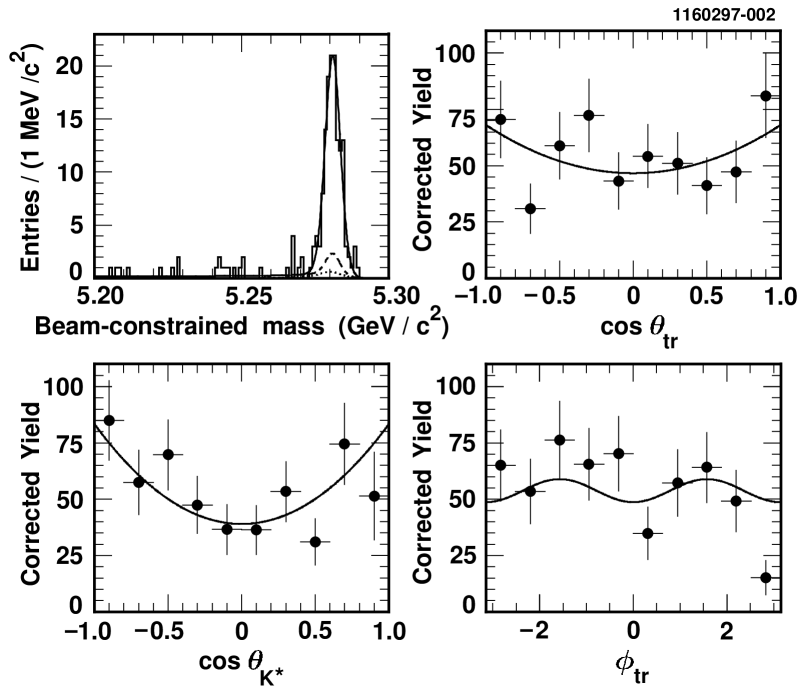
To determine the decay amplitudes, a four-dimensional unbinned maximum likelihood fit is performed to the distributions of the three angles and the beam-constrained mass. Setting , we fit for the longitudinal polarization fraction, , the parity-odd fraction, , and the phases and . Other free parameters in the fit are the branching fraction , the mean of the distribution and the normalization of the combinatorial background of each mode. Fitting for the branching fraction and the polarization parameters simultaneously ensures the correct treatment of the background events and automatically adjusts the branching fraction measurement for the polarization dependence of the efficiency. The one-dimensional projections of the resulting fit function are shown in Fig. 2. The results are listed in Table I. The correlations between the fit parameters are small. The systematic uncertainties of the decay amplitude measurements are dominated by those in the efficiency parameterization and background polarization and are small compared to the statistical errors.
| Parameter | Value |
|---|---|
| radian | |
| radian |
We also repeated the fit to the decay amplitudes using helicity angles rather than transversity angles as well as performing one-dimensional fits to both the longitudinal polarization fraction and the parity-odd component. An independent angular analysis with the same data sample has also been performed, using a Monte Carlo technique [19] to evaluate the likelihood function. All results are in agreement with those reported here.
These results are the first determination of the parity-odd component and the phases of the decay amplitudes of the decay. The small fraction of the parity-odd component encourages using the decay for violation studies at asymmetric factories. The phases of the decay amplitudes are measured to be close to zero or , giving no evidence for strong final state interactions.
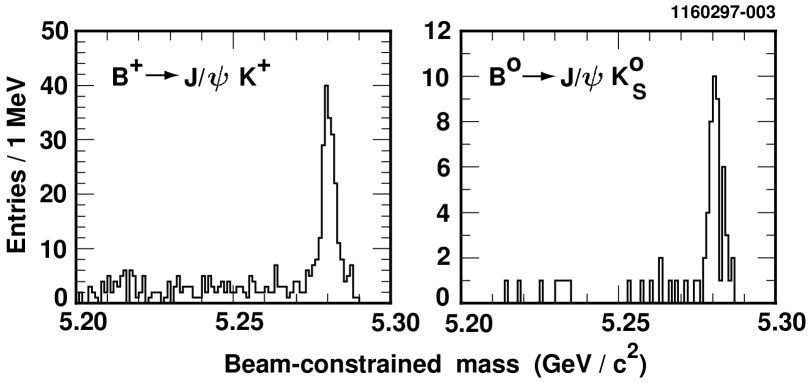
The branching fractions of the decays are a result of the angular fit. To measure the branching fractions we performed one-dimensional fits to the beam-constrained mass distributions. The results of the fits are shown in Fig. 3. All measured branching fractions are listed in Table II, where we have assumed that the production rate of neutral and charged mesons is the same on the resonance, in agreement with the actual measured value of [20] and a theoretical prediction [21]. The main sources of systematic uncertainties of the branching fraction measurements are track finding, track fitting, and lepton identification efficiencies, and the uncertainty of the world average of [22]. In the branching ratios, uncertainties in the amount of feed-across and non- decays dominate the systematic error.
| Decay mode | Signal Yield | Branching Fraction [] |
|---|---|---|
With the assumption of equal partial widths, , and eliminating common systematic uncertainties we determine
Assuming isospin invariance, we find for the ratio of pseudoscalar to vector meson production
These new measurements of and the ratio indicate that the discrepancy with naive factorization models is not as acute as before.
We gratefully acknowledge the effort of the CESR staff in providing us with excellent luminosity and running conditions. This work was supported by the National Science Foundation, the U.S. Department of Energy, the Heisenberg Foundation, the Alexander von Humboldt–Stiftung, Research Corporation, the Natural Sciences and Engineering Research Council of Canada, and the A.P. Sloan Foundation.
REFERENCES
- [1] M. Wirbel, B. Stech and M. Bauer, Z. Phys. C 29 (1985) 637; Z. Phys. C 34 (1987) 103.
- [2] N. Isgur, D. Scora, B. Grinstein, and M.B. Wise, Phys. Rev. D 39 (1989) 799; N. Isgur and D. Scora, Phys. Rev. D 40 (1989) 1491;
- [3] M. Neubert, V. Rieckert, Q.P. Xu and B. Stech in Heavy Flavours, edited by A.J. Buras and H. Lindner, World Scientific, Singapore (1992).
- [4] R. Casalbuoni, A. Deandrea, N. Di Bartolomeo, F. Feruglio, R. Gatto, and G. Nardulli, Phys. Lett. B 292 (1992) 371; 299 (1993) 139; A. Deandrea, N. Di Bartolomeo, R. Gatto, and G. Nardulli, Phys. Lett. B 318 (1993) 549.
- [5] R. Aleksan, A. Le Yauoanc, L. Oliver, O. Pène, and J.C. Raynal, Phys. Rev. D 51 (1995) 6235.
- [6] M. Gourdin, A.N. Kamal, and X.Y. Pham, Phys. Rev. Lett. 73 (1994) 3355.
- [7] H. Albrecht et al., Phys. Lett. B 340 (1994) 217.
- [8] M.S. Alam et al., Phys. Rev. D 50 (1994) 43.
- [9] F. Abe et al., Phys. Rev. Lett. 75 (1995) 3068;
- [10] J.G. Körner and G.R. Goldstein, Phys. Lett. B 89 (1979) 105.
- [11] I. Dunietz, H. Quinn, A. Snyder, W. Toki, and H.J. Lipkin, Phys. Rev. D 43 (1991) 2193.
- [12] A.S. Dighe, I. Dunietz, H.J. Lipkin and J.L. Rosner, Phys. Lett. B 369 (1996) 144.
- [13] See, for example, M. Jacob and G.C. Wick, Ann. Phys. (N.Y.) 7 (1959) 404.
- [14] Y. Kubota, et al., Nucl. Instr. Meth. A 320, (1992) 66.
- [15] R. Balest et al., Phys. Rev. D 52 (1995) 2661.
- [16] W.F. Palmer and E.A. Paschos, Ohio State University Report No. OHSTPY-HEP-97-003.
- [17] D. Aston et al., Nucl. Phys. B 296, (1988) 493.
- [18] M. Bishai et al., Phys. Lett. B 369 (1996) 186.
- [19] D.M. Schmidt, R.J. Morrison and M.S. Witherell, Nucl. Instr. Meth. A 328, (1993) 547.
- [20] B. Barish et al., Phys. Rev. D 51 (1995) 1014, with , Ref. [22].
- [21] G.P. Lepage, Phys. Rev. D 42 (1990) 3251.
- [22] R.M. Barnett et al., Phys. Rev. D 54 (1996) 1.