An Improved Determination of From Neutrino-Nucleon Scattering
Abstract
We present an improved determination of the proton structure functions and from the CCFR -Fe deep inelastic scattering (DIS) experiment. Comparisons to high-statistics charged-lepton scattering results for from the NMC, E665, SLAC, and BCDMS experiments, after correcting for quark-charge and heavy-target effects, indicate good agreement for but some discrepancy at lower . The evolution of both the and structure functions yields the quantum chromodynamics (QCD) scale parameter (exp.). This corresponds to a value of the strong coupling constant at the scale of mass of the -boson of (exp.)(theory) and is one of the most precise measurements of this quantity.
pacs:
PACS numbers: 13.15.+g, 12.38.Qk, 24.85.+p, 25.30.PtHigh-energy neutrinos are a unique probe for testing QCD and understanding the parton properties of nucleon structure. Combinations of neutrino and antineutrino scattering data are used to determine the and structure functions (SFs) which determine the valence, sea, and gluon parton distributions in the nucleon [1, 2]. The universalities of parton distributions can also be studied by comparing neutrino and charged-lepton scattering data. Past measurements have indicated that differs from by 10-20% in the low- region. These differences are larger than the quoted experimental errors of the measurements and may indicate the need for modifications of the theoretical modeling to include higher-order or new physics contributions. QCD predicts the scaling violations ( dependence) of and and, experimentally, the observed scaling violations can be tested against those predictions to determine [3] or the related QCD scale parameter, . The determination from neutrino scattering has a small theoretical uncertainty since the electroweak radiative corrections, scale uncertainties, and next-to-leading order (NLO) corrections are well understood.
In this paper, we present an updated analysis of the Columbia-Chicago-Fermilab-Rochester (CCFR) collaboration neutrino scattering data with improved estimates of quark model parameters [4] and systematic uncertainties. The measurement from this analysis is one of the most precise due to the high energy and statistics of the experiment compared to previous measurements [5, 6].
The differential cross sections for the - charged-current process , in terms of the Lorentz-invariant structure functions , , and are:
| (2) | |||||
where is the weak Fermi coupling constant, is the nucleon mass, is the incident neutrino energy, is the square of the four-momentum transfer to the nucleon, the scaling variable is the fractional energy transferred to the hadronic vertex with equal to the measured hadronic energy, and , the Bjorken scaling variable, is the fractional momentum carried by the struck quark. The structure function is expressed in terms of by , where is the ratio of the cross-section of longitudinally to transversely-polarized -bosons. In the leading-order quark-parton model, is the singlet distribution , the sum of the momentum densities of all interacting quark constituents, and is the non-singlet distribution , the valence quark momentum density; these relations are modified by higher-order QCD corrections.
The neutrino DIS data were taken in two high-energy high-statistics runs, FNAL E744 and E770, in the Fermilab Tevatron fixed-target quadrupole triplet beam (QTB) line by the CCFR collaboration. The detector, described in Refs. [7, 8], consists of a target calorimeter instrumented with both scintillators and drift chambers for measuring the energy of the hadron shower and the muon angle , followed by a toroid spectrometer for measuring the muon momentum . There are 950,000 events and 170,000 events in the data sample after fiducial-volume cuts, geometric cuts, and kinematic cuts of , , , and , to select regions of high efficiency and small systematic errors in reconstruction.
In order to calculate the SF in Eq. (2) from the number of observed and events, it is necessary to determine the and flux. No direct measurement of the absolute flux was possible in the QTB. The absolute normalization of the flux was fixed to the constraint that the neutrino-nucleon total cross-section equaled the world average of the isoscalar-corrected Fe target experiments, [9, 10]. The relative flux determination, i.e. the ratio of the flux between different energies and between and , was determined from the low- events using a technique described in Ref. [11, 9, 12]. The cross-sections, multiplied by the flux, are compared to the observed number of - and - events in an and bin to extract and .
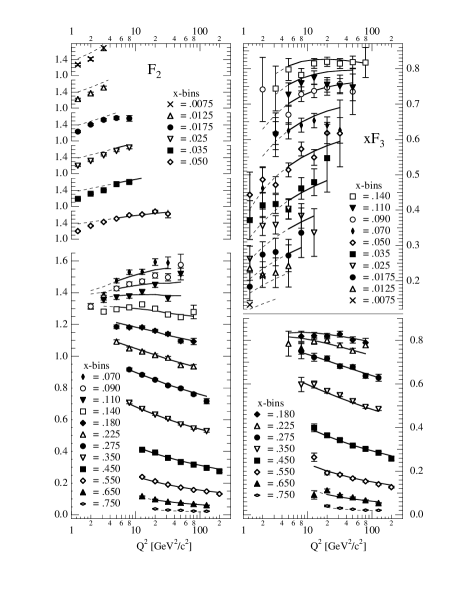
SFs extracted from the CCFR data have been previously presented [13]. In the earlier analysis, the muon and hadron energy calibrations were determined using a Monte Carlo technique in an attempt to reduce the dominant source of systematic error in the analysis, the relative calibration between the muon and hadron energies. Our subsequent analysis determined that the control of systematic errors for this technique was insufficient to justify its continued use. This paper presents a re-extraction of the SFs that uses the calibrations directly determined from the test beam data collected during the course of the experiment [7, 8], which results in a net change of +2.1% in the relative calibration and an increase in the corresponding systematic error to 1.4%. Other changes in the SF extraction include more complete radiative corrections [14], and the value of now used in the extraction comes from a global fit to the world’s measurements [15]. In addition, the estimates of the experimental and theoretical systematic errors in the analysis are improved [11]. The structure functions are corrected for radiative effects [14], the non-isoscalarity of the Fe target, the charm-production threshold [16, 17], and the mass of the -boson propagator. The SFs with statistical errors, along with the QCD fits described below, are shown in Fig. 1 [18].
The structure function from DIS on iron can be compared to from and DIS on isoscalar targets. To make this comparison, two corrections must be made to the charged-lepton data. For deuterium data, a heavy nuclear target correction must be made to convert to . This correction was made by parameterizing the data from SLAC and NMC [19]. from electromagnetic interactions couples to the constituent quarks with the square of the quark electric charge. Thus a second correction is necessary:
| (3) |
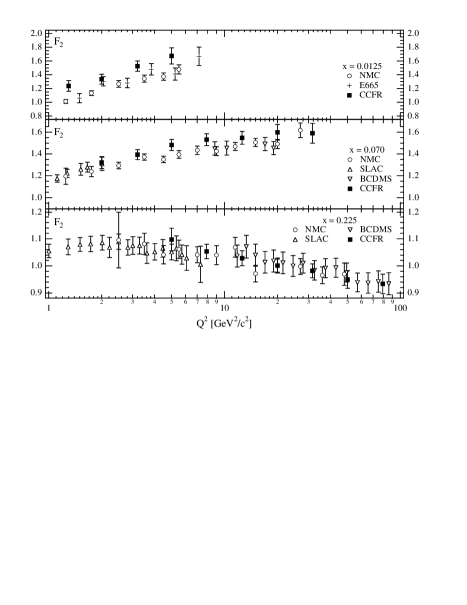
This formula is exact to all orders in QCD in the DIS renormalization scheme, so for the purposes of this comparison the charged-lepton structure functions were corrected according to Eq. (3) with quark distributions given by CTEQ4D [2], which parameterizes the parton densities in the DIS scheme. The errors on the nuclear and charge corrections are small compared to the statistical and systematic errors on both the CCFR and NMC data. The corrected structure functions from NMC, E665, SLAC, and BCDMS [20, 21] for selected -bins are shown in Fig. 2. There is a 15% discrepancy between the NMC charged-lepton and the CCFR neutrino at . As the value of increases, the discrepancy decreases, until there is agreement between CCFR and the charged-lepton experiments above .
The discrepancy between CCFR and NMC at low is outside the experimental systematic errors quoted by the groups and several suggestions for an explanation have been put forward. One suggestion [22], that the discrepancy can be entirely explained by a large strange sea, is excluded by the CCFR dimuon analysis which directly measures the strange sea [23]. Other suggestions are that the strange sea may have a different distribution than the normally-assumed form [24], or that the heavy nuclear target correction may be different between neutrinos and charged leptons. More experimental data will be necessary to resolve this issue.
According to perturbative QCD (PQCD), the dependence of the quark momentum densities is described by “evolution equations” [3]. The evolution of the non-singlet distribution does not depend on assumptions about the gluons, but the singlet distribution co-evolves with the gluon distribution. The previous CCFR analysis [13] only compared the SF to the non-singlet evolution. This analysis takes advantage of the ability of neutrino DIS to measure both and , and simultaneously evolves the non-singlet, singlet, and gluon distributions for a more precise determination of .
Systematic uncertainties in the structure function extraction were investigated, leading to correlated errors for each of the data points in Fig. 1. The largest sources of systematic error in the determination of are the muon and hadron absolute energy calibrations. The error in the energy calibration was measured to be 1% for [8], and 1% for for the E744 and E770 data separately [7]. Another major source of systematic error is the error in the value of , the ratio of the total to cross-section. The value chosen was the world average of -Fe DIS experiments, including this one [10, 11], . Other sources of systematic error were investigated, including systematic errors in the flux extraction and variations in the physics model used in the Monte Carlo, but the effects of these other sources were small [11]. To determine the uncertainty for each source, the structure functions and are extracted with the given systematic quantity changed by one error unit up and down, where an “error unit” is the best estimate of the systematic error prior to the fit described below. The difference of these modified structure functions and the standard ones gives the point-to-point correlated systematic errors in and for each bin. Complete tables of errors can be found in Ref. [11, 18].
For the PQCD analysis of the structure functions, we performed a fit which minimizes the difference between a theoretical prediction and the measured values of and in each bin. The theoretical prediction is obtained using the Duke and Owens NLO QCD evolution program [25, 11]. The prediction incorporates a parameterization of the parton distributions for the singlet, non-singlet, and gluon distributions at a reference value as shown in Table I and includes as a fit parameter. The prediction is compared to the structure function data using a that includes the statistical errors (including the correlations) and the correlated systematic uncertainties. The systematic errors are included by introducing a parameter for each systematic uncertainty. This parameter controls the amount of systematic deviation added to the structure function and is also included in the function (Eq. (5)). For this procedure, we define the structure-function vector = and the structure-function statistical error matrix for . Then the for a global fit is given by:
| (4) |
| (5) |
where are the measured values as shown in Fig. 1, are the predictions from the evolution program that depend on fit parameters including , and are the structure functions measured with the -th systematic uncertainty changed by one standard error.
The effects of target mass [17] were included in the fit. Calculations of the effects of higher-twist terms (HT) have recently become available [26] and are in agreement with the measurements of the HT [27]. However, the data in Ref. [27] were analyzed with a value of smaller than our present value which would increase the measurement of HT. An analysis of HT from preliminary CCFR data [28] indicates that the calculation of Ref. [26] yields HT that are too large. For this analysis, the values of the and HT corrections were taken to be one-half the values from Ref. [26], with a conservative systematic error given by repeating the fit with no HT correction and with the full HT from Ref. [26].
Cuts of and the invariant mass-squared of the hadronic system were applied to the data to include only the perturbative region, and an cut includes the -bins where the resolution corrections are insensitive to Fermi motion. The cut implies an effective limit of . The best QCD fits to the data are shown in Fig. 1, and the results of the fit are shown in Table I. The values from the fit are all zero within two standard deviations, and have errors that range from 0.12 to 0.98. The fact that these errors are all less than 1.0 indicates that the data coupled with the theory of QCD forms a more restrictive constraint on the systematic error than the variations described above.
From this fit, we obtain a measured value of in NLO QCD for 4 quark flavors of (exp.)(HT), which yields (exp.)(HT)(scale), where the error due to the renormalization and factorization scales comes from Ref. [27]. The fit also yields a measurement of the gluon distribution in the region which is consistent with gluon distributions given in Refs. [1, 2]. A fit to only the data, which is not coupled to the gluon distribution, gives (exp.)(HT), which is consistent with the result of the combined and fit but has larger errors because effectively only half the data are used. If the systematic uncertainties are not allowed to vary in the and fit and all effects of systematic uncertainties are added in quadrature, the value of is found to be (stat.)(syst.).
This result is higher than our previous measurement [13], (stat.)(syst.), mainly due to effects of the new energy calibrations. The current measurement is also larger than the muon DIS result by the SLAC/BCDMS collaboration [27], (exp.)(theory); note that this theoretical error and the CCFR theory error are from the same calculation. The low- discrepancy in between CCFR and NMC has a negligible effect on the measurement which is derived mainly from the high- data.
In summary, a comparison of from DIS to that from charged-lepton DIS shows good agreement above but a difference at smaller that grows to 15% at . We have presented a new, high-precision measurement of from a fit to the simultaneous evolution of and . This corresponds to a value of (exp.)(theory) and is the most precise DIS measurement of this quantity.
REFERENCES
- [1] M. Glück, E. Reya, A. Vogt, Z. Phys. C67: 433 (1995); A. D. Martin, R. G. Roberts, W. J. Stirling; DTP/96/44, RAL-TR-96-037 (1996).
- [2] H. L. Lai et al., Phys.Rev. D55: 1280 (1997).
- [3] G. Altarelli and G. Parisi, Nucl. Phys. B126: 298 (1977); V. N. Gribov and L. N. Lipatov, Sov. J. Nucl. Phys. 15: 438 (1972); Yu. L. Dokshitzer, Sov. Phys. JETP 46, 641 (1977).
- [4] S. A. Rabinowitz et al., Phys. Rev. Lett. 70: 134 (1993).
- [5] P. Berge et al., Z. Phys. C49: 187 (1991).
- [6] E. Oltman et al., Z. Phys. C53: 51 (1992).
- [7] W. K. Sakumoto et al., Nucl. Instrum. Meth. A294: 179 (1990).
- [8] B. J. King et al., Nucl. Instrum. Meth. A302: 254 (1991).
- [9] P. S. Auchincloss et al., Z. Phys. C48: 411 (1990).
- [10] R. Blair et al., Phys. Rev. Lett. 51: 343 (1983); P. Berge et al., Z. Phys. C49: 187 (1991).
- [11] W. G. Seligman, Ph. D. Thesis, Nevis Report 292.
- [12] R. Belusevic and D. Rein, Phys. Rev. D38: 2753 (1988).
- [13] P. Z. Quintas et al., Phys. Rev. Lett. 71: 1307 (1993).
- [14] D. Yu. Bardin, V. A. Dokuchaeva, JINR-E2-86-260 (1986).
- [15] L. W. Whitlow et al., Phys. Lett. B250: 193 (1990).
- [16] R. M. Barnett, Phys. Rev. Lett. 36: 1163 (1976).
- [17] H. Georgi and H. D. Politzer, Phys. Rev. D14: 1829 (1976).
- [18] Complete tables of the CCFR SF results can be obtained from the World Wide Web via the URL ftp://www.nevis.columbia.edu/pub/ccfr/seligman.
- [19] P. Amaudruz et al., Nucl. Phys. B441: 3 (1995); R. G. Arnold et al., Phys. Rev. Lett. 52: 727 (1984); J. Gomez et al., Phys. Rev. D49: 4348 (1994); M. R. Adams et al., Z. Phys. C67: 403 (1995).
- [20] M. Arneodo et al., Nucl. Phys. B483: 3 (1997).
- [21] M.R. Adams et al., Phys.Rev. D54: 3006 (1996); L. W. Whitlow, Ph.D. Thesis, SLAC-REPORT-357 (1990); A.C. Benvenuti et al., Phys. Lett. B237: 592 (1990).
- [22] J. Botts et al., Phys. Lett. B304: 159 (1993).
- [23] A. O. Bazarko et al., Z. Phys. 65: 189 (1995).
- [24] S. Brodsky and B. Ma, Phys. Lett. B381: 317 (1996).
- [25] S A. Devoto et al., Phys. Rev. D27: 508 (1983).
- [26] M. Dasgupta and B. R. Webber, Phys. Lett. B382: 273 (1996).
- [27] M. Virchaux and A. Milsztajn, Phys. Lett. B274: 221 (1992).
- [28] A. V. Sidorov, HEP-PH-9607275 (Jul 1996).
| Parameter | Fit Results | Parameter | Fit Results |
|---|---|---|---|